Abstract
The effect of instrumental correction on X-ray line profile analysis was discussed in cold rolled low carbon ferritic steel. It was confirmed that the effect of instrumental broadening is underestimated by utilizing Gaussian correction in comparison with Voigt correction. The values of micro-strain, which were evaluated by the recently developed direct fitting method, were overestimated slightly in Gaussian correction. As a result, the following equations were established in the relation between micro-strain (ε) and dislocation density (ρ) for each case:
ρ [m−2] ≒ 1.5×10²⁰ ε2 (Gaussian correction)
ρ [m−2] ≒ 1.9×10²⁰ ε2 (Voigt correction)
1. Introduction
Since the full width at half maximum (FWHM: βm) in X-ray diffraction (XRD) peaks contains the information about dislocation density and crystallite size, XRD is widely used to evaluate the micro-strain in highly dislocated metals.1) However, it should be noted that the original βm contains the effect of instrumental broadening. In order to obtain accurate results, it is essential to correct the effect of instrumental broadening. The magnitude of instrumental broadening is different depending on the equipment used for the diffraction analysis, thus the instrumental broadening has to be evaluated in each equipment by using standard sample.2,3,4) For example, Fig. 1 shows the relation between diffraction angle θ and instrumental broadening β0 in the commercial and well annealed low carbon ferritic steel (0.0056% C steel). Good agreement is found in both samples and β0 value gradually increases with an increase of diffraction angle. If diffraction peaks can be fitted by Lorentz function (mainly crystallite size broadening), the corrected β value of measured specimen is obtained by the following equation (i.e. Lorentz correction):2,3,4)
In the case that diffraction peaks can be fitted by Gaussian function (mainly lattice distortion broadening), the corrected value of
β is obtained as below (
i.e. Gaussian correction):
2,3,4)
|
β=
(
β
m
2
-
β
0
2
)
1/2
| (2) |
Since actual diffraction peaks generally give the mix of both components, the effect of instrumental broadening should be corrected taking the constituent of Lorentz and Gaussian functions into consideration,
i.e., Voigt correction.
2,3,4)
It is well-known that the effect of instrumental broadening is overestimated by Lorentz correction. Hence Eq. (2) has been applied for the correction of instrumental broadening in many cases.2,3,4,5) When βm value is much larger than β0 value, it is expected that the correction errors for instrumental broadening is not so significant. However, in the case that βm value is not so large in comparison with β0 value, the instrumental correction should give clearer effect on the analyzed results. Cold worked ferritic steel just fits to this case, because dislocation density in cold worked materials is not so high and cell size is large.4,6) Therefore, in this paper, the effect of instrumental correction on X-ray line profile analysis was discussed in cold rolled low carbon ferritic steel (0.0056% C steel). The detailed experimental procedure is given in recent publication.4)
2. Correction of Elastic Anisotropy in the Williamson-Hall Plots by the Direct Fitting Method
To estimate the micro-strain ε in highly dislocated metals, Williamson and Hall proposed the following equation:1)
|
βcosθ/λ=(0.9/D)+ε(2sinθ/λ)
| (3) |
where
D denotes the crystallite size. The above equation is simplified as following putting
βcos
θ/
λ = Δ
K, (0.9/
D) =
α, 2sin
θ/
λ =
K:
The plot in the relation of
K vs. Δ
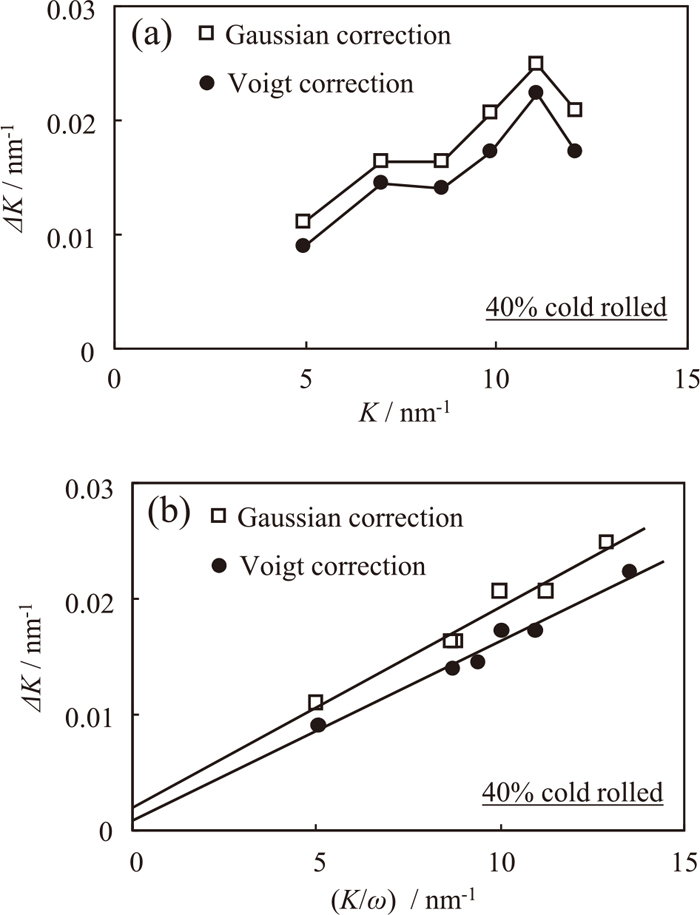
K is referred as Williamson-Hall (WH) plots. As an example,
Fig. 2(a) shows the WH plots in 40% cold rolled specimen. Since there is elastic anisotropy in each crystal plane, the plotted data are characterized by irregular arrangement. It is found that higher values are obtained in Gaussian correction because the effect of instrumental broadening has been underestimated.
The value of micro-strain ε is not well obtained in the original WH plots because of clear strain anisotropy. Recently, the effect of elastic anisotropy can be corrected moderately by the direct fitting (DF) method.4) In DF method, the parameter ω, i.e. Young’s modulus ratio, is applied to correct the irregular effect from strain anisotropy in WH plots:
where
Ehkl and
E0 are the diffraction Young’s modulus in {hkl} crystal plane and the standard Young’s modulus (
E0 = 226.3 GPa for bcc-Fe), respectively.
4) Then DF method can corrected WH plots to a coveted linear relation by the following equation:
4)
The DF plots are shown in
Fig. 2(b). Elastic anisotropy has been corrected moderately and the linear relations as follows are realized:
|
ΔK=0.0018+0.0018(K/ω) (Gaussian correction)
| (7) |
|
ΔK=0.0008+0.0016(K/ω) (Voigt correction)
| (8) |
The
ε values are 0.0018 and 0.0016 in Gaussian and Voigt corrections, respectively. It should be noted that small difference is found in the analyzed results. In specimens with various amounts of cold rolling, the same process was applied to estimate the
ε values. The results are summarized in
Fig. 3. As a result, it is concluded that the values of micro-strain are slightly overestimated in Gaussian correction.
3. Relation between Micro-strain and Dislocation Density
In cold worked metals, the increment of strength (Δσ) is proportional to square root of dislocation density (ρ1/2), so called Bailey-Hirsch relation. Transmission electron microscopy (TEM) is also a useful tool to evaluate dislocation density and there are several reports for cold worked iron.6,7,8,9) Authors summarized the reported results and indicated that the following Bailey-Hirsch relation stands up for cold worked iron:10)
|
Δσ[GPa]≒1.8×
10
-8
(ρ[
m
-2
])
1/2
| (9) |
In this study, dislocation density was first estimated from the combined TEM-yield stress method (
Eq. (9)) in cold rolled specimens. The increment of strength was evaluated by the difference between the friction stress and yield stress. Further, the dislocation density (
ρmWH/mWA) was also estimated by the modified Williamson-Hall/modified Warren Averbach (mWH/mWA) method.
11) Figure 4(a) gives the omparison of Bailey-Hirsch plots with different dislocation density estimation methods,
i.e., combined TEM-yield stress method (
Eq. (9)) and mWH/mWA method (
ρmWH/mWA). Very good agreement is indicated. When considering the measurement errors in both methods, the dislocation density was evaluated precisely.
Further, Fig. 4(b) shows the relation between micro-strain ε and dislocation density ρ. It was theoretically confirmed that the dislocation density is proportional to square of micro-strain.12) In this study, it was reconfirmed that good linearly is realized in the relation of ρ vs. ε2 but the coefficients are different depending on the correction process for instrumental broadening as follows:
|
ρ[
m
-2
]≒1.5×
10
20
ε
2
(Gaussian correction)
| (10) |
|
ρ[
m
-2
]≒1.9×
10
20
ε
2
(Voigt correction)
| (11) |
As mentioned above, the
ε value is overestimated in Gaussian correction so that the coefficient against
ε2 becomes smaller in
Eq. (10). This result suggests the importance of the correction process for instrumental broadening in X-ray line profile analysis. To obtain accurate results, it is recommended to apply Voigt correction and use
Eq. (11) for the estimation of dislocation density in ferritic steel which generally gives slight crystallite size effect.
4,13,14)
Acknowledgement
This research was performed by the support of JSPS, KAKENHI Grant number JP15H05768. This work was also partially supported by the Research Society for quantum-beam analysis of microstructures and properties of steels.
References
- 1) G. K. Williamson and W. H. Hall: Acta Metall., 1 (1953), 22.
- 2) T. H. D. Keijser, J. I. Langford, E. J. Mittemeijer and A. B. P. Vogels: J. Appl. Crystallogr., 15 (1982), 308.
- 3) S. Sato, K. Wagatsuma, S. Suzuki, M. Kumagai, M. Imafuku, H. Tashiro, K. Kajiwara and T. Shobu: Mater. Charact., 83 (2013), 152.
- 4) S. Takaki, F. Jiang, T. Masumura and T. Tsuchiyama: ISIJ Int., 58 (2018), No. 4, 769.
- 5) J. Syarif, K. Nakashima, T. Tsuchiyama and S. Takaki: ISIJ Int., 47 (2007), No. 2, 340.
- 6) D. J. Dingley and D. MacLean: Acta Metall., 15 (1967), 885.
- 7) A. S. Keh and S. Weissmann: Electron Microscopy and Strength of Crystals, Interscience Publishers, New York, (1963), 231.
- 8) Y. Lan, H. J. Klaar and W. Dahl: Metall. Trans. A, 23A (1992), 545.
- 9) A. J. Goldman: Trans. ASM, 57 (1964), 900.
- 10) D. Akama, T. Tsuchiyama and S. Takaki: J. Soc. Mater. Sci. Jpn., 66 (2017), 522.
- 11) T. Ungár and A. Borbély: Appl. Phys. Lett., 69 (1996), 3173.
- 12) G. K. Williamson and R. E. Smallman: Philos. Mag., 8 (1956), 34.
- 13) S. Sato, K. Wagatsuma, M. Ishikuro, E. P. Kwon, H. Tashiro and S. Suzuki: ISIJ Int., 53 (2013), No. 4, 673.
- 14) W. Carrington, K. F. Hale and D. McLean: Proc. R. Soc. Lond. A, 259 (1960), No. 1297, 203.