Fundamentals of High Temperature Processes
A Semi-Empirical Model of Particle Velocity in Foam
2018 Volume 58 Issue 7 Pages 1368-1370
Details
2018 Volume 58 Issue 7 Pages 1368-1370
A semi-empirical model was developed to predict the apparent velocity of particles falling through foams. Different foams were generated from liquids with different viscosities and surface tensions. Particles with different sizes and densities were dropped into the foam and average velocities were calculated. Based on the experimental work, the semi-empirical model was derived from an energy balance between buoyancy, drag and the energy needed for the particles to deform the bubbles in their path.
In the BOF-converter process of steel-making, oxygen is blown on the steel bath. Droplets are torn off and end up in an emulsion of slag, steel and gas.1) It is commonly agreed that the reactions between the droplets and the foamed slag contribute greatly to the BOF process. A better understanding of the interaction between the foam and steel droplets is essential to improve the process. Since the residence time of the droplets in the emulsion holds the key of the slag-metal reaction in the emulsion, a study on the droplet velocity in foam would be the necessary first step towards this understanding. Some researchers have already developed models of the terminal velocity of particles moving in emulsions,2,3) but difficulties in describing the “apparent viscosity” of multi-phase mixtures have greatly affected the accuracy of the models. Already in 1905, Albert Einstein presented a theoretical model to describe the apparent viscosity, k*, of a liquid suspension containing rigid spheres.4) His model has been widely recognized and employed, even for foams.5,6) Today, Einstein-Roscoe, Krieger-Dougherty and Volume fraction equation are examples of models that are widely used to describe the apparent viscosity of two-phase mixtures.5,7,8) All these models take the volume fraction into account and assume that foams act Newtonian, even though they have been recognized as shear-thinning non-Newtonian.5,9,10,11) Using models that describe the emulsion as Newtonian in calculations will most likely result in great uncertainties.
The present work focuses on the development of a semi-empirical and semi-theoretical model to estimate the average velocity of a particle/droplet in foam. First, the movements of different particles in foams generated by different liquids are experimentally studied. Based on the experimental results, a semi-empirical model is derived using an energy balance between buoyancy, drag and the energy needed for the particles to deform the bubbles in their path.
Since the movement of a particle in a foam depends on the dynamic viscosity and surface tension of the liquid phase, different liquids were employed. In view that the movement also depends on the size and density of the particle, particles of different materials in different sizes were used in the experiment, presented in Table 1. The densities were calculated using the weights and the volumes of the particles.
| Material | Density [kg/m3] | Diameter [mm] |
|---|---|---|
| Steel | 7780 | 2, 3, 5 |
| Alumina | 3540 | 3, 5, 8 |
| Polyethylene | 1150 | 3, 5, 8 |
To obtain liquids with different properties, a supersaturated and super cooled sugar solution with a density of 1050 kg/m3 at 293 K was used, and water and dish soap were added to obtain desired properties. An RTW-10 digital viscometer was used to measure the viscosity and sessile droplet technique was employed to determine the surface tension of the prepared liquid.
The experimental setup is similar to a previous work by the authors,10) a Plexiglas cylinder with inner diameter 0.09 m and height 0.4 m was employed as vessel, and a silica filter with pore size 16–40 μm was assembled 0.1 m from the bottom. A prepared liquid was added to the vessel and air was introduced from the bottom, which passed through the filter into the liquid generating a foam. When a foam was generated and stable, a particle was dropped into the foam. The residence time was measured and the velocity was calculated. At least 10 measurements were made for each particle type. The different liquids and their foaming properties are presented in Table 2, where μliquid is the viscosity of liquid phase, σliquid the surface tension, hliquid the height of the pure liquid and hfoam the foaming height. The bubble size was measured with a ruler to approximately Ø2 mm with small size distribution. Since the size could not be seen to vary between the different experiments, it was fixed to only Ø2 mm.
| µliquid [Pa∙s] | σliquid [N/m] | hliquid [m] | hfoam [m] | |
|---|---|---|---|---|
| Foam 1.1 | 0.1 | 0.015 | 0.035 | 0.23 |
| Foam 1.2 | 0.1 | 0.03 | 0.035 | 0.13 |
| Foam 1.3 | 0.1 | 0.04 | 0.034 | 0.18 |
| Foam 1.4 | 0.1 | 0.05 | 0.031 | 0.18 |
| Foam 2.1 | 0.2 | 0.015 | 0.031 | 0.17 |
| Foam 2.2 | 0.2 | 0.03 | 0.036 | 0.17 |
| Foam 2.3 | 0.2 | 0.04 | 0.035 | 0.16 |
| Foam 2.4 | 0.2 | 0.05 | 0.035 | 0.16 |
| Foam 3.1 | 0.3 | 0.015 | 0.02 | 0.13 |
| Foam 3.2 | 0.3 | 0.03 | 0.035 | 0.13 |
| Foam 3.3 | 0.3 | 0.04 | 0.02 | 0.1 |
| Foam 3.4 | 0.3 | 0.05 | 0.02 | 0.1 |
Most of the particles fell in a zick-zack pattern through the foam, pushed aside by the bubbles. This behavior is in accordance with a previous work by the present authors.10) Due to the zick-zack movement, the calculated velocities can only be considered as apparent velocities.
The behaviors of the particles were found to be different, and can be classified into three regimes. Regime 1: Particles with small mass relative to their size, which got stuck in the foam and could never reach the bottom. All polyethylene particles belong to this regime. Regime 2: Particles with too big mass and crushed the bubbles in the foam, falling almost as if there was only a gas phase. The steel and alumina particles ≥ 5 mm belong to this regime. Lastly, regime 3: Particles with mediate mass. These particles fell gently between the bubbles in a zick-zack pattern. The steel and alumina particles less than 5 mm belong to this regime. As an example, the apparent velocity of Ø3 mm alumina are presented in Fig. 1. It is evidently shown that the particle velocity is depending on both the surface tension and dynamic viscosity of the liquid phase.

The apparent velocity of Ø3 mm alumina plotted against surface tension.
A particle falling through a foam is not only affected by the buoyancy and drag force, but also every collision with the bubbles in its path. During each collision, the particle must deform and/or push the bubbles aside before it may continue to fall. Since foams are reported to be non-Newtonian fluids,10,11) and in view of the complexity of the forces involved in a foam-particle system, an energy balance approach is adopted in the model development. When a particle moves a distance in the foam, the work done on it consists of two contributions, viz. the work done by buoyancy force, Wb, and by drag force, Wd. These two works is balanced by the energy required to move and deform the bubbles, E:
| (1) |
Assuming a particle moves a vertical distance of hfoam, Eq. (1) leads to Eq. (2)
| (2) |
| (3) |
The first term in Eq. (3) is the work done by the buoyancy force. p1 is a reasonable added parameter since the particles fall somehow in between the bubbles, both in gas and liquid, altering the buoyancy anti-gravity term. The second term in Eq. (3) is the work done by drag force. In fact, the drag force imposed on a particle in a foam is very different from the case of pure liquid. It has been shown that foam is a shear-thinning non-Newtonian fluid.10,11) It is also reported that the apparent viscosity of the foam is a few times higher than the dynamic viscosity of the liquid. Considering these unknowns, parameter p2 is used for the work term done by drag force. The third term in Eq. (3) is the surface energy term. Since it is difficult to know to what degree bubbles are deformed, how long distance bubbles are pushed aside, and the degree of deformation of the bubbles not in direct contact with the particle, parameter p3 is used to take these factors into account. Considering that bigger particles collide with more bubbles and have to move bubbles longer distance than small particles, the particle diameter is added to this term to take this factor into account.
By rearranging Eq. (3), an expression of the apparent velocity can be derived:
| (4) |
Since the number of bubbles is calculated by dividing the foam height with the bubble diameter, the equation can be developed into Eq. (5).
| (5) |
To optimize the model parameters, the experimental results obtained for the particles in regime 3 are employed. A non-linear curve fitting tool was used for the optimization of the parameters which leads to the final equation.
| (6) |
An examination of Eq. (6) reveals that the apparent velocity increases with the increase of particle diameter and the increase of the density of the material. Equation (6) also indicates that the apparent velocity increases with the decrease of surface tension and the increase of bubble size. The model also shows that the particle velocity decreases with increased dynamic viscosity of the liquid.
The results of the model calculation are compared with the experimental data in Fig. 2 for the particles in regime 3. The figure shows satisfactory agreement between the experimental results and model calculation. Since the velocities of the particles in regime 3 are very low, it could be interesting to compare the model prediction and the experimental data with Stokes law, which is also added to Fig. 2. Since Stokes law doesn’t take the surface tension into consideration, the velocity difference caused by surface change cannot be predicted. It is evidently shown that the velocities calculated by Stokes law are much higher, even ten times higher, than the measured ones as well as the present model prediction. The comparison in Fig. 2 illustrates evidently that the surface energy term plays a profound role in determining the velocity of a particle in a foam.
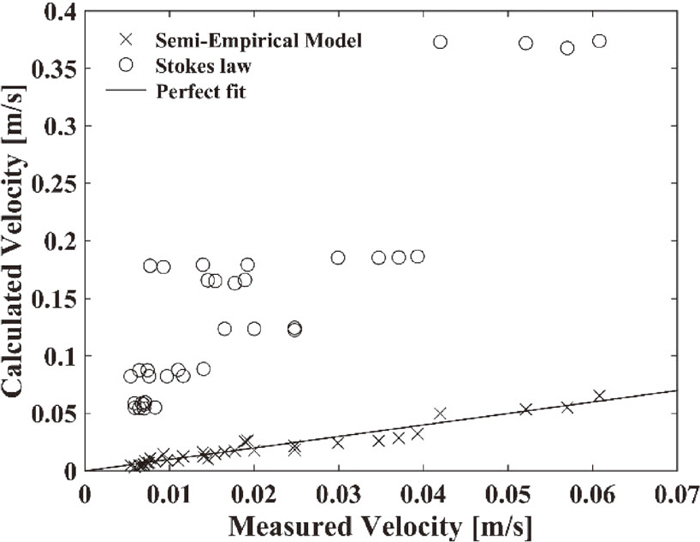
A comparison between the Empirical model, measured values and Stokes law.
It is worthwhile to remind the reader that Eq. (6) is optimized for particles with maximum size 3 mm. Nevertheless, in a steel-making perspective, the majority of the droplets in a BOF-converter have been reported in the size range between 20–500 μm.12) The present model could be well employed in this range.
It is difficult to compare the semi-empirical model and the experimental results from this work to a BOF-converter. First of all the characteristics and structure of the BOF emulsion are very different compared to the foams generated in this work, for example bubble size, bubble shape and gas fraction. Also, the apparent viscosity and surface tension, which both affect the characteristics of the foam, vary from location to location in the BOF furnace depending on temperature and composition. More studies have to be carried out to determine how these properties change in the furnace to improve the model. Secondly, it is not known how the liquid metal droplets fall in the emulsion; if the droplets move within the liquid phase or if they move along the gas-liquid interface. At the same time, dephosphorization and decarburization take place which may affect the movement of the droplet.14) It is also difficult to compare the two different systems since the gas injection in the BOF, which creates a chaos inside the furnace, is not taken into account in the experimental setup. What can be said, is that the residence time can be very long since it is evident that the bubbles in the foam partly decide the path of the droplets, and the energy needed to deform them decreases the velocity of the droplets. But again, experiments need to be carried out using real foaming slag to better improve the model.
A semi-empirical model has been successfully derived from an energy balance between buoyancy, drag and the energy needed for a particle to deform the bubbles in its path. The model fits the empirical data well. It is shown that the apparent velocity of a particle falling through a foam is depending on (1) particle mass in relation its size, (2) surface tension of liquid phase and (3) the dynamic viscosity of liquid phase.
Gratitude is directed towards Northeastern University, Shenyang, especially Prof. Miaoyong Zhu, for providing their facilities for doing the experiments and discussions.