Abstract
The effect of post-weld heat treatment (PWHT) on the microstructure and mechanical properties of ultrasonic spot welded Cu/Al dissimilar joints was studied in this paper. PWHT was performed for 1 h at four different temperatures of 200°C, 300°C, 400°C and 500°C, respectively. The microstructure and mechanical properties of joints were investigated by SEM, EDS, X-ray diffractometer, Microhardness tester and Universal testing machine, respectively. Results showed that no obvious intermetallic (IMC) layer was found at the as-welded joint and joint after PWHT at 200°C. But relatively higher shear strength of 2.458 KN was obtained when the temperature of PWHT was 200°C. As the temperature of PWHT exceeded 300°C, the shear strength of joints reduced obviously, due to the formation of brittle Al–Cu IMC layer. However, when the joint was subjected to PWHT at 500°C, maximum shear strength of 3.138 KN was acquired resulted from the increase of the bonded area, though large numbers of cracks were found at the Cu/Al interface. Besides, obvious grain boundary penetration occurred on the Al base metal adjacent to the Cu/Al interface when the joint after PWHT at 500°C. The micro-hardness at the Cu/Al interface was significantly higher than that of the Cu or Al base metal. With the temperature of PWHT increasing, the micro-hardness decreased both in Cu and Al base metals, but increased significantly at the Cu/Al interface. Fracture mode of joints, both as-welded and after PWHT, were the mixed-mode of ductile and brittle fractures.
1. Introduction
With the development of economy, the problem of copper (Cu) resource consumption has become more and more serious, and the demand for efficient use of Cu resources has become particularly prominent.1,2) In order to alleviate the shortage of Cu resource on production as much as possible, the imperative task is to find alternative material for Cu. Aluminum alloy (Al) performs well in the respects of thermal conduction, conductivity, corrosion resistance and processability. It also has advantage of small density and low cost. Therefore, Al can replace Cu and meet actual requirements in some fields, such as cell phone battery, air-conditioning condenser pipe, and so on.3,4) Statistical data show that the application of Cu/Al joints account for 5.8% of the dissimilar metal joints in the 21st Century.5) Therefore, more attention has been paid to methods of Cu/Al connection.
Currently, the connection of dissimilar materials like Cu and Al can be achieved by mechanical connection, laser welding, explosive welding, ultrasonic welding and so on.6,7,8) For the mechanical connection, the electrical and thermal conductivity of Cu/Al joint will be seriously reduced, which is difficult to meet actual needs. It is a big problem that the formation of brittle intermetallic compounds (IMCs) which makes it difficult to get high quality joints during fusion welding.9,10) Therefore, the Cu/Al joints are mainly produced by use of ultrasonic welding now.
High power ultrasonic spot welding (HPUSW) is a solid-state hybrid manufacturing process that uses high-frequency ultrasonic vibration to connect similar or dissimilar materials.11) The machine of HPUSW does not send current or high temperature to the specimens during the process of ultrasonic welding. Only the vibration energy is converted into deformation energy and infinite temperature rises. Compared with other welding methods, HPUSW has many advantages, such as low requirement for specimen surface, short welding time, high efficiency, and so on.
In the field of Cu/Al ultrasonic welding, most researchers have focused on impact of parameters and interlayer on the microstructure and properties of the joint.12,13,14) However, effect of PWHT on the formation of joints has rarely mentioned. This paper mainly studied the effect of different temperature of PWHT on the microstructure and mechanical properties of the joint, hoping to provide necessary theoretical basis and technical support to the actual production of Cu/Al ultrasonic welding.
2. Experimental Work
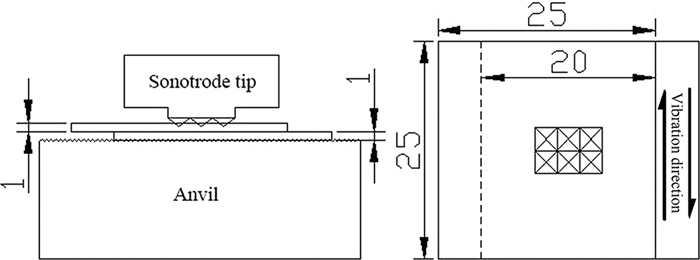
6082-T6 aluminum plates (see Table 1) and T2 Cu plates (composition in wt.%: 99.99Cu) with a thickness of 1 mm were used in this work, and the dimension of plates was 25 mm long and 25 mm wide. The faying surfaces were ground with a 600 grid sandpaper and both of the base materials were cleaned with ethanol for ten minutes using an ultrasonic cleaner and dried before welding. A dual reed 3 kW Viper-20 ultrasonic welding system operating at 20.11 kHz was employed in this study, and the sonotrode tip with dimension of 5.2 mm×7.8 mm, as shown in Fig. 1.
Table 1. Chemical compositions of 6082-T6 aluminum alloy (wt.%).
| Si | Mn | Mg | Cu | Zn | Ti | Fe | Cr | Al |
|---|
| 0.7–1.3 | 0.4–1.0 | 0.6–1.2 | 0.1 | 0.2 | 0.1 | 0.5 | 0.25 | Bal. |
The lap joint with the Cu plate positioned on top of the Al plate was adopted in the welding process. The overlapped space was 20 mm, as shown in Fig. 2. The welding energy was 1400 J, the amplitude was 9.5 μm, and the static pressure was 0.4 MPa.
After welding, PWHT was applied using a KTF series tube type vacuum resistance furnace with of the predetermined heating rate 10°C/min. The furnace was evacuated to vacuum, and then filled with flowing Ar for protection before PWHT. The temperatures of PWHT were 200°C, 300°C, 400°C and 500°C, and the holding time was 1 h, then the joint was cooled to room temperature in the furnace.
The microstructure and component of the joint were observed by Optical Microscope, Scanning Electron Microscope and Energy Scattering Spectrometer, respectively. Meanwhile, the microhardness tester was selected to measure the micro-hardness of the joint using a load of 100 gf with a 10 s dwell time. The X-ray diffractometer was used to detect the phase composition of the joint. The electro-hydraulic servo test system was used to test the lap shear strength of the joint with the help of a fixture shown in Fig. 3, and the test was carried out in air at room temperature with a constant speed of 1 mm/min. Each joint was tested three times, and the average value was taken as the shear strength of the joint.
3. Results and Discussion
3.1. Interface Characteristics and Microstructure
3.1.1. The As-welded Joint
Figure 4(a) shows the cross-sectional SEM micrograph of the as-welded joint with energy of 1400 J. It was well bonded at Cu/Al interface, and no cavities were observed in the joint. Besides, one of the notable features is that the top surface of Cu plate changed from flat to wave-like patterns when the sonotrode tip fully penetrated the specimen during welding. Another feature observed in the joint was the swirls at the Cu/Al interface, which has the potential to increase the lap shear strength due to the localized interlocking of the two metals. This was mainly attributed to the plastic flow of the base metals. Due to the high frequency vibration at the Cu/Al interface, large amount of frictional heat was generated, which caused an increase in temperature near the Cu/Al interface, and the metal there would soften. The softened Cu plate below the sonotrode tip was forced to flow into the Al base metal under the compression of the sonotrode tip when the sonotrode tip fully penetrated into the Cu plate. And the softened Al plate between the sonotrode tips simultaneously was subjected to intensive compression, causing it flowed towards the softened area, and eventually flowed into the Cu plate. Thus, the swirls formed at the Cu/Al interface. Moreover, many weld islands were observed at the Cu/Al interface, as shown in Fig. 4(b). Since the high frequency ultrasonic vibration would lead to high frequency shear stress as shown by the horizontal arrows in Fig. 4(d), parts of flowing metal were broken up by the high frequency shear stress forming the weld islands.
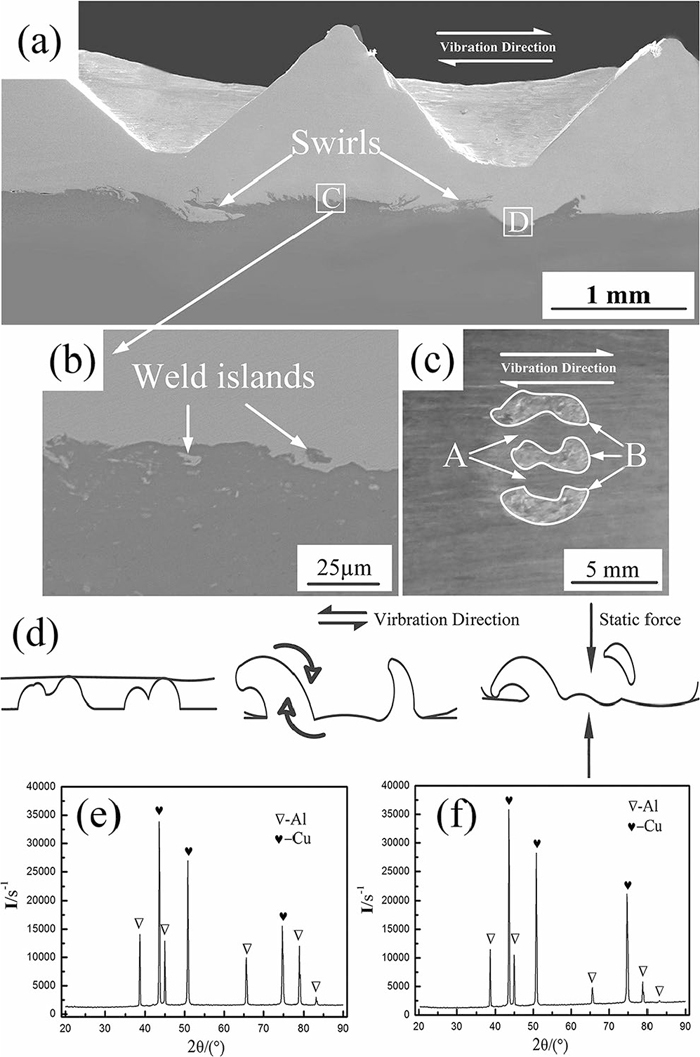
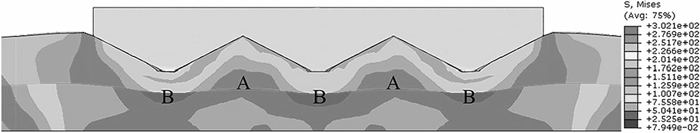
Figure 4(c) shows the macro-fracture of the as-welded joint. It can be found that the bonded areas marked as B were not only located below the sonotrode tips, but covered areas between two sonotrode tips parallel to the vibration direction. The other areas marked as A between the sonotrode tips was not bonded. This was probably because of different forces acted on the Cu/Al interface. Through the pressure analysis of the specimen by using ABAQUS finite element software, it can be found that the static pressure in region B was much bigger than that of in region A, as shown in Fig. 5. The frictional force was proportional to static pressure, so both the frictional force and the corresponding frictional heat in region B would be bigger than that of in region A. In addition, except for static pressure, areas between two sonotrode tips parallel to the vibration direction would bear extrusion force from the tips due to the vibration. Metals here yielded plastic deformation, which also produced compression heat. The oxide film in region B was broken under both action of frictional heat and compression heat, and the metals were connected effectively. However, the region A was perpendicular to the vibration direction, and the static pressure always kept at a low level, so the oxide film cannot be broken. The existence of oxide film weakened the inter-diffusion between Cu and Al base metals and the effective connection cannot be formed.
In addition, the micro-area X-ray diffraction analysis was performed in region C and D, and the results were shown in Figs. 4(e) and 4(f), respectively. It can be found that the phases in the as-welded joint were Al and Cu solid solutions, and the Al–Cu IMC was not detected, which indicated that no obvious reaction between Al and Cu took place at the interface. Some scholars15,16) also pointed out no Al–Cu IMC was formed at the Cu/Al interface when the welding energy was 1500 J.
3.1.2. Microstructure of Joints After PWHT at Different Temperature
When the PWHT was carried out at 200°C, no reaction layer was found at the Cu/Al interface, as shown in Fig. 6(a). Figure 6(e) was the result of the EDS line scan along the solid line marked in Fig. 6(a). The composition distribution of Al and Cu had a sharp change across the Cu/Al interface, which also indicated that there was no obvious reaction layer at Cu/Al interface. However, the weak diffraction peak of Al2Cu was detected in X-ray diffraction pattern of the Cu/Al interface (the test position as shown in region D of Fig. 4(a)), as shown in Fig. 6(g), which means that, although continuous reaction layer of IMC was not observed at the interface, Al2Cu IMC with a dispersive or discontinuous distribution was formed. Pretorius. R17) indicated that Al2Cu was the first IMC formed at the Cu/Al interface. They combined the change of systematic free energy with the elements concentration in the interface reaction, and putted forward the theory of effective heat of formation (EHF). According to the theory of EHF, Al2Cu has the highest absolute value, so the Al2Cu phase was assumed to be the first IMC to be generated at the interface. The formation of Al2Cu IMC could be attributed to the intensified atomic diffusion at 200°C. Moreover, the formation of the Al2Cu IMC at the Cu/Al interface could increase the metallurgy bonding of the joint.
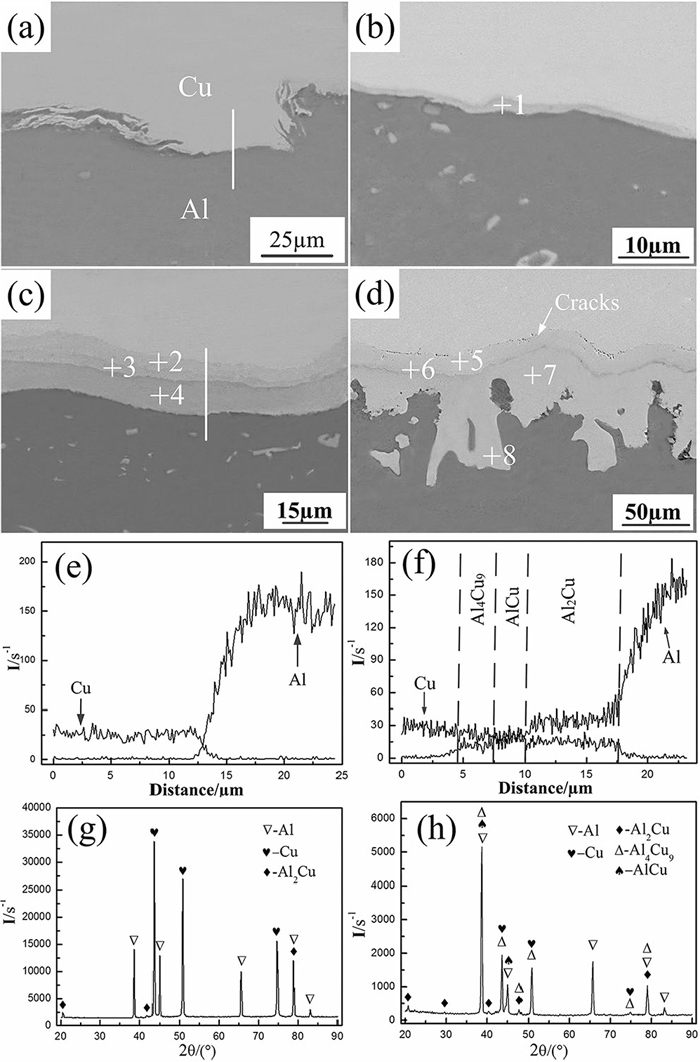
Figure 6(b) shows the morphology of the joint after PWHT at 300°C. It can be seen that an obvious IMC layer appears at the Cu/Al interface. And the chemical composition at point 1 on the reaction layer was (in at%) 72.95Al–27.05Cu (see Table 2 for a summary of points scanned as indicated in Figs. 6(b)–6(d)). According to the ratio of Al to Cu and the binary phase diagram of Al and Cu, the microstructure of this layer could be defined as Al2Cu. Thus, it can be concluded that Al2Cu IMC layer was formed at the Cu/Al interface.
Table 2. Chemical compositions of regions scanned as indicated in
Fig. 6 (at%).
Elements
Regions | Al | Cu |
|---|
| point 1 | 72.95 | 27.05 |
| point 2 | 40.62 | 59.38 |
| point 3 | 47.35 | 52.65 |
| point 4 | 70.51 | 29.49 |
| point 5 | 37.22 | 62.78 |
| point 6 | 51.56 | 48.44 |
| point 7 | 68.14 | 31.86 |
| point 8 | 67.94 | 32.06 |
When the temperature of PWHT reached 400°C, the IMC layer at the Cu/Al interface changed from single IMC layer into three IMC layers, as shown in Fig. 6(c). An EDS line scan was conducted along the white solid line marked in Fig. 6(c). According to the EDS line scan result (Fig. 6(f)), it can be seen that the contents of Al and Cu were various in different layers. Further EDS point analysis scan and micro-area X-ray diffraction analysis were preformed, and the test position as shown in region D of Fig. 4(a), the results were shown in Table 2 and Fig. 6(h), respectively. The chemical composition at point 2 near Cu base metal was (in at%) 40.62Al–59.38Cu, which suggested the formation of Al4Cu9. Simultaneously, the chemical composition at point 4 near Al base metal was (in at%) 70.51Al-29.49Cu, which could be regarded as the proof of the formation of Al2Cu. The chemical composition of point 3, between Al4Cu9 layer and Al2Cu layer, was (in at%) 47.35Al-52.65Cu, clearly suggesting the formation of AlCu. In addition, Al and Cu solid solution, Al2Cu, Al4Cu9 and AlCu compounds were detected in the joint by X-ray diffraction, which can further prove the formation of Al2Cu, Al4Cu9, and AlCu IMC layers in the joint. Guo Yajie18) also indicated that the Al4Cu9 phase has the largest driving force of free energy, so it is most likely to appear as a second phase next to Al2Cu phase. Therefore, the IMCs were formed in the order of Al2Cu, Al4Cu9 and AlCu.
When the temperature reached 500°C, three IMC layers can also be found at the Cu/Al interface, as shown in Fig. 6(d). EDS point analysis scan was performed, and results were shown in Table 2. According to the analysis result of point 5, 6, and 7, formation of Al4Cu9, AlCu, and Al2Cu IMCs could be deduced, respectively. The microstructure at the Cu/Al interface was same as that of at 400°C, except that the width of the IMC layers at 500°C increased obviously. Besides, some cracks were observed between Cu and the Al4Cu9 IMC layer, and grain boundary penetration on Al base metal near the Cu/Al interface can be observed, as shown in Fig. 6(d). The presence of the cracks in the joint can be attributed to two main reasons. First, there is big difference in the linear expansion coefficient between Al4Cu9 and Cu, and greater internal stress was remained during the cooling process. Second, Al4Cu9 is a brittle phase, which appears easily crack when subjected to internal stress. For the behaviors of grain boundary penetration, it is mainly because the diffusion rate of Cu in Al is much faster than the diffusion rate of Al in Cu,19,20) and the Cu atom will preferentially spread along the grain boundary, since the required activation energy is lower than body diffusion. Thus, a large number of Cu atoms migrated to the grain boundary on Al base metal during PWHT. In addition, the free energy at the Cu/Al interface increased when large amounts of Cu atoms diffused into Al plate due to the higher chemical potential of the Cu and Al atoms. And the diffusion reaction between Cu atoms and Al atoms can reduce the free energy of the system. Moreover, the higher temperature makes the diffusion speed increase. Therefore, a large amount of Al–Cu IMC formed in the region of grain boundary permeation. In order to confirm the phase in the region of grain boundary penetration, the EDS point scan was performed at point 8. The chemical composition at this point was (in at%) 67.94Al–32.06Cu. Base on the ratio of Al to Cu atomic composition, the IMC formed could be defined as Al2Cu.
It was also found that the bonded areas of joints after different temperature of PWHT were different, as shown in Fig. 7. With the temperature of PWHT increased from 200°C to 400°C, the bonded area almost remained the same. However, when the temperature of PWHT reached 500°C, Due to the diffusion reaction, the bonded areas not only located in the zone below the sonotrode tip, but distributed in other overlapped area. What’s more, the microstructure formed at different temperature of PWHT were also different. In the as-welded joint and the joint after PWHT at 200°C, no continuous Al–Cu IMC layer was observed at the Cu/Al interface. However, when the temperature of PWHT reached 300°C or even more, obvious continuous Al–Cu IMC layers were observed at the Cu/Al interface. And with the increasing of the temperature of PWHT, the thickness of the Al–Cu IMC layers also increased. These differences of the microstructure would certainly affect the mechanical properties of joints.
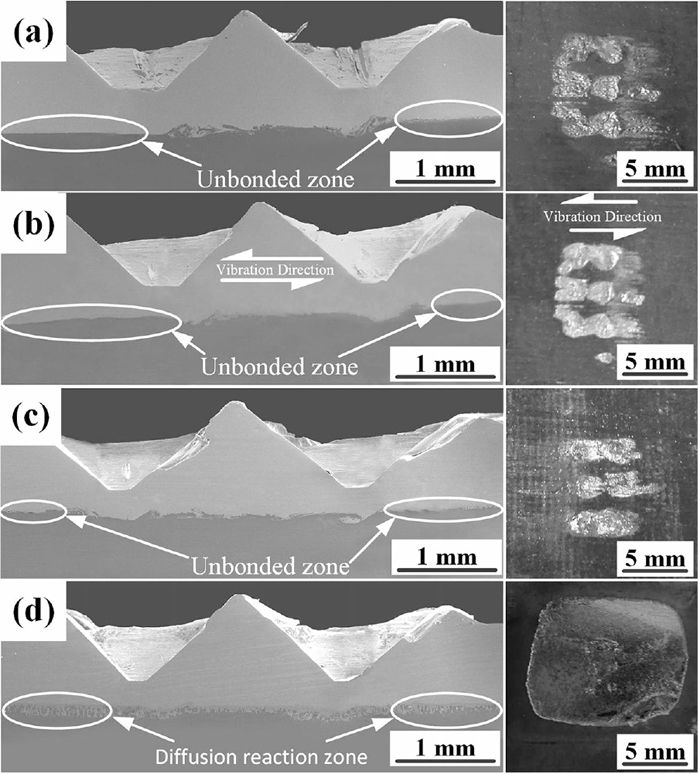
Figure 8 illustrates the micro-hardness profile of the as-welded joint and joints with PWHT at different temperature, and the micro-hardness were measured along the black line marked in the joint cross section in Fig. 8. It can be seen that the micro-hardness at the Cu/Al interface was significantly higher than that of the Cu and Al base metals. That was due to the formation of Al–Cu IMC at the Cu/Al interface. In addition, as the temperature of PWHT increased, the micro-hardness of the Cu and Al base metals significantly reduced. However, the micro-hardness at the Cu/Al interface significantly increased. It can be reasoned that as the temperature of PWHT increased, grain growth occurred, causing a decrease in micro-hardness in Cu and Al base metals. The higher temperature of PWHT, the greater the grain size and the smaller the micro-hardness would be. Besides, the diffusion rate of Cu and Al atoms at the Cu/Al interface increased significantly with the increased temperature of PWHT. Thus, when the temperature of PWHT reached 300°C, Al2Cu IMC formed at the Cu/Al interface. When the temperature of PWHT exceeded 300°C, more IMCs formed, such as AlCu and Al4Cu9. Moreover, the width of the IMC layers also increased significantly when the temperature increased. Therefore, the micro-hardness increased obviously at the Cu/Al interface with the increased of temperature of PWHT due to the formation of IMCs with greater hardness.
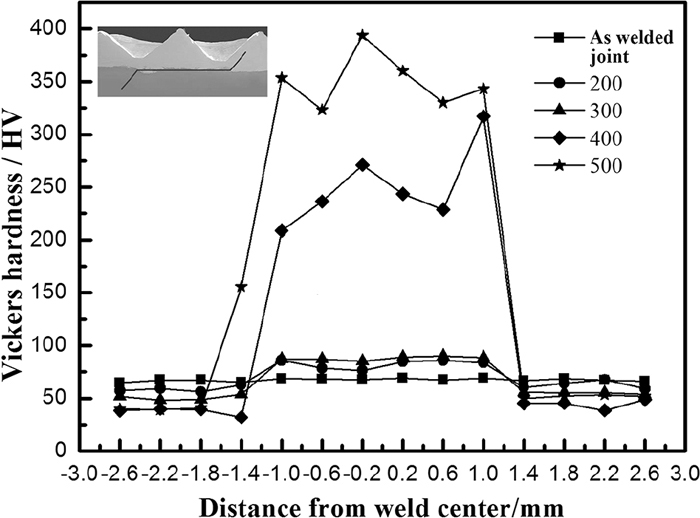
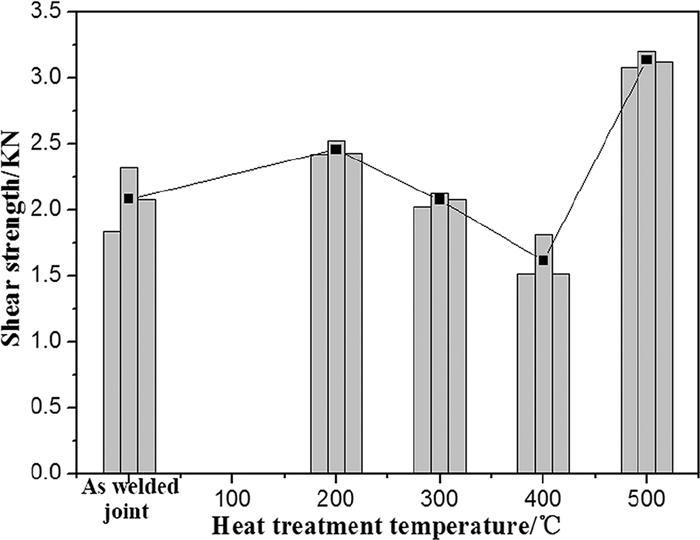
Figure 9 shows the changing trend of shear strength for as-welded joint and joints with different PWHT temperature. For all the joints, relatively higher shear strength of 2.458 KN was obtained when the temperature of PWHT was 200°C, which increased by 18% compared with that of the joint without PWHT. It is mainly because of the formation of Al2Cu that further increased the metallurgical bonding of the joint in a certain extent. When the temperature of PWHT reached 300°C and 400°C, the shear strength of the joints reduced severely. This can be attributed to the formation of IMC layers with a certain thickness. With the increasing of temperature, the diffusion rate of Cu and Al atoms at the Cu/Al interface increased significantly, which promoted the formation of continuous brittle IMC layers, such as Al2Cu, AlCu and Al4Cu9. And as the temperature of PWHT increased, the thickness of the continuous brittle IMC layers also increased, which further deteriorated the mechanical property of the joint. However, the maximum shear strength of 3.138 KN was acquired when the joint after PWHT at 500°C. This is mainly because of the diffusion reaction at the unbounded Cu/Al interface. Thus, the zone, which unbounded in joints after PWHT at 200°C and 300°C, combined well, as shown in Fig. 7. That is, the bonding zone was not only localized in the zone below the sonotrode tip, but also distributed in other overlapped area. Therefore, although large numbers of cracks appeared in the joint, the shear strength of joints increased.
The fracture morphology of the as-welded joint and the joint after PWHT at 200°C were similar with Figs. 10(a) and 10(b), and the fracture morphology of joints after PWHT above 200°C were similar with Figs. 10(c) and 10(d). It can be seen that all the fracture surfaces were relatively flatter, and some cleavage planes and tearing edges can be observed at the fracture surface. Small quantity of dimples can also be observed in the fracture surface of the as-welded joint and the joint after PWHT at 200° C. But when the temperature of PWHT exceed 200°C, the dimples disappeared. Therefore, it can be concluded that the fracture form of joints were the mixed-mode of ductile and brittle fractures, and with the increase of the temperature of PWHT, the trend of brittle fracture increases. This may be the effect of Al–Cu IMC.

In addition, in order to confirm the position of the joint fracture, EDS point analysis scan and X-ray diffraction analysis were performed in the fracture surface of the as-welded joint and the joint after PWHT at 500°C, the results were shown in Table 3 and Fig. 11. Only Al was detected at point 10 and 12, and both Al and Cu were detected at point 9 and point 11. Besides, it can be seen from X-ray diffraction analysis (Fig. 11) that Al and Cu solid solutions were detected both in the fracture of Al and Cu sides of the as-welded joint. In the joint after PWHT at 500°C, whether in the fracture of Al side or Cu side, Al solid solution, Cu solid solution and many Al–Cu IMCs, such as Al2Cu, Al4Cu9 and AlCu, were detected. In addition, it can be seen from Fig. 7 that Al was torn and attached to the Cu side. Therefore, it can be indicated that the fracture of joints was mainly concentrated in the Al base metal near the Cu/Al interface, and also part of the fracture was broken at Al–Cu diffusion layer.
Table 3. Chemical compositions of regions scanned as indicated in
Fig. 10 (at%).
Elements
Regions | Al | Cu |
|---|
| point 9 | 59.42 | 40.58 |
| point 10 | 100 | 0 |
| point 11 | 40.59 | 59.41 |
| point 12 | 100 | 0 |
4. Conclusions
(1) In the as-welded joint, many swirls were observed at the Cu/Al interface, which has the potential to increase the lap shear strength due to the localized interlocking of the two metals. Besides, many weld islands also observed near the Cu/Al interface, and no Al–Cu IMC was detected at the Cu/Al interface.
(2) When 200°C was selected for PWHT, Al2Cu IMC with a dispersive or discontinuous distribution was formed. With the temperature of PWHT increasing to 300°C, the continuous Al2Cu IMC layer can be found at the Cu/Al interface. As the temperature reached 400°C and 500°C, there were three IMC layers appeared at the Cu/Al interface, which were Al2Cu, Al4Cu9 and AlCu.
(3) The micro-hardness at the Cu/Al interface was significantly higher than that of the Cu or Al base metals. With the increasing of the temperature of PWHT, the micro-hardness decreased in Cu and Al base metals, but increased significantly at the Cu/Al interface.
(4) Compared with the as-welded joint, relatively higher shear strength of 2.458 KN was obtained due to the formation of dispersed Al2Cu when the temperature of PWHT was 200°C. The maximum shear strength of 3.138 KN was acquired resulted from the increase of the bonded area when the temperature of PWHT was 500°C.
References
- 1) M. Zhang, P. F. Wang, L. C. Zhang and Y. B. Lin: Trans. China Weld. Inst., 34 (2014), 55.
- 2) X. J. Wang, Y. Liu and Z. Y. Yu: Hot Work. Technol., 45 (2016), 74.
- 3) Z. L. Liu, K. Z. Yang and D. F. Yi: Hot Work. Technol., 38 (2009), 123.
- 4) A. Boucherit, M. N. Avettand-Fènoël and R. Taillard: Mater. Des., 124 (2017), 87.
- 5) B. Huang: Chin. J. Nonferr. Met., 14 (2004), 122.
- 6) W. Zhang, Y. Shen, Y. Yan and R. Guo: Mater. Sci. Eng. A, 690 (2017), 355.
- 7) U. Hartel, A. Ilin, C. Bantel, J. Gibmeier and V. Michailov: Phys. Procedia, 83 (2016), 1404.
- 8) A. Loureiro, R. Mendes, J. B. Ribeiro and R. M. Leal: Cienc. Tecnol. Mater., 29 (2017), 46.
- 9) I. Mys and M. Schmidt: Chapter 8, Advances in Laser Materials Processing, 2nd ed., ed. by J. Lawrence, Woodhead Publishing, Sawston, Cambridge, (2018), 185.
- 10) C. V. Rao, G. M. Reddy and K. S. Rao: Def. Technol., 11 (2015), 197.
- 11) F. Haddadi and D. Tsivoulas: Mater. Charact., 118 (2016), 340.
- 12) Y. Cui, C. L. Xu and Q. Han: Scr. Mater., 55 (2006), 975.
- 13) M. Ding, P. L. Zhang, Z. Y. Zhang and S. Yao: Ultrason. Sonochem., 17 (2010), 292.
- 14) H. Imai and S. I. Matsuoka: JSME Int. J., 48 (2005), 311.
- 15) R. Balasundaram, V. K. Patel, S. D. Bhole and D. L. Chen: Mater. Sci. Eng. A, 607 (2014), 277.
- 16) D. Li, Y. Y. Zhao and Y. S. Zhang: Trans. China Weld. Inst., 35 (2014), 47.
- 17) R. Pretorius, A. M. Vredenberg, F. W. Saris and R. De Reus: J. Appl. Phys., 70 (1991), 3636.
- 18) Y. J. Guo, G. W. Liu, H. Y. Jin, Z. Q. Shi and G. J. Qiao: Rare Met. Mater. Eng., 40 (2011), 215.
- 19) M. F. Wu: Trans. China Weld. Inst., 30 (2009), No. 11, 84.
- 20) J. Vikas, V. C. Srivastava, D. Arpan and P. N. Ghosh: Mater. Lett., 60 (2006), 1758.