Abstract
To investigate the effect of iron texture on the crystal orientation relationship between iron and zinc, Zn deposition was performed galvanostatically at 1500 A/m2 at a charge density of 1.48 × 10⁴ C/m2 onto high-purity electrolytic iron and cold rolled steel sheets in an agitated sulfate solution at 40°C. Fe with a large grain size showed an orientation relationship of {110}Fe//{0001}Zn. However, when the angle of inclination between the {110}Fe plane and the surface of electrolytic Fe was increased, the deviation in the orientation relationship {110}Fe//{0001}Zn increased. This result suggests that the orientation relationship of {110}Fe//{0001}Zn is difficult to maintain during the deposition when the inclination angle of the {110}Fe plane from the surface of electrolytic Fe increases. As a result, the epitaxial growth of Zn changes to random growth. Zn deposited on cold rolled steel sheets with a small grain size showed an orientation of {0001}, regardless of the orientation of Fe. This indicates that the orientation of the deposited Zn is more affected by the overpotential for deposition than by the orientation of steel sheets at the initial stage of deposition. Although strain was introduced into the high-purity electrolytic Fe with sandblasting, the orientation relationship of {110}Fe//{0001}Zn did not change remarkably, showing that the strain of Fe substrate has little effect on the orientation relationship between Fe and deposited Zn.
1. Introduction
Electrogalvanized steel sheets coated with thin organic films containing silica have been utilized for electrical home appliances because they have excellent resistance to fingerprints and corrosion. It is important to control the crystal orientation of zinc as it affects the lightness,1,2) glossiness,1) surface roughness,3,4) and press formability4,5) of the electrogalvanized steel sheets. Therefore, there have been numerous studies regarding how the orientation is affected by electrolysis conditions,3,6,7,8,9) types of electrolytes,10,11) addition of inorganic12,13,14) and organic15,16,17,18) compounds to the solutions, and preadsorption19,20,21,22) of organic additives onto the iron substrate.
During Zn deposition on an α–Fe substrate, the initial Zn deposits grow epitaxially, according to Burgers’ orientation relationship, which is described as {110}Fe//{0001}Zn and [111]Fe//[1120]Zn.10,23) In addition, the deposits are reported to epitaxially grow according to the relationship of {111}Fe//{0001}Zn,24) which indicates that the relationship is affected by the surface texture of the Fe substrate. In practice, during Zn deposition on to steel sheets, the deposited Zn comprises epitaxial as well as random growth, and the crystal orientation of deposited Zn seems to be affected by the orientation relationship between Zn and Fe. Therefore, in this study, Zn was deposited on to Fe substrates with various crystal orientations, morphologies, grain sizes, and grain strains, and the orientation relationship between Zn and Fe was investigated through electron backscatter diffraction (EBSD).
2. Experimental
The electrolyte composition and electrolysis conditions for Zn deposition are listed in Table 1. The electrolytic solution was prepared by dissolving reagent-grade ZnSO4·7H2O (1.2 mol/L) and Na2SO4 (0.56 mol/L) in distilled and deionized water. The pH was adjusted to 2.0 using sulfuric acid (H2SO4). High-purity electrolytic Fe (Atomiron MP with an Fe purity of 99.99% produced by Toho Zinc Co.) and polycrystalline steel sheets that each conform to the Japanese Industrial Standard (JISG 3141) were employed as cathode substrates. The Fe consisted of large, fibrous crystals, with a field-oriented texture25) in that the preferred orientation of specific planes occur towards the electric field during deposition. Zn was deposited on the side plane with fibrous crystals with a width of 100–200 μm and on the top plane with elliptic crystals with a grain size of 100–200 μm (Fig. 1). Sandblasting was performed at a spray pressure of 0.3 MPa from a distance of 20 mm through glass beads with a grain size of 80 μm, for 1 min, on both planes to induce strain.
Table 1. Electrolysis conditions.
| Bath composition | ZnSO4·7H2O (mol/L)
Na2SO4 (mol/L)
pH | 1.2
0.56
2 |
| Operating conditions | Current density (A/m2)
Amount of charge (C/m2)
Temperature (°C)
Cathode Fe (5×10 mm2, 9 mmφ)
Anode
Stirrer (rpm) | 1500
1.48×10⁴
40
Pt (8×12 cm2)
400 |

Each substrate was polished with emery papers (Nos. 600, 1500, and 2000) and chemical polishing in order to achieve mirror smoothness prior to electrodeposition. Chemical polishing was performed at 40°C for 10 s in a solution containing 2.0 mol/L of H2O2 and 1.0 mol/L of HF. Then, each substrate was washed in a 20% by mass solution of H2SO4, and electrolytic degreasing was performed in an alkaline solution for 10 s. Zn electrodeposition was performed in solutions agitated at 400 rpm using a stirrer under coulostatic (1.48 × 10³ C/m2) and galvanostatic (1500 A/m2) conditions at 40°C, with the aim of achieving a Zn coating mass of 5 g/m2. The Fe (measuring 5 × 10 cm2) and polycrystalline steel sheets (9 mm in diameter) were used as cathodes, and a platinum mesh (measuring 8 × 12 cm2) was used as the anode.
The surface morphologies of the Fe substrate and deposited Zn were imaged by scanning electron microscopy (SEM). The crystal orientations of the deposited Zn and of the Fe substrate after removing the Zn, were analyzed at the same location through EBSD by locating a previously-made indentation on the Fe substrate. The Zn was removed through argon (Ar) ion milling etching. The Fe substrate was polished to a mirror finish with emery paper and chemical polishing after sandblasting. To evaluate the strain distribution in the Fe crystal, the kernel average misorientation (KAM)26) value, which quantifies local misorientation, was measured through EBSD.
3. Results
3.1. Orientation Relationship between High-purity Electrolytic Fe and Zn Deposited on Fe
3.1.1. Zn Deposition onto the Side Plane of Fe
Figure 2 shows the backscattered electron image of the side plane of high-purity electrolytic Fe prior to Zn deposition. A vertically-striped crystal texture was identified, which indicates the presence of fibrous crystals with a field-oriented texture.

Figure 3 shows the secondary electron image (a) and the EBSD image (b) of the Zn deposited on the side plane of the Fe. During Zn deposition, the platelet crystals of Zn were layered parallel or somewhat inclined to the Fe. The plane of the platelet crystals of Zn is the basal plane [{0001} plane] of hexagonal close-packed (hcp) structure. The growth direction of the deposited Zn, as shown on the right portion of Figs. 3(a) and 3(b), are almost parallel to the electrolytic Fe; however, on the left, the platelet crystals are randomly inclined. This difference in morphology of the deposited Zn is a result of the epitaxial growth of Zn being affected by the orientation of the crystal grains of the electrolytic Fe. The crystal grain boundary of the electrolytic Fe appears to be vertically-aligned in the center of Figs. 3(a) and 3(b).
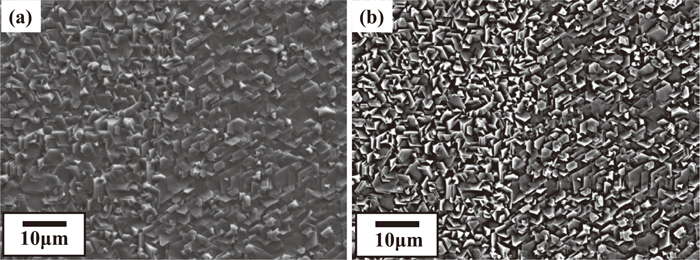
Figure 4 shows the crystal orientation mapping images of Zn deposited on the side plane of the Fe and those of the electrolytic Fe after removing the deposited Zn. The deposited Zn (b) and the electrolytic Fe (a) were analyzed at the same location. The side plane of the Fe was composed of fibrous crystals with a field-oriented texture as shown in Fig. 2, and the crystal orientation of the Fe was varied for every crystal grain; see A–E in Fig. 4(a). On the other hand, the crystal orientation of the deposited Zn (b) was different at every crystal grain of the Fe in areas A to E; i.e., it changed depending on the crystal grain of the Fe. This is attributed to the epitaxial growth of Zn. The crystal orientation of Zn cannot be partially analyzed as a result of the roughness of its surface.
The pole figures of the electrolytic Fe and deposited Zn at spots A–E were formed as dictated in the following section.
Figure 5 shows the {110} and {0001} pole figures for the side plane of Fe and for Zn, respectively. At spot B, {110} of the electrolytic Fe and {0001} of the deposited Zn were parallel to the surface of the electrolytic Fe, which corresponds to the crystal orientation mapping image shown in Fig. 4. At spots A, C, D, and E, the angle of inclination of {110}Fe from the surface of the electrolytic Fe almost corresponded to that of {0001}Zn, which shows the orientation relationship of {110}Fe//{0001}Zn at all spots A–E.
3.1.2. Zn Deposition onto the Top Plane of Fe
In Fig. 6, the crystal orientation mapping images of Zn deposited on the top plane of the electrolytic Fe and those of the electrolytic Fe after removing the deposited Zn are shown. The deposited Zn (b) and its electrolytic Fe (a) were analyzed at the same location on the substrate. All the crystal grains at spots A, B, and C on the top plane the electrolytic Fe showed the {111} plane. The orientations of the Zn (b) deposited at spots A, B, and C were nearly identical. The light–dark of the crystal orientation mapping images (b) of the deposited Zn were different at every grain of the electrolytic Fe at spots A, B, and C, which indicates the epitaxial growth of Zn deposited on the electrolytic Fe.

The pole figures of the electrolytic Fe and the deposited Zn at A, B, and C were formed as follows. The {110} and {0001} pole figures for the top plane of the electrolytic Fe and for Zn deposited on the electrolytic Fe are shown in Fig. 7. At spots A, B, and C, the angle of inclination of {110}Fe from the surface the electrolytic Fe nearly corresponded to that of {0001}Zn, which provides an orientation relationship of {110}Fe//{0001}Zn. However, compared with the Zn deposited onto the side plane of the electrolytic Fe, the angle of inclination of {110}Fe from the surface the electrolytic Fe differed slightly from that of {0001}Zn from the electrolytic Fe. Therefore, the relationship between the angle of inclination of {110}Fe from the surface of electrolytic Fe and that of {0001}Zn from electrolytic Fe was investigated.

Figure 8 shows the relationship between the angles of inclination of {110}Fe and {0001}Zn from the surface of the side and top planes of the high-purity electrolytic Fe. The dotted line shows that the angles of inclination are identical. The angle of inclination of {110}Fe from the surface of electrolytic Fe nearly corresponded to that of {0001}Zn, which indicates an orientation relationship of {110}Fe//{0001}Zn. However, when the angle of inclination from the surface of the electrolytic Fe was increased for {110}Fe, the data deviated from the dotted line. Therefore, the effect of the angle of inclination was investigated.
The relationship between the deviation of the orientation relationship of {110}Fe//{0001}Zn and the angle of inclination of {110}Fe from the surface of the electrolytic Fe is shown in Fig. 9. The deviation increased with the angle of inclination.
3.2. Orientation Relationship between Polycrystalline Cold Rolled Steel Sheets and Zn Deposition
Figure 10 shows the SEM images of Zn deposited on cold rolled steel sheets. The layered Zn platelet crystals (point A in Fig. 10) and the smooth area (point B in Fig. 10), where Zn platelet crystals grew parallel to the steel sheets, are seen. At all areas, the basal plane of the Zn hcp structure was nearly parallel to the steel sheets, indicating the preferred Zn orientation of the {0001}.

Figure 11 shows the crystal orientation mapping images of the Zn deposited on cold rolled steel sheets and the images of the steel sheets after removing the deposited Zn. The steel sheets (a) and the Zn (b) were analyzed at the same location. The preferred Zn orientation was the {0001} plane, regardless of the orientation of the underlying sheets. The orientation of the steel sheets at spot A in Fig. 11 is different from that at spot B, but the orientation of Zn deposited at both spots is almost identical. The grain size of the sheets was approximately 5–10 μm and was significantly smaller than that of the electrolytic Fe, as shown in Figs. 4 and 6.

In Fig. 12, the {110} and {0001} pole figures for the cold rolled steel sheets and for the deposited Zn, respectively, are shown. The {0001} plane of Zn was almost parallel to the steel sheets, whereas the {110} plane of Fe was significantly inclined from the steel sheets, which shows that the orientation relationship of {110}Fe//{0001}Zn observed on the high-purity electrolytic Fe was not attained on the cold rolled steel sheets. Regardless of the orientation of the steel sheets, the preferred orientation of the deposited Zn was the {0001} plane.
3.3. Orientation Relationship between the Electrolytic Fe after Sandblasting and Zn Deposition on the Sandblasted Fe
Sandblasting was performed on the top and side planes of the electrolytic Fe, and the KAM26) value, which quantifies the local misorientation in the crystal grain, was measured through EBSD. Figure 13 shows the KAM map of the top plane of the electrolytic Fe, with and without sandblasting, which confirmed that strain was introduced into the the electrolytic Fe through the sandblasting.
In Fig. 14, the distribution diagram of the KAM values of the electrolytic Fe with and without sandblasting is shown. The KAM values increased after sandblasting. The average KAM value for the top plane of the electrolytic Fe without sandblasting was 0.53, whereas the average KAM values of the top and side planes after sandblasting were 1.91 and 1.29, respectively.

The crystal orientation mapping images of Zn deposited on the electrolytic Fe after sandblasting, and the Fe after removing the Zn, are shown in Fig. 15. The Zn (b and d) and the electrolytic Fe (a and c) were analyzed at the same locations. The side plane (a) was composed of fibrous crystals with a field-oriented texture, and the crystal orientation was different at each grain at spots A, B, and C, as demonstrated in Fig. 15(a). The crystal orientation of the Zn (b) varied at each crystal grain of the electrolytic Fe at spots A, B, and C as well. All the crystal at spots A, B, and C(c) on the top plane show an orientation close to a {111} plane. The Zn deposited at spots A, B, and C(d) were nearly identical. The results mentioned above were nearly the same as the results of the Fe without sandblasting, as shown in Figs. 4 and 6.

Figure 16 shows the {110} and {0001} pole figures for the electrolytic Fe after sandblasting, and for the deposited Zn, respectively. At spots A, B and C on the top and side planes, the inclination of the {110}Fe plane from the substrate nearly corresponded to that of the {0001}Zn plane from the substrate, indicating an orientation relationship of {110}Fe//{0001}Zn.
The relationship between the angles of inclination of {110}Fe and {0001}Zn from the surface of the electrolytic Fe after sandblasting is shown in Fig. 17. The angles of inclination were nearly identical, indicating an orientation relationship of {110}Fe//{0001}Zn. However, the data deviated from the dotted line (Fig. 17) when the angle of inclination between the {110}Fe and the surface of the electrolytic Fe was increased, indicating the same trend that was observed in the case without sandblasting.
4. Discussion
The orientation relationship between the deposited Zn and Fe substrate was different depending on the type of substrate. Table 2 shows the surface texture of the substrate and the orientation relationship between the deposited Zn and the Fe substrate. The orientation relationship of {110}Fe//{0001}Zn was completed for Zn deposited on the electrolytic Fe, whereas the Zn deposited on the cold rolled steel sheets showed a preferred orientation of the {0001} plane regardless of the orientation of the steel sheets, indicating no specific orientation relationship between Fe and Zn.
Table 2. Effect of the surface texture of Fe substrate on the crystal orientation relationship between deposited Zn and Fe.
| Substrate | Electrolytic Fe | Cold rolled steel sheets |
|---|
| Upper surface | Cross section |
|---|
| Sandblasting to Fe | With | Without | With | Without | Without |
|---|
| Grain size of Fe (μm) | 100–200ϕ | Width 100–200 | 5–10ϕ |
| Purity of Fe (mass%) | 99.999 | 99.98 |
| Preferred orientation of Fe | {111} | − |
| Current density of Zn (A/m2) | 1500 |
| Preferred orientation of Zn | − | {0001} |
| Relationship of Fe/Zn | {110}F e//{0001}Zn | All Fe//{0001}Zn |
During Zn deposition on an α–Fe substrate, the initial Zn deposits grow epitaxially, described as {110}Fe//{0001}Zn, and [111]Fe//[1120]Zn.10,23) It is known that the crystal orientation of Zn deposited on steel sheets depends on the overpotential for Zn deposition, and the preferred orientations of Zn shift from {0001} to {1011}, {1120}, and {1010} as the overpotential for deposition increases.27,28) In Zn deposition from a sulfate solution, the preferred orientations of the Zn deposited at the current densities of 1000–4000, 6000, and 8000–12000 A/m2 were reported to be {0001}, {1011}, and {1120}, respectively, which corresponds to the overpotential theory developed by Pangarov.27,28) In this study, because Zn deposition was performed at 1500 A/m2, the preferred orientation of the deposited Zn is the {0001} plane, according to the overpotential theory. Because the cathode potential during deposition was approximately −0.792 V, the overpotential for Zn deposition was calculated from the equilibrium potential for a Zn deposition of −0.76 V, to be small (0.032 V).
Because of the initial epitaxial growth of Zn, and the varying direction of growth, the deposition competes with the grain boundaries of Fe, leading to a shift from epitaxial to random growth.6,29,30) Maintenance of the epitaxial growth becomes increasingly difficult with a decreasing Fe grain size as the number of boundaries increases.29,30,31) Therefore, the effect of the orientation of Fe on the orientation of Zn decreases. The results obtained in this study suggest that the crystal orientation of the Zn deposited on the cold rolled steel sheets is more affected by the overpotential for deposition than the orientation of the sheets at the initial stage of deposition. The small effect of steel on Zn orientation is attributed to the small grain size of the rolled steel.
Color gradation is observed in the crystal orientations of the steel (Fig. 11(a)), which indicates the presence of strain on the surface. Because the strain was expected to affect the orientation relationship between the Zn and the steel, sandblasting was performed on the Fe to induce strain. However, the orientation relationship between the Zn and Fe was identical to that prior to sandblasting (Fig. 17), indicating that strain in the Fe substrate has no effect on the orientation relationship. Although there is a difference in the purity between the high-purity electrolytic Fe and the cold rolled steel sheets, the effect on the orientation relationship is unknown, and further investigation is required.
When the inclination angle of the {110}Fe plane from the surface of Fe is increased, the orientation relationship of {110}Fe//{0001}Zn is difficult to determine (Figs. 8 and 9), indicating that the epitaxial growth of Zn shifts to random growth. When the inclination angle is small between the basal plane of Zn and the surface of the substrate, or when Zn grows with a preferred orientation of {0001}, the epitaxial growth of Zn continues. Literature supports the idea that Zn easily grows in an orientation of {0001} and epitaxially.7) It is confirmed through the evidence that deviation from the orientation relationship of {110}Fe//{0001}Zn decreases with a decreasing angle of inclination between {110}Fe and the surface of the substrate.
5. Conclusion
Zn deposition was performed on both high-purity electrolytic Fe and cold rolled steel sheets, and the effect of the Fe surface texture on the crystal orientation relationship between Fe and Zn was investigated. Deposition of Zn on Fe with a large grain size showed an orientation relationship of {110}Fe//{0001}Zn. However, deviation in the orientation relationship increased when the angle of inclination between the {110}Fe plane and the surface of electrolytic Fe was increased. This result suggests that this relationship is difficult to attain during deposition at large angles of inclination. In these conditions, the epitaxial growth of Zn changes to random growth. However, Zn deposited on cold rolled steel sheets with a small grain size showed a preferred orientation of {0001} regardless of Fe orientation, which indicates that the orientation of deposited Zn is more affected by the overpotential for deposition than by the orientation of the steel sheets at the initial stage of deposition. Although strain was introduced into the electrolytic Fe through sandblasting, the orientation relationship changed minimally, indicating that the strain of the Fe substrate has little effect on the orientation relationship between the Fe and the deposited Zn.
References
- 1) H. Nakano, S. Oue, M. Iwai, T. Akiyama and H. Fukushima: Tetsu-to-Hagané, 86 (2000), 584 (in Japanese).
- 2) H. Nakano, S. Oue, S. Taniguchi, S. Kobayashi and H. Fukushima: Tetsu-to-Hagané, 93 (2007), 763 (in Japanese).
- 3) M. Sagiyama, M. Kawabe and T. Watanabe: Tetsu-to-Hagané, 76 (1990), 1301 (in Japanese).
- 4) K. Ishii, M. Kimoto and A. Yakawa: 4th Int. Conf. on Zinc and Zinc Alloy Coated Steel Sheet (GALVATECH’98), ISIJ, Tokyo, (1998), 547.
- 5) G. J. Wenzloff, C. J. Van Tyne and D. K. Matlock: The Physical Metallurgy of Zinc Coated Steel, TMS, Warrendale, PA, (1993), 275.
- 6) H. Nakano, H. Fukushima, T. Akiyama and R. Kammel: Metall, 58 (2004), 722.
- 7) H. Nakano, K. Araga, M. Iwai and J. Kawafuku: Tetsu-to-Hagané, 83 (1997), 785 (in Japanese).
- 8) H. Nakano, K. Araga, M. Iwai and J. Kawafuku: Tetsu-to-Hagané, 83 (1997), 635 (in Japanese).
- 9) H. Nakano: Trans. Nonferr. Met. Soc. China, 19 (2009), 835.
- 10) H. Ohtsubo, T. Matsumoto, K. Nakai and Y. Ohmori: ISIJ Int., 34 (1994), 1002.
- 11) Y. B. Yim, W. S. Hwang and S. K. Hwang: J. Electrochem. Soc., 142 (1995), 2604.
- 12) H. Nakano, K. Araga, M. Iwai and K. Miki: Tetsu-to-Hagané, 85 (1999), 806 (in Japanese).
- 13) A. R. Ault and E. J. Frazer: J. Appl. Electrochem., 18 (1988), 583.
- 14) H. Nakano, S. Oue, S. Taniguchi, S. Kobayashi and H. Fukushima: ISIJ Int., 48 (2008), 634.
- 15) H. Nakano, K. Araga, M. Iwai and J. Kawafuku: Tetsu-to-Hagané, 84 (1998), 339 (in Japanese).
- 16) D. J. Mackinnon, J. M. Brannen and R. M. Morrison: J. Appl. Electrochem., 18 (1988), 252.
- 17) H. Nakano, S. Oue, T. Miki, S. Kobayashi and H. Fukushima: ISIJ Int., 46 (2006), 106.
- 18) H. Nakano, S. Oue, T. Miki, S. Kobayashi and H. Fukushima: Tetsu-to-Hagané, 92 (2006), 501 (in Japanese).
- 19) H. Nakano, T. Ura, S. Oue and S. Kobayashi: ISIJ Int., 54 (2014), 1653.
- 20) H. Nakano, S. Oue, Y. Hamaguchi, S. Kobayashi and H. Fukushima: ISIJ Int., 49 (2009), 1769.
- 21) H. Nakano, T. Ura, S. Oue and S. Kobayashi: Tetsu-to-Hagané, 99 (2013), 700 (in Japanese).
- 22) H. Nakano, S. Oue, Y. Hamaguchi, S. Kobayashi and H. Fukushima: Tetsu-to-Hagané, 96 (2010), 371.
- 23) Y. Ohmori, K. Nakai, H. Ohtsubo, T. Yagi and T. Matsumoto: ISIJ Int., 33 (1993), 1196.
- 24) M. Kurosaki: Dr. thesis, Kyoto University, (2009), https://repository.kulib.kyoto-u.ac.jp/dspace/bitstream/2433/77994/1/D_Kurosaki_Masao.pdf, (accessed 2009-03-23).
- 25) R. Winand: J. Appl. Electrochem., 21 (1991), 377.
- 26) S. Morooka, Y. Tomoda, Y. Adachi, S. Morito and T. Kamiyama: Tetsu-to-Hagané, 94 (2008), 313 (in Japanese).
- 27) N. A. Pangarov: J. Electroanal. Chem., 9 (1965), 70.
- 28) N. A. Pangarov: Electrochim. Acta, 9 (1964), 721.
- 29) H. Nakano and H. Fukushima: Tetsu-to-Hagané, 88 (2002), 236 (in Japanese).
- 30) H. Kawano, S. Oue, T. Futaba, A. Kobayashi, Y. Goto and H. Nakano: Tetsu-to-Hagané, 104 (2018), 227 (in Japanese).
- 31) H. Kawano, S. Oue, T. Futaba, A. Kobayashi, Y. Goto and H. Nakano: ISIJ Int., 58 (2018), 2117.


