Abstract
Bead-on- plate welding was performed on 20 mm thick cast ductile iron plate in shielded metal arc welding using three different levels (0.05, 0.1, 0.2%) of Ce and one without Ce containing developed coated electrodes after establishing weld procedure as per AWS (D11). As-welded DI weldments were given isothermal heat treatment at two different austempering temperatures (300°C and 350°C) for 1.5 h, 2 h and 2.5 h holding time. Microstructures of as-deposited and austempered weld metals were characterized by OM, SEM, TEM, XRD analysis and microhardness testing. Results show that weld metal containing 0.1% Ce attributed lowest amount of ledeburitic carbide in as-deposited condition and maximum vol.% of retained austenite (46.7%) after austempering heat treatment compare to other two levels of Ce. Since maximum amount of retained austenite is the desirable microstructure after austempering heat treatment, 0.1% Ce is considered as the optimum one in DI weld metal.
1. Introduction
Austempered ductile iron (ADI) is a new member of DI family and considerable interest has been developed now a days due to its excellent combination of microstructural and mechanical properties such as high tensile strength (850–1400 MPa), reasonable ductility (elongation 4–10%), good wear resistance and higher resistance to fatigue.1,2,3,4) ADI also possesses significantly lower production cost and better machinability than steel or other grades of cast iron. For ADI initial material is DI and is converted to ADI with the help of isothermal heat treatment which is a two stage heat treatment process.4) At the first stage austenitization is done at temperature range of 850–950°C for 30 min – 2 h holding time5) to achieve a fully austenitic matrix. After austenitization, it is rapidly transferred to a salt bath at the austempering temperature range of 250–400°C for 1–4 h holding followed by air cooling to room temperature.6) During the austempering process, the austenite (γ) transformed to bainitic ferrite (α) with high carbon enriched austenite (retained austenite) and graphite nodules (g). Austempering temperature plays a key role to transform the formation of bainitic ferrite and shape and size of graphite. At higher austempering temperature (320–400°C) the microstructure is transformed to carbide free bainitic ferrite (lath type or upper bainitic ferrite) with a higher amount of retained austenite (Xγ) content. But when temperature crosses the limit, the untransformed austenite transformed to carbide (ε carbide) leading to decrease the Xγ content. At lower austempering temperature (250–320°C) the microstructure shows needle shape bainitic ferrite (lower bainitic ferrite) with small amount of Xγ.7) It is to be noted here that apart from matrix structure of ADI the graphite nodule count, nodularity and size distribution play a very important role in determining the final microstructural and mechanical properties.
The excellent castability and good mechanical properties along with lower cost of ADI has attracted its use as castings in automotive, rail, structural and heavy engineering applications.8,9,10) However, due to the desired and completed shape of the castings sometimes it is required to be fabricated and joining between the castings parts. Also many a times DI casting is required to be repaired, which demands welding consumables compatible with DI. Although different coated electrodes such as pure nickel (90–97%),11) stainless steel and iron nickel12) are available commercially for welding DI, but these electrodes show negligible respond to austempering heat treatment as the alloying elements present in the electrode belong to poor austemperability. As a result weld metals produced by these electrodes can’t be converted into ADI structure. Thus, there is an urgent need to develop coated electrode consisting of elements having good austemperability as well as compatible with DI. Also to get maximum benefit from the electrode so far as the weld metal properties are concerned, it will not only provide a good response to isothermal heat treatment, but should result more refined weld microstructure. Undoubtedly, refined microstructure attributing improved weld metal properties is the major issue towards full exploitation of engineering potential of ADI.
To refine the microstructure of DI attempts13,14) were made to add small amount of rare earth elements (RE) during melting. However, experimental results on microstructural refinement with respect to optimum RE content differ significantly. For example, X. Diao et al.15) reported that increasing Ce content from 0.005 to 0.014% in DI casting the graphite nodularity was increased and size of the graphite becomes finer. Further increasing Ce content up to 0.018 or 0.020% the size of the graphite becomes coarser with decreasing the graphite nodularity. Whereas, M. I. Onsøien et al.16) reported higher graphite nodularity and low carbides zone in DI when Ce level increases from 0.015% to 0.035%. Even some investigators concluded that 0·32% Ce is the optimum cerium level to attribute graphite nodularity.17) Nodularity in DI has been shown to increase with decreasing solidification time and section thickness of the materials.18) In hypereutectic high chromium cast iron, the carbides were refined gradually and the morphology of primary M7C3 type carbides became more isotropic as cerium addition increases, but rather slowly when cerium addition exceeded 1.0%.19) However, there is no published literature available on the effect of Ce on microstructure of ADI except it was reported that Ce decreased the graphite nodularity, delayed the completion of stage I reaction and accelerated the start of the stage II reaction without discussing on microstructural aspects.20)
The variation in optimum Ce content reported by previous investigators appears to be associated with different composition of DI used which could modify liquidus temperature. Since the addition of RE changes nucleation and growth rate by changing the liquidus temperature, these effects are likely to vary with optimum RE content.14,17)
Refinement of microstructure and improved properties of the welds by addition of RE elements has been reported. But there is no published report available on the addition of RE elements on DI or ADI welds. While systematically varying cerium oxide content in the flux formulation of basic coated austenitic stainless steel electrode, G. Srinivasan et al.21) expressed that an optimum amount of 0.4% Ce improved mechanical properties of the weld deposits mainly through decrease in oxygen & sulphur content, inclusion size and no.s of inclusion. In another investigation, S. K. Samanta et al.22) introduced cerium (Ce) in the form of misch metal (50% Ce) and Nb in the form of FeNb (50% Nb) into the weld pool as powder form (200 mesh size) through the tubes of 316L stainless steel foil as the filler wire. Refinement of weld microstructure, improvement of oxidation resistance as well as oxide scale adherence of 316L weld was reported. Recently, nano materials are being used in commercial welding electrodes as nano-materials have unique mechanical, electrical, magnetic and optical properties differing from traditional materials.23,24,25) B. Chen et al.26) replaced conventional micro scale marble by nano-scale size marble in the flux coating of a hard facing electrode (D600R). Significantly improved arc stability, greater metal deposition efficiency and increased hardness and wear resistance of the deposit were obtained. In another investigation, improved recovery of Mn, Ni, Mo, Ti etc. and improved strength and toughness of weld deposits were reported with an addition of nano-sized TiO2 substituting micro size TiO2 to the coating of SMAW electrode (E11018 M).27)
In the present investigation, at first coated electrode for welding DI has been developed by judicial addition of alloying elements such as Cu, Ni, Mn and Mo, which have a favourable effect on austemperability, in the coating. Then further addition of Ce in the coating at three different levels has been made with the developed electrode. Finally bead-on-plate deposits on DI plates were performed using three developed electrodes containing Ce and one without Ce. All the welded deposits were given isothermal heat treatment at two different austempering temperatures and three different holding time for a given austempering temperature. The microstructures of weld metals in as-deposited condition and after austempering were studied in order to understand the role of Ce and also to find out optimum Ce content based on microstructure (maximum retained austenite) of ADI weld metal. Microstructural analysis was done by optical microscopy (OM), scanning electron microscopy (SEM), transmission electron microscopy (TEM), X-ray diffraction analysis (XRD), EDX analysis and Vickers microhardness testing.
2. Experimental Procedure
2.1. Base Metal
The as-cast DI (base metal) was collected from local foundry. The chemical composition of the base metal is consisted of 3.60% C, 2.6% Si, 0.22% Mn, 0.028% Cr, 0.041% Mg, 0.019% S and 0.01% P.
2.2. Development of Coated Electrodes
2.2.1. Formulation of Flux Composition
The composition of the flux ingredients was varied systematically by adding different alloying elements, graphite powder, silicon powders and de-oxidizer etc. following mainly CaO–SiO2–Al2O3 flux system for developing coated electrode. In the flux composition, graphite powder was used to increase carbon content; Fe–Si and MgCO3 powder were used to increase graphite nodules so that the formation of hard brittle carbide in the weld metal could be avoided. Al powder, Fe–Ti etc. was also added as a strong deoxidiser to take care oxygen. The addition of Fe–Mo, Cu and Ni powder were added to increase the austemperability and hardenability of weld metal. The Na and K-Silicate (14% Na silicate + 4% K silicate) were used as a binder.
Furthermore, three levels of nano CeO2 of size 90–150 nm were added in the flux ingredient of selected developed electrode in order to study the effect of Ce on microstructures and mechanical properties of weld metal. The details flux compositions of the developed electrodes are given in Table 1.
Table 1. Typical flux formulation for development of coated electrodes.
| Flux Ingredient | Weight % |
|---|
| BaCo3 Powder | 1.2 |
| Acidic Fluorspar Powder | 7 |
| Graphite Powder | 24.5±3 |
| Fe–Si Powder | 18±2 |
| Fe–Ti Powder | 1.5 |
| Ni Powder | 0.85 |
| BiCo3 Powder | 0.2 |
| Fe–Mo Powder | 2.7 |
| Al Powder | 7±0.5 |
| Cu Powder | 6±0.5 |
| Calcite Powder | 23 |
| Fe powder | 5 |
| MgCo3 Powder | 0.35 |
| Na Alginate Powder | 1.2 |
| CMC Powder | 1.5 |
| Nano CeO2 | 3±2 |
In this present work, 4 mm dia and 450 mm long low carbon steel wires were used as a core wire for manufacturing of coated electrodes. The typical chemical composition of the core wire contains 0.05% C, 0.48% Mn, 0.018% Si, 0.018% S and 0.022% P. Laboratory extrusion m/c was used to produce coated electrode. At first dry powder of flux ingredients of 2.5 kg was mixed with the help of mixture grinder and liquid binding agent (14% Na silicate + 4% K-silicate) was added to make it wet. The wet mixture of powder is called paste and is ready for extrudable. The cylinder ram in extruder (capacity 27.44 N/mm2) compressed the wet flux at a pressure between 8.82 N/mm2 to 11.76 N/mm2 on extruded die which was fixed at an angle of 30° to the wire centreline. The successful extrusion of the electrode depends on the different factors such as an adequate flux coating ratio with good particle size, the right amount of binder and slipping agent, proper selection of the core wire diameter, eccentricity of coating etc. Coating thickness based on the core wire diameter is another important factor of manufacturing electrode extrusion. The coating ratio, which is the ratio between the electrode diameter and core wire diameter was fixed in the present study as 1.5 and was measured by dial indicator. After successful extrusion, the electrodes were first dried in open air for 24 hs and then transferred to baking furnace where it was heated at 60°C, 90°C and 130°C temperatures for 1 h, 30 min and 1 h holding duration respectively. Among the different coated electrodes E1 was selected on the basis of target chemical composition28,29) and three different Ce containing electrodes such as E2, E4 and E4 were selected for further study to understand the effect of Ce on weld metal microstructures.
2.3. Chemical Composition of Developed Electrodes
Chemical composition of the weld deposits without dilution was made from chemical pad prepared by depositing eight layers successively on DI base plate using four developed electrodes. After completion of the chemical pad, surface of the weld deposits was ground to smooth surface and chemical compositions of all the weld deposits were analyzed using optical emission spectrometer (OES). The details chemical compositions of the developed electrodes are given in Table 2.
Table 2. Typical chemical composition of the weld deposits using developed electrodes.
| Element wt.% | C | Mn | Si | S | P | Ni | Mo | Cu | Al | Bi | Mg | Ca | Ti | Ce |
|---|
| E1 | 3.08 | 0.40 | 2.60 | 0.006 | 0.039 | 0.5 | 0.19 | 0.24 | 0.62 | 0.03 | 0.004 | 0.015 | 0.09 | – |
| E2 | 3.28 | 0.43 | 2.76 | 0.008 | 0.02 | 0.66 | 0.31 | 0.29 | 0.48 | 0.03 | 0.003 | 0.003 | 0.14 | 0.10 |
| E3 | 3.15 | 0.46 | 2.6 | 0.005 | 0.001 | 0.63 | 0.30 | 0.28 | 0.14 | 0.003 | 0.01 | 0.002 | 0.11 | 0.05 |
| E4 | 3.22 | 0.46 | 3.06 | 0.006 | 0.001 | 0.74 | 0.37 | 0.33 | 0.14 | 0.003 | 0.01 | 0.004 | 0.013 | 0.20 |
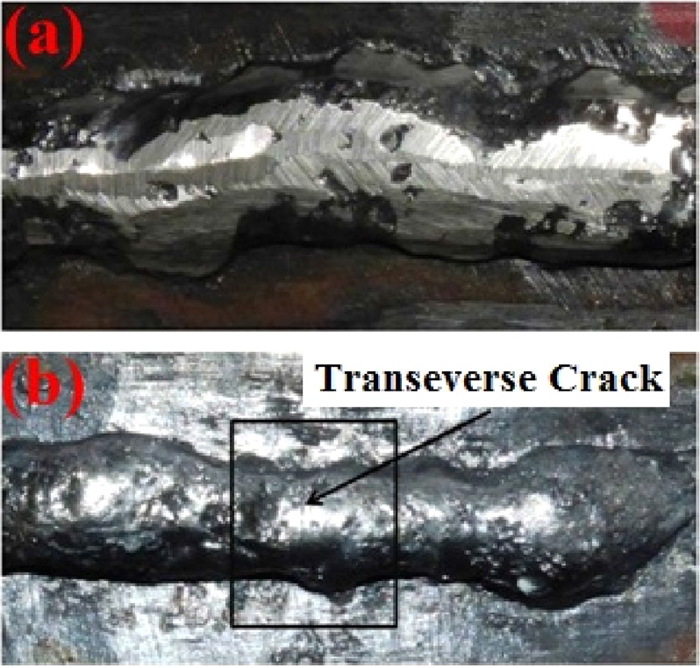
Single pass bead-on-plate was deposited on DI base plates of size 150 × 50 × 20 mm in flat position using shielded metal arc welding (SMAW) process with the developed electrodes keeping the welding parameters same. The required quality of the welds as per standard AWS (D11)30) was obtained for all the four electrodes only at preheat of 300°C for 1 h and post weld heat treatment (PWHT) immediately after welding at 300°C for 1 h.31) The details welding parameters for the establishment of weld procedure are given in Table 3 and typical bead-on-plate weld deposit is shown in Fig. 1.
Table 3. Welding parameters for accepted quality of the welds using developed electrodes.
| Weld Parameters | Unit | Value |
|---|
| Welding Current | A | 150 |
| Arc voltage | V | 24 ±1 |
| Welding Speed | mm/sec | 1.70±0.2 |
| Heat input | kJ/mm | 1.58 ±0.2 |
The as-deposited samples of size 15 × 8 × 5 mm were cut from the bead-on-plate welds for isothermal heat treatment. The isothermal heat treatment was done in two steps; first the samples were austenitizing at 900°C for 2 h holding time. After that the samples were immediately transferred to salt bath (salt mixture: 50% NaNO3 +50% KNO3) for austempering temperature fixed at 300°C and 350°C for 1.5 h, 2 h and 2.5 h holding time followed by air cooling to room temperature. The typical heat treatment cycle is given in Fig. 2.
2.6. Metallography
The DI weldments in as-welded condition and austempered conditions were cut suitably and prepared for microstructural study first by surface grinding to remove any decarburised skin which could form during the heat treatment. The samples were then mounted, polished in silicon carbide papers successively with grades 120, 220, 320, 400, 600, 800, 1000 and 1200 followed by cloth polishing using fine 0.05 μm alumina solutions. After polishing all the samples were etched with 5 wt.% nital solution and microstructures of base metal, HAZ and weld metals were studied using an optical microscope (Carl Zeiss made: AXIO Imager A1m) and photomicrographs were taken at different magnifications (500X, 200X, 100X). For better clarity, samples were also studied under scanning electron microscope (SEM) (JEOL JSM-5510 with INKA software EDS system using an ultra-thin window detector) and photomicrographs were also taken at different magnifications. EDX analysis (FEI Nova nano SEM-430) was done to study the presence of alloying elements in graphite nodules and ADI matrix. For details microstructural analysis transmission electron microscopy (TEM) study was done and the preparation of thin foil was carried out by ion milling in a Philips CM-12 ion mill. Thin foils were examined in JEOL 2100 at 80–200 kV and structures were taken from the different positions at different magnifications.
Nodularity, nodule size and graphite volume percentage of base metal and weld metals were quantitatively measured by Auto CAD 2007.32)
2.7. XRD Analysis
X-ray diffraction (XRD) analysis was performed to estimate the volume percentage of retained austenite as well as the carbon content of the retained austenite using anode Co–Kα radiation in 1.79026 targets with 24 kV and tube current was 40 mA. The specified 2θ range was varied from 30° to 110° with a step size of 0.2°/min. Detailed XRD analysis was performed using integrated intensities of the positions and the integrated intensities for the {1 1 1}, {2 2 0} and {3 1 1} planes of FCC austenite as well as the {1 1 0} and {2 1 1} planes of BCC ferrite. The volume fraction of retained austenite was calculated using the following empirical formula:33)
|
X
γ
=
I
γ
/
R
γ
(
I
γ
/
R
γ
)
+(
I
α
/
R
α
)
| (1) |
Where Iγ and Iα are the integrated intensities and Rγ and Rα are the theoretical relative intensity for the austenite and ferrite, respectively, and Bainitic ferrite was calculated by using formula:
Where, Xγ, Xα and Xg represent the volume percentage of retained austenite, volume percentage of bainitic ferrite and volume percentage of graphite. The carbon concentration of the austenite was determined using the equation:34)
|
a
γ
=0.3548+0.0044
C
γ
| (3) |
Where aγ is the lattice parameter of austenite (in nm) and Cγ is the carbon content of austenite (in wt.%). The {111}, {220} and {311} planes of austenite were used to estimate the lattice parameter.
2.8. Microhardness
Vickers microhardness tests of all the samples in as-welded and isothermal heat treated conditions were performed at room temperature using Leco microhardness tester (Model LM 248SAT) with 100 gf load at 10 s holding time. For each weld sample microhardness was taken at six different positions and the average of the six was considered as representative one.
3. Results and Discussion
3.1. Base Metal Microstructure
The microstructure of the as-received DI is shown in Fig. 3. The microstructure consists of graphite nodules surrounded by ferrite matrix. The average graphite nodularity is approximately 90%, the volume percentage of graphite is 12% and the average nodule size (r) = 18.4 μm.
3.2. Microstructure of As-deposited Weld Metal
The optical microstructures of as-deposited weld metals using without (E1) and with three different levels of Ce containing developed electrode such as E2 (0.1%), E3 (0.05%) and E4 (0.2%) are shown in Figs. 4(a)–4(d). All the weld metals show almost similar microstructural features containing ledeburitic carbide, alloyed pearlite and lower amount of graphite nodules with smaller size. The microstructure of weld metal containing 0.05% Ce is finer and reveals higher amount of ledeburitic carbide with a small amount of alloyed pearlite (Fig. 4(c)) compare to weld metal without Ce content (Fig. 4(a)). Increasing Ce content from 0.05 to 0.1% (Fig. 4(b)) the weld microstructure becomes finer than 0.05% Ce content. Interestingly, the amount of ledeburitic carbide decreased and the amount of alloyed pearlite increased. However, further increasing Ce content (0.2%) the weld microstructure becomes finest and shows almost fully ledeburitic carbide with very lesser amount of alloyed pearlite.

The size of the graphite nodules, nodularity and number of nodules per unit area (mm2) changed with addition of Ce content in the weld metal. With 0.05% Ce content the size of graphite nodule (r = 5.90 μm) and nodularity (70%) both decreased, but the numbers of nodule per mm2 (325) increased compare to without Ce which shows nodule size (r) of 6.72 μm, nodularity of 72% and numbers of nodule per mm2 of 280. Increasing Ce content to 0.1% the size of the nodule slightly increased (r = 6.29 μm) along with increasing the graphite nodularity (74%) and numbers of nodule per mm2 (359). Further increasing Ce content (0.2%) the graphite’s become non-spherical in shape and larger in size (r = 6.63 μm). As expected the graphite nodularity (65%) and the no.s of nodules per mm2 (223) both decreased.
Rare earth (RE) elements (Ce) have a strong ability of deoxidization and desulphurization with the results of forming the high melting point RExOy, RExSy, RExOySz.35) The Gibb’s free energies of these compounds at high temperatures are so low that RE elements can combine readily with O and S when added to liquid metal.36,37) Considering the possibility in forming oxide, sulfhide and oxy-sulphide of cerium in the DI weld metals XRD was performed for all the three weld metals containing cerium. The typical XRD patterns are given in Fig. 5. It can be seen from XRD analysis that addition of Ce has caused the formation of Ce2O3 and Ce2S3 at 0.05% Ce and formation of Ce2O3, Ce2S3 and Ce2O2S at 0.1% Ce. With further increasing Ce, i.e. at 0.2% both Ce2S3 and Ce2O2S are formed. The typical sizes of inclusions of different Ce containing weld metals are given in Table 4.19,37,38,39)

Table 4. Inclusion size of the different Ce containing weld metals.
| Electrode Type | Inclusion Type | Inclusion Size (μm) |
|---|
| E2 | Ce2O3, Ce2S3, Ce2O2S | 4–7 |
| E3 | Ce2O3, Ce2S3 | 2–4 |
| E4 | Ce2S3, Ce2O2S | >7 |
According to the theory of heterogeneous nucleation by Turnbull and Vonnegut,40) whether the nucleating agent could promote nucleation of liquid metal depends on the following two conditions:
(a) There must be high melting point phase particles, which provide an interface of the heterogeneous nucleation, and
(b) The lattice misfit of low-index surfaces between high-melting phase particles and matrix metal must be low.
In the present investigation, one dimensional lattice misfit has been estimated from the following equation:41,42,43)
|
δ=(
a
C
-
a
N
)
/
a
N
| (4) |
Where, δ is the lattice misfit, aC is the atomic spacing of low index crystal face of the crystallizing phase, aN is the atomic spacing of low index crystal face of the nuclei.
The calculated misfit values of the three inclusions i.e. Ce2O3, Ce2S3 and Ce2O2S are 6.86%, 6.65% and 4.54% respectively.
During heterogeneous nucleation, the nuclei with δ < 6% are the most effective, while those with δ between 6% and 12% are medium effective and those with δ > 12% are ineffective as per the theory proposed by Bramfitt.42) Also the melting point can be used as an estimate of the measure of the stability of that compound.44) Thus, among the three particles, the oxy sulphide particle (Ce2O2S) having higher melting point and close matching with the graphite lattice spacing creates the possibility of most favoured substrate for graphite nuclei.
However, from the intensity of the XRD spectra it can be stated that more oxy-sulphite particles (Ce2O2S) have been formed at 0.1% Ce and this has caused to increase the numbers of nodules per mm2 in weld metal containing 0.1% Ce. Increased numbers of nodules per mm2 is only possible when a large number of eutectic cells are being formed during solidification. Thus the eutectic solidification of such a weld metal containing more numbers of nuclei proceeds more rapidly within the graphite solidification temperature range leading to decreased amount of ledeburitic carbide after solidification. Also increasing the numbers of nodules per mm2 in DI weld metal was reported to reducing the chilling tendency of cast iron.45,46) It is well known that the chilling tendency of cast iron has a significant effect on the formation of ledeburitic carbide. Thus reducing the chilling tendency of cast iron will decrease the amount of ledeburitic carbide. However, with further increasing Ce content (0.2%) in weld metal the numbers of nodules per mm2 decreased. This is not unexpected as the less oxy-sulphite has been formed as evident from the intensity of XRD analysis. Hence eutectic solidification in such weld metal proceeds slowly due to less number of nuclei leading to formation of more ledeburitic carbides after solidification. Also, it has been reported that an excessive amount of RE is known to promote the formation non-spherical graphite.47) This is clearly observed in weld metal containing 0.2% Ce as shown in Fig. 4(d).
In order to find out the role of graphitizing elements such as C and Si in each weld metal, their combined effect has been represented by the carbon equivalent (CE):14)
The CE value of each weld metal has been plotted against nodule count of each weld metal (with and without cerium) and is shown in Fig. 6. It can be shown that nodule count (numbers of nodules per mm2) is strongly dependent on CE and increases in proportion to the CE of weld metal. However, nodule count decreases sharply with further increase in CE value of 4.16% probably indicating the dominating role of chilling effect over CE when excessive amount of Ce (0.2%) is present in the weld metal.

The results of EDX analysis of as-deposited weld metal containing Ce content (0.1% Ce) are shown in Fig. 6. SEM structure Fig. 7(a) clearly reveals the different phases of the weld metal and Figs. 7(b), 7(c) represents the EDX analysis results of the two different phases i.e. graphite and matrix respectively. The results show the presence of Ce along with other elements like Si, S, O, C, Mg, Cr and trace amount of Ca in the graphite nodules of weld metal containing Ce. This indicates that graphite nucleated from Ce2O3, Ce2O2S and Ce2S3 after reacting Ce with O & S. Also Mg facilitated to nucleate the graphite nodules as well. However, the matrix of weld deposits is composed of Al, Si, Ca, Cr and C.
3.3. Microstructures of Austempered Weld Metals
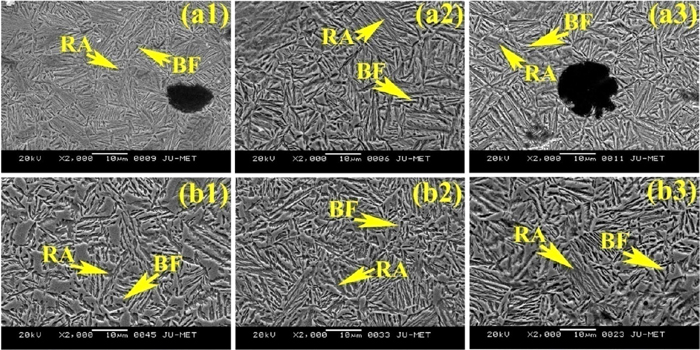
Figures 8, 9, 10, 11 shows the austempered microstructures of deposited weld metals without (E1) and with Ce (E2, E3 and E4) austempered at 300°C and 350°C for 1.5, 2 and 2.5 h holding time respectively. For better clarity, the microstructures (with and without Ce contents) at both 300°C and 350°C for different holding time were studied under SEM and the structures are shown in Figs. 12, 13, 14 and 15 respectively clearly shown the different phase of microstructure.

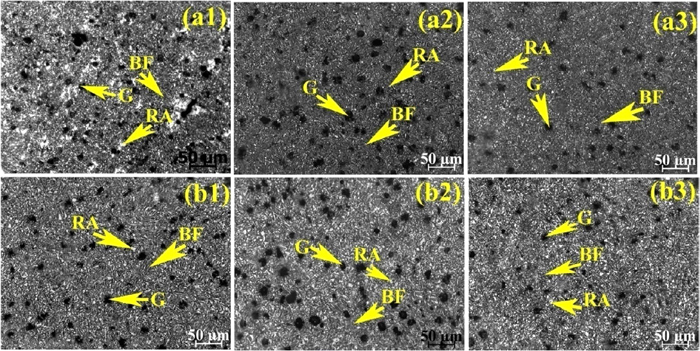

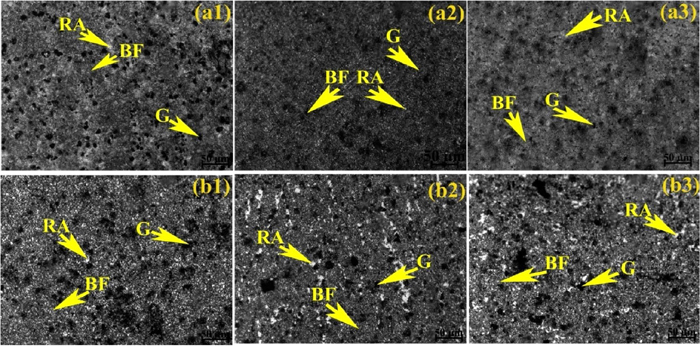

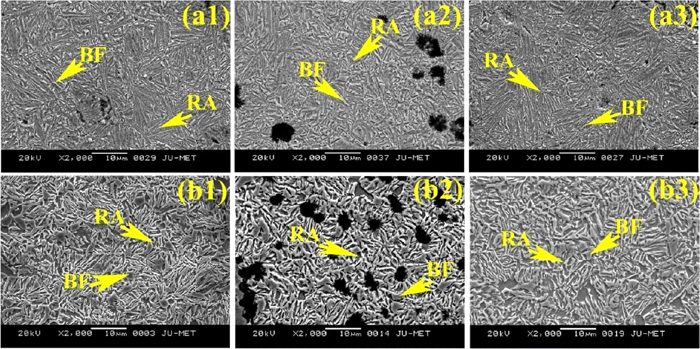
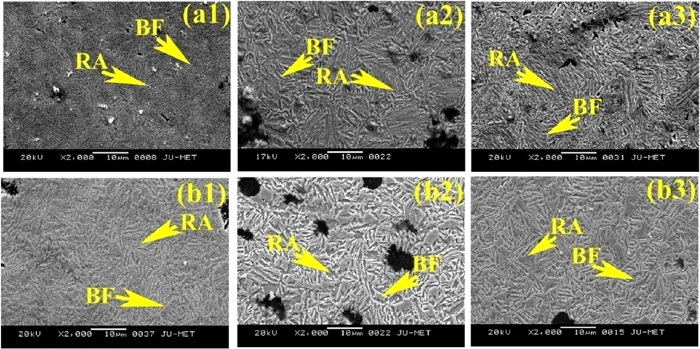
After austempering, the microstructures of weld metals in general consist of bainitic ferrite (dark), retained austenite (white) and graphite nodules. However, the proportion of microstructural constituents varies with changing the austempering temperature and holding time. At 300°C austempering temperature microstructure shows needle-shaped bainitic ferrite with a small amount of film shaped retained austenite and graphite nodules. Whereas, at 350°C austempering temperature microstructure shows feathery shaped bainitic ferrite with a higher amount of blocky shaped retained austenite and graphite nodules. Although the needle shaped bainitic ferrite appears darker with sharp end and the feathery shaped bainitic ferrite appears lighter with blunt end, microstructural features are not very distinct. With changing the austempering holding time (for both the temperatures and varying Ce content), the microstructures varied with respect to shape, size and amount of the constituents. Increasing holding time from 1.5 to 2 h the size of bainitic ferrite as well as the amount of retained austenite content increased. Further increasing holding time from 2 to 2.5 h the size of the bainitic increased further, but the amount of retained austenite decreased.
It is well established that during austempering process, the bainitic ferrite is formed out of the austenite (residual austenite). The growth of bainitic ferrite takes place through diffusion of carbon into the surrounding austenite and thus austenite enriched with carbon and becomes stable as retained austenite.20,21)
Addition of Ce in weld metals has shown significant effect on austempered microstructure. Initially, at 0.05% Ce content (Fig. 10) the microstructures at both the austempering temperatures show coarser bainitic ferrite and lower amount of retained austenite compared to without Ce content (Fig. 8). Interestingly, with increasing Ce content (0.1%) the structure becomes finer (except 1.5 h at 300°C (Fig. 9(a)) and homogeneous (Fig. 9). Also bainitic ferrite decreased and retained austenite increased compare to without Ce and 0.0.5% Ce (Fig. 10) at both the temperatures and holding time. Further increasing Ce content (0.2%) both bainitic ferrite and retained austenite become coarser and higher amount of bainitic ferrite and lower amount of retained austenite are observed (Fig. 11).
ADI undergoes a two-stage process.20) In stage I, austenite decomposes into bainitic ferrite and high carbon retained austenite. In stage II retained austenite transformed to ferrite and carbide.21) The driving force for stage I of austempering depends on carbon content of initial austenite and increases with the decrease of carbon content of initial austenite.7) Since austenitizing temperature and time was same for all the four weld metals (three with Ce and one without Ce), the carbon content of initial austenite depends on as-deposited microstructure. As expected microstructure containing higher amount of fine ledeburitic carbide will contribute more carbon to the initial austenite. In that respect weld metal containing 0.2% Ce should posse’s highest carbon content of initial austenite followed by 0.05% Ce and 0.1% Ce. Thus the driving force for stage I of austempering is highest in weld metal containing 0.1% Ce and lowest in 0.2% Ce. Obviously higher driving force will increase the rate of formation of bainitic ferrite and simultaneously remaining austenite will be enriched with more carbon partitioned from ferrite leading to more amount of high carbon stable retained austenite. Thus addition of 0.1% Ce in weld metal attributed maximum amount of retained austenite (Table 6). However, weld metal containing 0.05% Ce having relatively lower driving force for stage I of austempering than 0.1% Ce containing weld metal shows more bainitic ferrite which should not happen. Actually weld metal containing 0.05% Ce provided lesser bainitic ferrite due to lower driving force and thus less carbon should partition from ferrite to residual austenite which will result more amount of retained austenite with lesser carbon. But lower amount of retained austenite and more amount of bainitic ferrite obtained from XRD results probably indicates portion of low carbon austenite having less stability transformed to martensite. This is not unjustified as the hardness of weld metal containing 0.05% Ce (380 Hv) shows significantly higher than 0.1% Ce containing weld metal (326 Hv). Similarly lesser amount of retained austenite in 0.2% Ce containing weld metal than 0.05% Ce containing weld metal can be justified with the transformation of a portion of less stable low carbon retained austenite into ferrite and carbide.20)
Table 5. Nodularity and the average size of the nodules of without and with different Ce content weld metals.
| Austempering Temp. (°C) | Holding Time (h) | E1 | E2 | E3 | E4 |
|---|
| Nodularity (N) | Nodule size (r) (μm) | Nodularity (N) | Nodule size (r) (μm) | Nodularity (N) | Nodule size (r) (μm) | Nodularity (N) | Nodule size (r) (μm) |
|---|
| As deposited | | 72 | 6.72 | 74 | 6.29 | 70 | 5.90 | 65 | 6.90 |
| 300 | 1.5 | 76 | 5.90 | 74 | 5.79 | 72 | 5.60 | 68 | 6.35 |
| 2 | 78 | 5.86 | 82 | 5.98 | 76 | 5.68 | 72 | 6.30 |
| 2.5 | 76 | 6.34 | 81 | 5.72 | 76 | 5.89 | 69 | 6.65 |
| 350 | 1.5 | 78 | 6.10 | 78 | 5.60 | 72 | 5.49 | 70 | 6.28 |
| 2 | 80 | 5.90 | 84 | 5.68 | 80 | 5.60 | 76 | 6.10 |
| 2.5 | 80 | 6.67 | 76 | 6.2 | 74 | 6.0 | 72 | 6.81 |
Table 6. Micostructural constituents of different austempered weld metals containing with and without Ce.
| Austempering Temp (°C) | Holding Time (h) | E1 | E2 | E3 | E4 |
|---|
| Retained austenite (vol.%) | Austenitic carbon content (wt.%) | Retained austenite (vol.%) | Austenitic carbon content (wt.%) | Retained austenite (vol.%) | Austenitic carbon content (wt.%) | Retained austenite (vol.%) | Austenitic carbon content (wt.%) |
|---|
| 300 | 1.5 | 36.24 | 1.69 | 36.81 | 1.78 | 34.89 | 1.69 | 33.80 | 1.62 |
| 2 | 40.85 | 1.96 | 42.70 | 2.10 | 37.60 | 1.78 | 38.60 | 1.90 |
| 2.5 | 36.98 | 1.73 | 38.12 | 1.96 | 34.48 | 1.60 | 36.83 | 1.82 |
| 350 | 1.5 | 40.21 | 1.95 | 42.55 | 2.02 | 39.80 | 1.86 | 39.82 | 2.01 |
| 2 | 42.50 | 2.10 | 46.74 | 2.20 | 40.83 | 2.10 | 42.81 | 2.12 |
| 2.5 | 38.90 | 1.87 | 39.27 | 1.99 | 36.90 | 1.79 | 36.02 | 1.80 |
Figures 16(a1), 16(b1) shows a TEM micrograph typical of the isothermal transformation heat treated microstructure austempered at 300°C for 2 h containing without and 0.1% Ce weld metal. The microstructure consists of carbide-free bainitic-ferrite laths and interlath film of retained austenite. This structure is considered as “lower bainite” in which the precipitation of interlath cementite has been prevented by the presence of high silicon. At 300°C thin film of retained austenite is the predominant austenite morphology. The microstructure changes from lower to upper bainite as the austempering temperature increases to 350°C (Figs. 16(a2), 16(b2)). The bainitic ferrite lath becomes wider without any carbide and the retained austenite present between the bainitic ferrite laths becomes thicker and appears as blocky form.48)
3.4. Volume Percentage of Retained Austenite and it’s Carbon Content
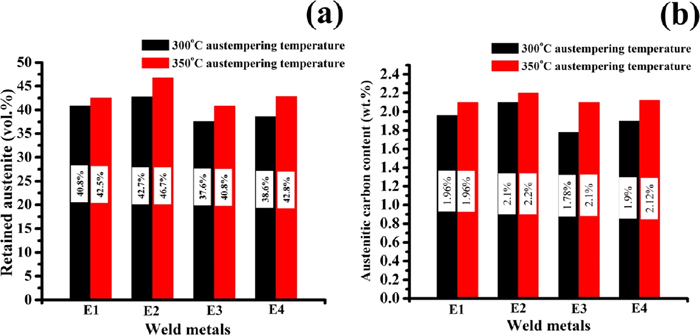
The volume percentage of retained austenite (Xγ) in different weld metals after austempering was determined by XRD analysis. The calculated values at three different holding time (1.5, 2 and 2.5 h) for two austempering temperatures (300°C and 350°C) are given in Table 6 and the variation of two different austempering temperature (300°C and 350°C) for 2 h holding time is shown in Fig. 17(a). For both the austempering temperatures (300 and 350°C), vol.% of retained austenite increases with holding time from 1.5 h to 2 h and then decreased with further increasing holding time (2 h). However, vol.% retained austenite is always higher at 350°C than 300°C for each holding time and thus maximum percentage of retained austenite is obtained at 350°C for 2 h. As expected percentage of bainitic ferrite will vary just opposite manner of vol.% of retained austenite as the austempered structure consists of two microstructural constituents along with graphite nodules.
Lower amount of retained austenite at 1.5 h holding time is due to shorter austempering time which causes incomplete transformation of bainitic ferrite. Increasing the holding time from 1.5 to 2 h, transform of bainitic ferrite will approach to completion resulting with diffusion of more carbon to the surrounding austenite and thus more austenite will be stable as retained austenite. However, further increasing holding time from 2 to 2.5 h the volume percentage of retained austenite was decreased. This decrease is probably due to start of second stage reaction in which the high carbon austenite starts to decompose into ferrite and carbide.7)
However, Ce content influences the amount of retained austenite (vol.%) in weld metals at both austempering temperatures (300 and 350°C). Initially, with addition of Ce content (0.05%) the amount of retained austenite decreased with increasing the amount of bainitic ferrite at each austempering temperature compared to the without Ce content weld metal. With increasing Ce content from 0.05 to 0.1%, the amount of retained austenite increased and shows maximum amount of retained austenite at both the temperatures compared to without and 0.05% Ce. However, further increasing Ce content from 0.1 to 0.2 wt.%, the amount of retained austenite decreased further with increasing the amount bainitic ferrite.
The carbon content of retained austenite at different holding time was determined using the Eq. (3). The calculated results of the austenitic carbon content of all the weld metals (without and with three different level Ce content) at both the austempering temperatures are given in Table 6 and the variation of two different austempering temperature (300°C and 350°C) for 2 h holding time is shown in Fig. 17(b). Interestingly, at both the austempering temperatures, the variation of austenitic carbon content with holding time exactly follows the same pattern with vol.% retained austenite content. Like retained austenite the carbon content of retained austenite was varied with varying the austempering temperature and shows higher at 350°C than 300°C for all the weld metals. It is to be noted that maximum carbon content as high as 2.2 wt.% in retained austenite (46.7%) was obtained in weld metal containing 0.1% Ce at 350°C for 2 h holding time.
At 1.5 h holding time the amount of carbon content is less, because at short time the growth of bainitic ferrite cannot be completed. As a result less amount of carbon diffused to the surrounding austenite. Increasing holding time from 1.5 to 2 h the amount of carbon content was increased because more carbon diffused into austenite. However, further increasing the austempering holding time from 2 to 2.5 h the carbon content decreased due to decrease the amount of retained austenite (vol.%).
3.5. Microhardness
The average microhardness value of as-deposited weld metals are shown in Fig. 18(a) and after austempering at 300°C and 350°C for 1.5 h, 2 h and 2.5 h holding time using without and with Ce content are given in Table 7. The variation of microhardness value at 300°C and 350°C for 2 h holding time represented in Fig. 18(b). In Fig. 18(a) all the as-deposited weld metals show higher hardness value due to the presence of hard ledeburitic phase in the microstructure. With addition of Ce content in weld metals the hardness values varied due to the variation of microstructural constituents in weld deposits. Initially at 0.05% Ce content, the hardness shows higher value (706 Hv) than without Ce content (545 Hv) due to presence of higher amount of finer ledeburitic carbide in the weld metal. With increasing Ce content from 0.05 to 0.1% the hardness value decreased (568 Hv) than 0.05% Ce content, because of lower amount of ledeburitic carbide in weld structure. However, increasing Ce content (0.2%) the hardness shows the highest value (820 Hv) compared to others welds due to the presence of fully finer ledeburitic carbide in weld metal.

Table 7. Average microhardness of different austempered weld metal containing without and with Ce.
| Austempering Temp (°C) | Holding Time (h) | Microhardness (Hv) |
|---|
| E1 | E2 | E3 | E4 |
|---|
| 300 | 1.5 | 369 | 326 | 380 | 398 |
| 2 | 327 | 294 | 340 | 349 |
| 2.5 | 358 | 338 | 383 | 372 |
| 350 | 1.5 | 289 | 280 | 309 | 315 |
| 2 | 280 | 273 | 290 | 292 |
| 2.5 | 308 | 287 | 355 | 358 |
After austempering, the hardness shows lower value in all the weld metals compared to as-deposited weld metals.
After austempering the microhardness values of all the weld metals are lower at 350°C compared to 300°C; because of higher retained austenite content in weld metal at 350°C.
The micrhardness values also varied with varying the austempering holding time for both the temperatures. For all the weld metals, with varying holding time from 1.5 h to 2 h the hardness values decreased, because of increasing the amount of retained austenite in weld metals. However, further increasing holding time from 2 h to 2.5 h the hardness values increased to a great extent which indicates that some amount of austenite further transformed to bainitic ferrite and carbide to make the weld metals harder.20)
The microhardness value in Ce containing weld metals after austempering at both 300°C and 350°C has been changed compare to without cerium containing weld metals. The extent of variation depends on the amount of Ce. For example, weld metal with Ce content in 0.05% the hardness shows comparatively higher than without Ce content. The presence of a lower amount of retained austenite content and higher bainitic ferrite compared to weld metal without Ce content has caused higher hardness. Increasing Ce content (0.1%) the hardness shows lower value compared to other weld metals (with and without Ce) because of the presence highest amount of retained austenite (46.7%) content in weld metal at both the temperatures. Further, increasing Ce content to 0.2% the hardness shows higher value at both temperature due to presence of higher amount of bainitic ferrite and lower amount of retained austenite content. Since bainitic ferrite is harder phase compared to retained austenite, hardness of weld metals will govern by the relative proportion of these two phases as the hardness of graphite is very low.
Since maximum amount of retained austenite (46.7%), which is obtained in weld metal containing 0.1% Ce, is the desirable microstructure after austempering heat treatment.48) Thus, it can be concluded that austempering at 350°C for 2 h holding time is optimum austempering condition and 0.1% Ce is optimum one for DI weld metal studied.
4. Conclusions
The results obtained in this study leads to the following conclusions:
(1) Sound DI welds as per AWS(D11) was established only preheating at 300°C for 1 h holding time and PWHT at 300°C for 1 h immediate after welding.
(2) All the as-deposited weld microstructures in general show ledeburitic carbide, alloyed pearlite and graphite nodules. At 0.05% Ce, microstructure of weld shows finer and increased amount of ledeburitic carbide with lesser alloyed pearlite. Increasing Ce content (0.1%) the structure becomes more refined and the amount of ledeburitic carbide decreased with higher amount of alloyed pearlite. At 0.2% Ce the structure of weld shows almost fully finer ledeburitic carbide with a very small amount of alloyed pearlite.
(3) At 300°C microstructure of weld metal shows needle-shaped bainitic ferrite with film shape austenite and graphite nodules. However, at 350°C shows feathery shape bainitic ferrite with blocky shaped retained austenite. With addition of 0.05% Ce content in weld metal, the shape and size of bainitic ferrite become coarser; whereas at 0.1% Ce content microstructure shows finer and homogeneous. Addition of higher Ce content (0.2%) structure of weld metal again becomes coarser and non-homogeneous.
(4) The volume percentage of retained austenite, bainitic ferrite and austenitic carbon content varied with varying the austempering temperature and holding time as well as with Ce content. At 350°C, all the weld metals show higher carbon enriched retained austenite and lower amount of bainitic ferrite; whereas at 300°C shows higher bainitic ferrite and lower retained austenite content. The maximum amount of retained austenite was obtained at 2 h holding time for both the austempering temperatures. The amount of retained austenite was initially decreased with addition of Ce content (0.05%) and then increased with increasing Ce content (0.1%). Further increasing Ce content (0.2%). the amount of retained austenite again decreased. Thus the maximum amount of retained austenite was obtained at 0.1% Ce containing weld metals at 350°C for 2 h holding time.
(5) Hardness is significantly higher in as-deposited weld metals than austempered weld metals and varied with varying the Ce content in the weld metals. 0.1% Ce which shows lowest hardness due to presence of maximum amount of retained austenite in austempered weld metal has been considered as the optimum amount in the present study.
References
- 1) S. Panneerselvam, S. K. Putatunda, R. Gundlach and J. Boileau: Mater. Sci. Eng. A, 694 (2017), 72.
- 2) P. P. Acharya, R. Udupa and R. Bhat: Mater. Sci. Technol., 34 (2018), 355.
- 3) Q. Song, J. Zhang, N. Zhang, W. Li and L. Lu: J. Mater. Des. Appl., 231 (2017), 423.
- 4) S. Panneerselvam, C. J. Martis, S. K. Putatunda and J. M. Boileau: Mater. Sci. Eng. A, 626 (2015), 237.
- 5) B. Bosnjak, B. Radulovic, K. Pop-Tonev and V. Asanovic: ISIJ Int., 40 (2000), 1246.
- 6) Y. J. Kim, H. Shin, H. Park and J. D. Lim: Mater. Lett., 62 (2008), 357.
- 7) S. K. Putatunda: Mater. Sci. Eng. A, 315 (2001), 70.
- 8) S. Daber, K. S. Ravishankar and P. P. Rao: J. Mater. Sci., 43 (2008), 4929.
- 9) J. Yang and S. K. Putatunda: Mater. Sci. Eng. A, 382 (2004), 265.
- 10) M. Bahmani, R. Elliott and N. Varahram: Int. J. Cast Met. Res., 9 (1997), 249.
- 11) E. M. El-Banna, M. S. Nageda and M. M. Abo El-Saadat: Mater. Lett., 42 (2000), 311.
- 12) M. Pouranvari: Mater. Des., 31 (2010), 3253.
- 13) J. O. Choi, J. Y. Kim, C. O. Choi, J. K. Kim and P. K. Rohatgi: Mater. Sci. Eng. A, 383 (2004), 323.
- 14) H. Horie, T. Kowata and A. Chida: Cast Met., 1 (1988), 90.
- 15) X. G. Diao, Z. L. Ning, F. Y. Cao, S. Z. Ren and J. F. Sun: Key Eng. Mater., 457 (2011), 31.
- 16) M. I. Onsøien, Ø. Grong, T. Skaland and K. Jørgensen: Mater. Sci. Technol., 15 (1999), 253.
- 17) C. S. Kanetkar, H. H. Cornell and D. M. Stefanescu: AFS Trans., 92 (1984), 417.
- 18) J. M. Borrajo, R. A. Martínez, R. E. Boeri and J. A. Sikora: ISIJ Int., 42 (2002), 257.
- 19) X. Zhi, J. Liu, J. Xing and S. Ma: Mater. Sci. Eng. A, 603 (2014), 98.
- 20) J. Aranzabal, I. Gutierrez, J. M. Rodriguez-Ibabe and J. J. Urcola: Metall. Mater. Trans. A, 28 (1997), 1143.
- 21) G. Srinivasan, A. K. Bhaduri and S. K. Albert: Weld. World, 57 (2013), 55.
- 22) S. K. Samanta, S. K. Mitra and T. K. Pal: Mater. Sci. Eng. A, 430 (2006), 242.
- 23) D. S. Hecht, L. Hu and G. Irvin: Adv. Mater., 23 (2011), 1482.
- 24) T. Aizawa and K. Kondoh: Scr. Mater., 44 (2001), 1751.
- 25) B. H. Kear and P. R. Strutt: Nanostruct. Mater., 6 (1995), 227.
- 26) B. Chen, F. Han, Y. Huang, K. Lu, Y. Liu and L. Li: Weld. J. Res. Suppl., 88 (2009), 99.
- 27) T. K. Pal and U. K. Maity: Mater. Sci. Appl., 2 (2011), 1285.
- 28) D. Sun, Z. Zhou and Z. Zhao: Chin. J. Met. Sci. Technol., 8 (1992), 401.
- 29) D. Q. Sun, W. Q. Wang, Z. Z. Xuan, Z. A. Ren and D. X. Sun: Mater. Sci. Technol., 23 (2007), 92.
- 30) American National Standards Institute: Guide for Welding Iron Castings, American Welding Society, Miami, Florida, (1988), 52.
- 31) T. Sarkar and T. K. Pal: SAE Int. J. Mater. Manuf., 11 (2018), 151.
- 32) B. I. Imasogie and U. Wendt: J. Miner. Mater. Charact. Eng., 3 (2004), 1.
- 33) B. D. Cullity: Elements of X-ray Diffraction, Addison and Wesley Publishing Company Inc., Reading, (1978), 32.
- 34) C. S. Roberts: Trans. AIME, 197 (1953), 203.
- 35) W. Bin and S. Bo: Steel Res. Int., 83 (2012), 487.
- 36) A. Vahed and D. Kay: Metall. Trans. B, 7 (1976), 375.
- 37) J. Gao, P. Fu, H. Liu and D. Li: Metals, 5 (2015), 383.
- 38) Y. Jingsheng, Y. Zongsen and W. Chengjian: JOM, 40 (1988), 26.
- 39) Z. Adabavazeh, W. S. Hwang and Y. H. Su: Sci. Rep., 7 (2017), 1.
- 40) G. Thewlis: Mater. Sci. Technol., 22 (2006), 153.
- 41) X. Wu, J. Xing, H. Fu and X. Zhi: Mater. Sci. Eng. A, 457 (2007), 180.
- 42) B. L. Bramfitt: Metall. Trans., 1 (1970), 1987.
- 43) D. Turnbull and B. Vonnegut: Ind. Eng. Chem., 44 (1952), 1292.
- 44) U. H. Udomon and C. R. Loper, Jr.: AFS Trans., 93 (1985), 519.
- 45) E. Fras, M. Gornym and H. F. Lopez: AFS Trans., 114 (2006), 575.
- 46) E. Fras, M. Górny and H. F. Lopez: AFS Trans., 114 (2006), 595.
- 47) X. Diao, Z. Ning, F. Cao and J. Sun: Int. J. Mod. Phys. B, 23 (2009), 1853.
- 48) M. A. Yescas, H. K. D. H. Bhadeshia and D. J. MacKay: Mater. Sci. Eng. A, 311 (2001), 162.