Ironmaking
Fuzzy Comprehensive Evaluation Model of Pulverized Coal Digestibility in Blast Furnace Raceway Based on the Fusion of Subjective and Objective Evidence
2019 Volume 59 Issue 12 Pages 2149-2155
Details
2019 Volume 59 Issue 12 Pages 2149-2155
In the blast furnace smelting process, the pulverized coal digestibility of the tuyere is an important indicator for studying the combustion status of tuyere. It is the basis for decision making and improvement of pulverized coal injection ratio. A correct and effective assessment is of great significance. In this paper, a fuzzy comprehensive evaluation model based on the fusion of subjective and objective evidence is proposed, which integrates the pulverized coal burnout rate, temperature gradient, combustion zone activity, and uniformity. Pulverized coal burnout rate in the raceway is calculated by the mathematical model. The temperature gradient is obtained by digitizing the tuyere image. The activity and uniformity of the combustion zone are defined by the required temperature for the active state of the blast furnace hearth and average temperature, respectively. Through the expert knowledge and principal component analysis to determine the weights of various indicators, a more accurate and comprehensive model of the pulverized coal digestibility of the raceway in the blast furnace is constructed. The evaluation model is applied to make the application analysis of actual blast furnace off-line data, and the evaluation results are consistent with the actual operation data analysis.
In the ironmaking and steelmaking industry, the energy consumption and pollution emissions of the blast furnace (BF) smelting process account for 60% and 90% of the enterprise’s energy consumption and total emissions, respectively.1,2) After decades of development, the fuel ratio of BF ironmaking is closed to the limit of smelting conditions, so many iron smelting scholars have been devoted to the development of coal instead of coke BF iron smelting technology. Increasing the pulverized coal injection (PCI) ratio can reduce energy consumption and pollution emissions.3,4) According to relevant data, the world’s advanced level of PCI is 180–220 kg/t (the PCI rate is 35%–40%), and the world-class level of PCI is 220–240 kg/t (the PCI rate is 40%–45%) at present, while the average PCI of China’s key iron and steel enterprises in 2010 is 149 kg/t.5) Obviously, China’s BF injection pulverized coal (PC) technology is lower than the world’s advanced level. The difficulty lies in the lack of advanced monitoring methods for the combustion status of the tuyere raceway in the BF.
Although improving the PCI ratio is beneficial to energy conservation and consumption reduction, the sharp increase in PCI ratio will also have adverse effects: (1) A large amount of PC cannot be completely burned in the tuyere raceway (The PC is transported to the tuyere through pneumatic conveying. Due to the high speed of hot air entering, the tuyere raceway zone is formed.), resulting in the accumulation of unburned coal in the furnace, especially in the soft melting zone, which affects the operation of the BF.6) (2) The theoretical combustion temperature drops after BF coal injection.7,8) Most of the PCI into the BF is burned out in the raceway, the higher combustion rate of PC is the necessary condition for improving the operation ratio of PCI. Therefore, the real-time monitoring of the raceway can feedback the PC digestion to the BF operators in time, which is conducive to the operator’s grasp of the coal injection system and time, and solve the problem of large inertia and large time lag of the BF. It is crucial for the development of replacing coke with coal.
At present, the evaluation of the PC combustion status in the BF tuyere raceway is mainly divided into: 1) Experienced, semi-empirical and numerical methods are used to calculate the burnout rate of PC. When Yang Tianjun et al.9) Cen Kefa et al.10) Shen et al.11,12) Guo et al.13) calculated the burnout rate of PC, they assumed that the kinetic parameters of PC are constant or only a function of temperature, without considering the influence of PC composition on the kinetic parameters. Fu Weibiao14) found a general rule of PC combustion by analyzing a large amount of experimental data. Only by knowing the industrial analysis value of PC, it is possible to uniformly calculate the kinetic parameters of PC combustion reaction, thus solving the irregularity that has puzzled people for a long time in studying the kinetic parameters of coal char combustion. On this basis, Chen et al.15) established the general model of PC combustion rate of BF combined with the PCI process of the BF. 2) Monitoring flame combustion status by electronically coupled device (CCD). The tuyere is the only peephole that can observe the state of a closed BF in real time. The radiation image of tuyere collected by CCD is an intuitive and effective evidence for evaluating the combustion status of PC. Wen et al.,16) N. Kurihara et al.,17) R. Zhang et al.18) reconstructed the temperature distribution of the raceway zone by image processing technology, and analyzed the PC combustion. Zhou et al.19) firstly proposed the definition of uniformity and activity of each region and circumferential direction of BF tuyere combustion zone, and combined with the temperature distribution, studied the working state of tuyere combustion zone.
The above literatures only study the combustion status of PC in the raceway from a single index such as PC burnout rate or tuyere radiation image. There is no systematic and comprehensive evaluation model to evaluate the PC digestibility of the BF. Based on the previous studies, this paper constructs an evaluation index system including the PC burnout rate, temperature gradient, and the activity and the uniformity of the combustion zone in the raceway. It combines the advantages of the theoretical model of PC combustion with collection of radiant images of raceway zone. Then, using the expert experience and principal component analysis to weight the evaluation index, the final evaluation result of the PC digestibility of the raceway is obtained, which are divided into four grades. This evaluation model not only can evaluate the PC digestibility, but also monitor the operating conditions of the hearth. It can provide early warning for the safety hazards such as cooling or heating of the hearth, and realizes the fusion of all objective evidences from different levels in multi-professional fields and subjective evidences accumulated by experts in different fields for a long time, which improve the effectiveness of the whole system. This evaluation model provides a more reliable basis for the decision-making of replacing coke with coal and reducing energy consumption in the BF.
The basic assumptions for the mathematical model of PC combustion in the raceway are: (1) The temperature and pressure of the gas in the raceway remain stable; (2) Pulverized coal is preferentially burned than coke; (3) The combustion of high temperature PC is mainly based on 2C + O2 = 2CO reaction; (4) The internal temperature of the PC particles is uniform; (5) Does not consider the effect of volatilization on the particle size of PC.
2.1.1. Particle Size EquationAssuming that the PC burning rate is Gc, the PC mass equation is expressed as
| (1) |
The factors affecting PC combustion state include PC particle size, temperature, ambient oxygen gas integral number, oxygen diffusion coefficient, etc. Chen et al. according to the general law of coal combustion proposed by Fu Weibiao, has presented the general expression of kinetic parameters of PC combustion.
| (2) |
| (3) |
Because the combustion rate is related to Fb and k0,ch, a unified general combustion rate
The burnout rate of PC can be calculated by:
| (4) |
According to Planck’s theorem and Wien approximation formula, when the radiator temperature is lower than 3000 and the wavelength A<1, the monochromatic radiance of the radiator is expressed as:
| (5) |
| (6) |
λr=700.0 nm, λg=546.1 nm, and λb=435.8 nm are the color wavelengths of R, G, and B respectively. Any two colors of the formula (3) can be used to obtain the bicolor temperature measurement formula (take R, G for example).
| (7) |
The evaluation of the uniformity and the activity of combustion zone of BF tuyere are very important for BF smelting.21,22) They are important factors affecting the initial distribution of gas flow and the quality of molten iron. They are also of great significance to the longevity, high efficiency and stable running of BF.23) For a long time, the uniformity and the activity evaluation system of BF combustion zone have not been effectively established. Zhou et al. firstly proposed the combustion zone uniformity and activity evaluation system. The evaluation system can provide real-time judgment of the working status of the BF tuyere combustion zone. The uniformity of the tuyere combustion zone is proposed to evaluate the uniformity of each region in the hearth, and is useful for judging the temperature distribution in the hearth and the distribution of PC in various regions of the hearth. The activity is proposed to evaluate the activity of the hearth, and the activity of the hearth will directly affect the quality of the molten iron and the life of the BF. In addition, the activity evaluation is helpful to judge the degree of digestion of PC. In this paper, in order to improve the accuracy and rationality of the model, uniformity, and activity of the tuyere combustion zone are included in the evaluation index system of the PC digestibility evaluation model. Baotou Steel blast furnace has 30 tuyere at equal distances in the circumferential direction, and the two adjacent tuyere are assumed as one region, which is shown in Fig. 1.

Distribution diagram of blast furnace ironmaking process and tuyere combustion zone. (Online version in color.)
By measuring the temperature of the tuyere images collected by CCD, the average temperature of the tuyere combustion zone and the temperature of each region are obtained. The local area uniformity index of the tuyere combustion zone is represented by U:
| (8) |
The activity of the BF tuyere combustion zone is of great significance for improving the quality of molten iron and maintaining the stability of the BF. The activity index of the tuyere combustion zone is given by:
| (9) |
In the process of calculation, the particle size distribution of PC is assumed to be uniform, and the influence of the particle size of PC on the residence time is not considered. The residence time of PC in the gyration zone is 25 ms. The analysis value of PC and furnace dust industry is shown in Table 1.
| Volatile matter | Fixed carbon | Ash | Moisture | |
|---|---|---|---|---|
| PC | 11.09 | 76.39 | 11.57 | 0.95 |
| furnace dust | 3.26 | 18.35 | 78.09 | 0.30 |
Unburned PC will be discharged with the furnace dust and slag in the BF. According to the Baoshan steel research, the ratio of unburned PC in the slag and furnace ash is 1:9. The PC burnout rate is calculated by the formula (4), where the burned carbon mass fraction wc is obtained by analysis of unburned PC. In order to solve the multi-scale problem of different parameters of the BF, ten sampling periods are selected, so that the evaluation indexes are integrated. PC burnout rate is shown in Fig. 2.

PC burnout rate for ten sampling periods. (Online version in color.)
Comparison with literature [22] data, the calculated PC combustion rate is basically between 70% and 80%. It shows that the BF smelting is basically in a long-term stable state, and occasional fluctuations are in line with actual production work.
3.2. Tuyere Raceway Temperature CalculationDue to the complex production environment of the BF, there is a large amount of noise interference in the image of the tuyere, and there are halo, spot and PC occlusion.24) In order to improve the accuracy of temperature distribution detection, the image is denoised and segmented by digital processing technology. Then, the image is grayscaled, and the gray value of each pixel is used to represent the radiation brightness of the monomer. The temperature of each pixel is calculated by the formula (7), and then, the temperature distribution and the average temperature of each region can be obtained. Figures 3(a) and 3(b) are the radiation image and the temperature distributions of 15 regions of Baotou Steel BF at the same time, respectively.

(a) Radiation images of raceway zones in different regions of the first period. (b) Temperature distributions of raceway zones in different regions of the first period. (Online version in color.)
The average of the temperature distributions of each region characterizes the temperature of the region, and the temperature of each region in the first sampling period is shown in Fig. 4.

The temperature in different regions of the first period. (Online version in color.)
We calculate the average temperature of each region in the same sampling period and use it to represent the average temperature of the tuyere combustion zone during the sampling period. The formula is as follows:
| (10) |
| (11) |
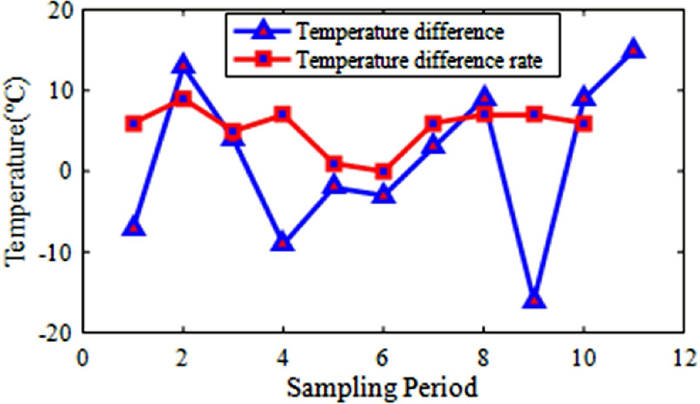
Temperature deviation and temperature change gradient for ten sampling periods. (Online version in color.)
The calculation of the uniformity of each region is expressed by the deviation between the average temperature of each tuyere and the average temperature of the combustion zone. For the unified evaluation index type, the deviation which is smaller and better index will be changed to the bigger and better index.
| (12) |
The activity of each region is the ratio of the average temperature of each tuyere to the temperature required for the active combustion. If the ratio is greater than 1, the tuyere is considered to be active. If the ratio is less than 1, the activity is less active.
| (13) |
In the formula,

(a) Regional uniformity index of the first period. (b) Regional activity index of the first period. (Online version in color.)
The uniformity and activity of the combustion zone during the sampling period are obtained by averaging the uniformity and activity of each region, the formulas are (8) and (9), which are shown in Fig. 7. It can be seen from Fig. 3 that the PC has a lower burnout rate in the first and sixth sampling periods, which also affects the uniformity of the combustion zone at the sampling time.

Regional uniformity index and activity index for ten sampling periods. (Online version in color.)
The above four indicators are used to comprehensively judge the pulverized coal digestibility of the tuyere pipeline, and the index system for evaluating the digestibility of the pulverized coal pulverized coal is established, as shown in Fig. 8.

Evaluation index system of pulverized coal digestibility in the blast furnace raceway.
Through the empowerment of four evaluation indicators, the influence of four indicators on the pulverized coal digestibility of the raceway is integrated, and the fuzzy comprehensive evaluation of multi-angle and multi-faceted information fusion is realized. The weight of the evaluation index reflects the importance of each indicator to the evaluation target, and the corresponding weights need to be allocated reasonably for each indicator. The methods for determining weights can be divided into two categories: subjective weighting and objective weighting. The subjective weighting method relies mainly on expert experience to determine the weight. Although it is easy to implement, it is subjective. The objective weighting method is based on the process parameters in the actual operation of the BF, and obtains the weight of the index through mathematical operations. The determined weight is more objective. In the process of transforming the original variable into the main component, the principal component analysis method simultaneously forms the weight of the reaction evaluation index and the evaluation object to calculate the comprehensive evaluation value. Such evaluation weight selection overcomes the influence of subjective factors and helps ensure objective response to the actual relationship between the samples. In view of the rich operational experience of the BF ironmaking industry and the large amount of operational data, this paper combines the principal component empowerment with expert experience. Through the statistical analysis of the BF operation data, the principal component analysis method and expert experience are used to determine the weight between each factor, so that the weight assignment is more accurate. Table 2 shows the expert experience weighting value and principal component analysis weighting value, which are denoted as UE and Up respectively. Finally, A=0.4UE +0.6Up is used to empower each evaluation indicator.
| PC burnout rate | temperature change gradient | Regional uniformity index | Regional activity index | |
|---|---|---|---|---|
| Expert experience value | 0.2 | 0.3 | 0.15 | 0.35 |
| Principal component analysis value | 0.17 | 0.34 | 0.15 | 0.34 |
According to the actual operation and management requirements of the blast furnace, the pulverized coal digestibility evaluation set L of the raceway contains four evaluation grades: “excellent”, “good”, “general” and “warning”, which are denoted as l1, l2, l3, l4, respectively. That is L={l1, l2, l3, l4}. The weights of each evaluation index are obtained through the authoritative fusion expert experience and principal component analysis. The weights of each evaluation index are obtained by integrating authoritative expert experience and principal component analysis, which is expressed as Ri(i=1, 2, 3, 4). The final evaluation vector is B=AR=[b1, b2, b3, b4]. Finally, the fuzzy evaluation results of ten sampling periods are shown in Fig. 9.
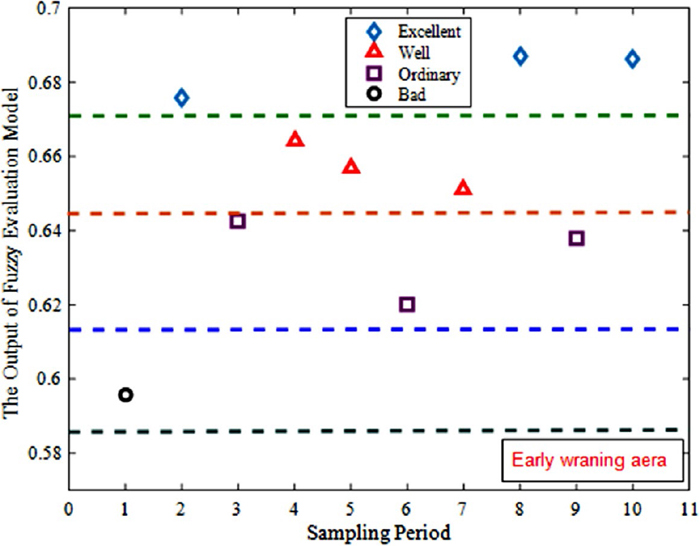
The result of the fuzzy evaluation model for ten sampling periods. (Online version in color.)
It can be seen from Fig. 8 that the fuzzy evaluation results combine the influencing factors of the PC digestibility in the raceway. The evaluation results of the eighth sampling period are the best, and the optimal values of the PC burnout rate, the raceway temperature gradient, the combustion zone uniformity and the activity are the tenth, second, second and ninth sampling periods, respectively. During the above sampling period, the combustion zone of the second and tenth sampling periods is less active, resulting in an evaluation result lower than the eighth sampling period. The pulverized coal combustion rate, the uniformity of the combustion zone and the temperature value of the raceway in the ninth sampling period are low, resulting in the evaluation results being in ‘ordinary’. The eighth sampling period with the best evaluation results has better values in each evaluation index. On the contrary, the first sampling period is not prominent in each evaluation index, resulting in a ‘bad’ evaluation result. In the evaluation results, the early warning area represents poor PC digestibility and the BF operating parameters need to be adjusted. The multi-information fuzzy comprehensive evaluation can eliminate the one-sidedness of the single evaluation index, and can combine the information of multiple levels and different fields to improve the reliability of the evaluation results.
Aiming at the need of monitoring the digestibility of PC in the combustion zone, this paper analyzes the influencing factors of PC digestibility evaluation, and constructs an evaluation index system and fuzzy comprehensive evaluation model for PC digestibility of BF tuyere combustion zone, which avoids the phenomenon that a single evaluation index covering the actual situation. Through the analysis of the actual online detection information, the evaluation results of the model are close to the actual operating conditions, and have strong maneuverability, which is beneficial to the BF operators to adopt appropriate air supply system, thermal system, and coal injection system. It is helpful for discovering the hidden dangers of hearth heating or cooling in time. The research results can provide decision-making assistance for the optimization operation of the new technology of replacing coke with coal in the BF ironmaking industry,25,26) and improve the efficiency of replacing coke with coal operation.
The authors would gratefully acknowledge the financial support from the National Natural Science Foundation of China (No. 61763039).