Physical Properties
Effect of F− Replacing O2− on Crystallization Behavior of CaO–SiO2–Al2O3 Continuous Casting Mold Flux
2019 Volume 59 Issue 2 Pages 367-374
Details
2019 Volume 59 Issue 2 Pages 367-374
In the molten slag system of CaO–SiO2–Al2O3, F− will replace part of the bridging oxygen in the Al–O network as bridging fluorine. The electronegativity of fluoride ions is greater than that of oxygen ions. By maintaining the molar number of metal cations, and using an equimolar amount of CaF2 to replace CaO, i.e., F− instead of O2−, the main focus of this research is whether one can inhibit the crystallization of the CaO–SiO2–Al2O3 slag system. In this paper, the techniques of single hot thermocouple technique, X-ray diffraction and Raman spectroscopy were used to analyze the crystalline properties, the crystalline phases and the molten slag structure. The results show that with the increase in the amount of equimolar CaF2 replacing CaO, the structure of Q0 decreases in prevalence, the structure of Q2, Al–F–Al and Al–O–Si with high polymerization increases in prevalence, the critical cooling rate decreases, the high temperature precipitation material of the sample changes from dicalcium silicate to gehlenite, and there will be CaF2 precipitation at low temperature.
The conventional continuous casting mold flux is a wollastonite-based CaO–SiO2 slag system with Al2O3 < 10 mass%. Gao Jinxing et al.1) point out that the basic unit of the slag structure is [SiO4] tetrahedron when Al2O3 is less than 5 mol% (approximately 8 mass%), and the structure of the [AlO4] tetrahedral begins to appear in the slag when Al2O3 is more than 5 mol% (approximately 8 mass%). Kim2) also pointed out that when Al2O3 > 20 mass% (approximately 13 mol%), the [SiO4] tetrahedral content in the system is significantly reduced, the structure of Al–O0, Al–O− and Al–O–Si is increased significantly, and the structure of the [AlO4] tetrahedral began to dominate. Therefore, the mold flux with Al2O3 > 5 mol% (approximately 8 mass%) is defined as a CaO–SiO2–Al2O3 slag system, in this paper. For the CaO–Al2O3 (CA) slag system, it contains approximately 50% CaO (close to C12A7) and <10% SiO2.3) The CaO–SiO2–Al2O3 slag system not only fixes F−,4) but also increases the surface tension of slag by increasing its Al2O3 content. Increasing the surface tension of the mold flux is beneficial to prevent slag entrapment and control the solidification hook inclusions of the ultralow-carbon steel. Therefore, the CaO–SiO2–Al2O3 slag system is undoubtedly an environmentally friendly slag system and is beneficial to improving the quality of the steel.
CaF2 exists in the flux which can break the network in the traditional CaO–SiO2 slag system continuous casting mold slag5) and is an essential part of the formation of cuspidine.6,7,8) In the mold slag CaF2 is also a critical flux to adjust the viscosity and crystallization properties of the slag.9) However, recent studies have pointed out that fluorine exists in the form of Al–F bonds and Ca–F bonds in the CaO–SiO2–Al2O3 slag system with high Al2O3 content,4) i.e. the fluorine is not only in the form of Ca–F bonds that can break the network but also in the form of bridging fluorine in the aluminum-oxygen structure network. The Electronegativity of fluoride ions and oxygen ions are 4.0 and 3.5, respectively, that is the electronegativity of fluorine is higher than that of oxygen.10) The use of equimolar CaF2 instead of CaO can form the bridging fluorine in the slag which can improve the bond energy in the structure. The improvement of the bond energy can inhibit the crystallization of the mold flux and ensure the lubricating function of the continuous casting of ultralow-carbon steel. However this role is not yet clear. Therefore, SHTT, X-ray diffraction (XRD) and Raman spectroscopy were used in this research. In this research, we replace the CaO with an equimolar amount of CaF2 and keep the number of cation moles constant to explore the influence on the crystallization properties and the structure of the CaO–SiO2–Al2O3 slag system, which can provide the basic parameters for the development of the CaO–SiO2–Al2O3 slag system.
The experimental slag components were designed to explore the influence of the equimolar amount of CaF2 instead of CaO on the crystallinity and microstructure of the mold fluxes that maintain the molar amount of cations in the fluxes, shown in Table 1.
| NO. | CaO | SiO2 | Al2O3 | Na2O | Li2O | CaF2 | MgO |
|---|---|---|---|---|---|---|---|
| CSA-1 | 38.53 | 22.79 | 12.56 | 10.39 | 4.29 | 6.61 | 4.83 |
| CSA-2 | 36.88 | 22.79 | 12.56 | 10.39 | 4.29 | 8.26 | 4.83 |
| CSA-3 | 35.23 | 22.79 | 12.56 | 10.39 | 4.29 | 9.91 | 4.83 |
| CSA-4 | 33.58 | 22.79 | 12.56 | 10.39 | 4.29 | 11.56 | 4.83 |
| CSA-5 | 31.93 | 22.79 | 12.56 | 10.39 | 4.29 | 13.21 | 4.83 |
| CSA-6 | 30.27 | 22.79 | 12.56 | 10.39 | 4.29 | 14.86 | 4.83 |
| CSA-7 | 28.62 | 22.79 | 12.56 | 10.39 | 4.29 | 16.51 | 4.83 |
The analytical reagents were used to prepare the composition of Table 1. To configure the sample, we prepared a 50 g slag sample, mix it mechanically, and put it in the graphite crucible. In the end, we placed the sample in a high-temperature silicon-molybdenum furnace at 1400°C for homogenization.
The mixture was melted in the furnace for 8 min and was then stirred with molybdenum rods for 10 seconds and poured into a cool copper plate to quench. The quenched specimen, which was approximately 3 mm in diameter, as dried in a drying oven at 60°C and subjected to Raman spectroscopy. All the other slag specimens were then ground in a mortar and passed through a 200 mesh screen for the XRD and SHTT tests.
2.2. SHTT Experimental ProcessThe single hot thermocouple method (SHTT) was used in the experiment, shown in Fig. 1. The miniature furnace can provide an auxiliary heat source with its halogen lamp and is sealed to provide a stable and uniform test environment. Before the experiment, the temperature of SHTT should be calibrated by K2SO4, which has a melting point of 1069°C11) and has a significant melting phenomenon. The K2SO4 should be placed on the B-Type Pt-Rh thermocouple, and then, the temperature of the thermocouple should be controlled by the computer to make the K2SO4 just barely melt at 1069°C. After that step, should repeat 3 times to ensure the accuracy of the experiment. The temperature error of the SHTT is controlled within ±1°C.
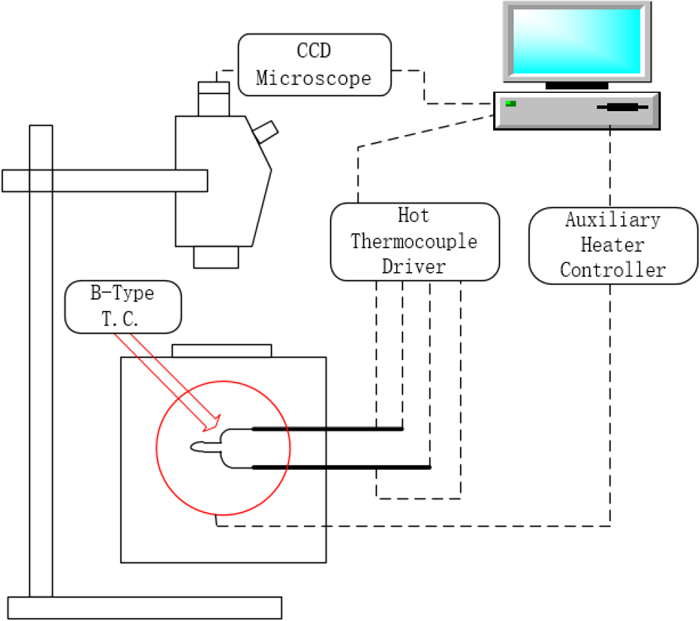
The schematic of SHTT. (Online version in color.)
The prepared specimen was placed on a Pt-Rh thermocouple and subjected to the continuous cooling experiment (CCT) and the isothermal transition experiment (TTT) under atmospheric conditions.
The temperature control curve of the CCT experiment is shown in Fig. 2. As shown in Fig. 2, the temperature increased to 1500°C at a heating rate of 20°C/s, and then, the samples were incubated for 25 seconds and cooled down to 800°C at a set cooling rate. During the cooling process, the crystals would precipitate from the molten slag due to the increase in the supercooling degree. The greater the cooling rate was, the lower the crystallization temperature and the shorter the crystallization time. The crystal could not precipitate when the cooling rate reached the critical cooling rate due to the limit of mass transfer. After that, the CCT curve could be drawn by analyzing the starting time of crystallization and the cooling rates of the in situ images.
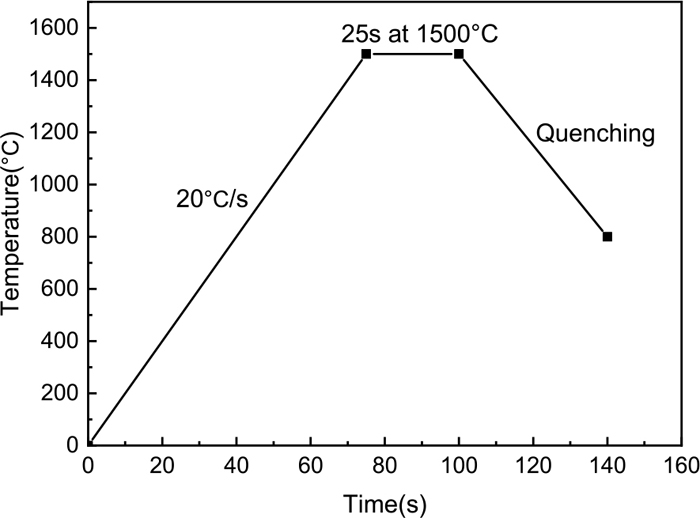
Schematic of temperature profiles in continuous cooling experiment.
The temperature control curve of the TTT experiment is shown in Fig. 3. As shown in Fig. 3, the temperature of slag was raised to 1500°C at a rate of 20°C/s; then, it was held at 1500°C for 25 s to homogenize the samples; next, it was cooled to the designated temperature as fast as possible, at approximately 220°C/s;12) and finally, the sample was incubated until wholly crystallized. The incubation temperature interval was 925°C–1350°C, and the experimental step length was 25°C.
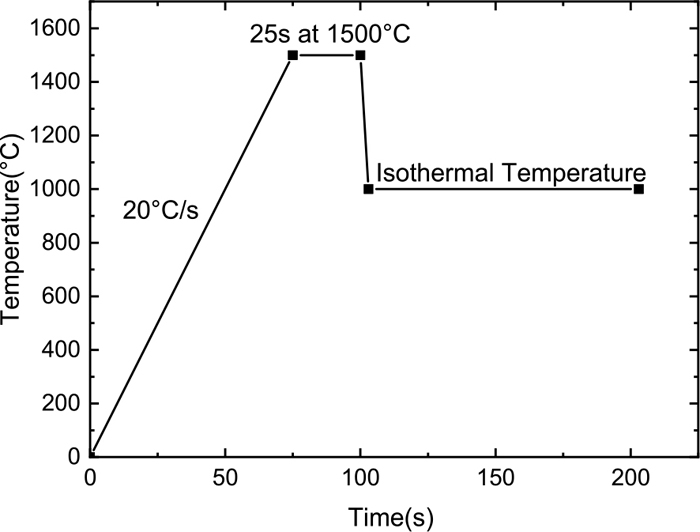
Schematic of temperature profiles in isothermal experiment.
In this study, the crystallization rate of 5% is the starting point of crystallization, and the crystallization rate of 95% is the terminus of crystallization.13) Due to the error in distinguishing pictures by eye, this study used the SHTT image analysis software developed by our group to analyze the SHTT images and accurately determine the change in the crystallization rate for the in situ observation image. The principle of the software is to analyze the gray scale changes of the crystallization process image. Through the above method, all the data points were summarized to draw the CCT curve and the TTT curve.
2.3. XRD Experimental ProcessIn this study, a PANalytical EMPYREAN Powder X-ray diffractometer was used to analyze the experimental slag system and obtain the crystal type of CaO–SiO2–Al2O3 slag casting slag at different temperatures. CSA-2 and CSA-6 were selected for XRD detection because they have large compositional differences and are representative of their components. The specimen was prepared by the SHTT method and the temperature control curve was the same as that in Fig. 3. During sample preparation, the holding temperature was determined by the nose of the TTT curve. To obtain completely crystallized specimens, the holding time was 5 min. The specimen was then quenched to room temperature and was subsequently subjected to crushing and grinding to make sample powders for the XRD tests.
2.4. Raman Spectroscopy Experimental ProcessIn this study, Raman spectroscopy was used to analyze the structure types of CaO–SiO2–Al2O3 slag and the influence of the equimolar CaF2 instead of CaO on the structure of the slag system.
CSA-2, CSA-4, and CSA-6 quenched specimens were selected for the Raman spectroscopy test, which represents the specimens of high, medium and low replacement of CaO by CaF2, respectively. The diameter of the specimens is approximately 3 mm. The LabRAM HR Evolution Raman spectrometer (HORIBA, Japan) was used for this experiment. The light source used a 532 nm solid-state laser with a power of 100 mW. The measurement threshold of the instrument was as low as 10 cm−1. In this experiment, the laser power was 10%, the exposure time was 10 s, the number of scan was 6, and the continuous scanning mode was selected. The scanning range was chosen from 200–1600 cm−1.
Figure 4 shows the CCT curves of CSA-1~CSA-7 specimens and the critical cooling rate colored in red. The critical cooling rate of the CCT curve is shown in Fig. 5, in which the critical cooling rate decreases with the increase in the amount of equimolar CaF2 replacing CaO. The critical cooling rate reflects the crystallization of a slag sample. The greater the critical cooling rate is, the stronger the crystallization ability, and vice versa. The crystallinity of the slag sample therefore weakens when the CaO amount increases in the CaF2-substituted CaO–SiO2–Al2O3 slag.
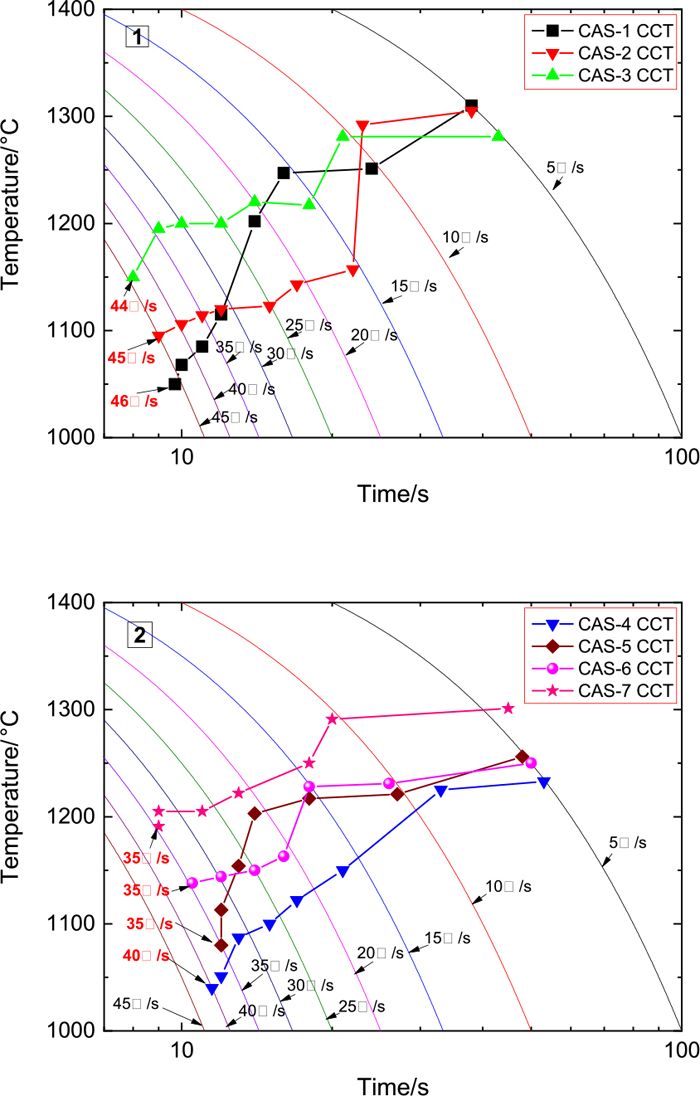
CSA-1~ CSA-7 CCT Diagrams. (Online version in color.)
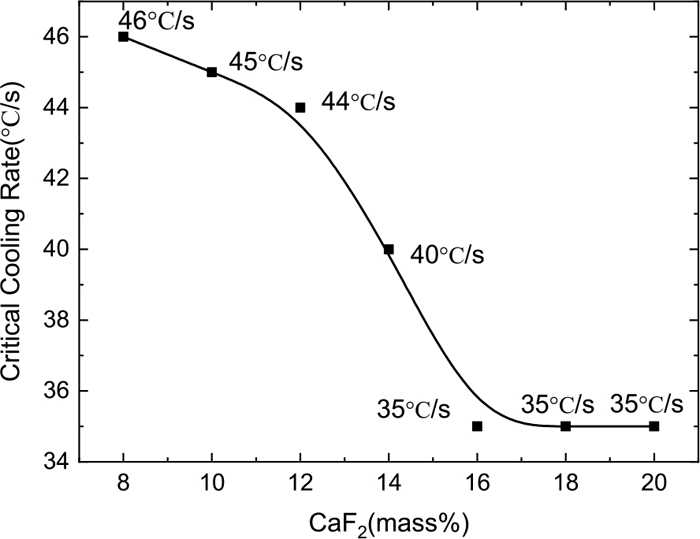
Critical cooling rate with CaF2 curve.
In Fig. 5, the critical cooling rate decreases by 0.5°C/s for every 1 mass% CaF2 addition when the content of CaF2 is 8–12 mass%; the critical cooling rate decreases by 1.75°C/s for every 1 mass% CaF2 addition when the content of CaF2 is 12–16 mass%; and the critical cooling rate changes slowly when the content of CaF2 is more than 16 mass% in the specimen. Gao and Wen14) pointed out that in the CaO–SiO2–Al2O3 slag system, when CaF2 is less than about 9.5 mass%, CaF2 promotes the depolymerization of the network structure, and when it is greater than about 9.5 mass%, the increase of CaF2 leads to an increase in the polymerization. And in the CaO–SiO2–Al2O3 slag system, bridging fluorine is one of the three existing forms of fluorine, which increases with the increase of CaF2.1,15) From this when the CaF2 content is less than 12 mass%, only a small amount of F-bridging affects the crystallization; when the CaF2 content is 12–16 mass%, the bridging fluorine replaces the bridging oxygen dramatically, which restrains the crystallization of the slags; and when the CaF2 content is more than 16 mass%, the amount of bridging fluorine reaches the limit, and it is impossible to continue to enhance the inhibition of crystallization by increasing bridging fluoride.
The TTT image shown in Fig. 6 was gained by analyzing the crystal growth process image. The stability of molten slag during the thermostatic process is controlled by both thermodynamics and kinetics. When the temperature reaches the nose temperature, the thermodynamics and kinetic conditions work together to reach the optimum conditions for crystal precipitation. The incubation time and the crystal growth time are the important signs of crystallization properties.16) From Fig. 6, the 95% crystallization curve of TTT images in CSA-1~CSA-7 samples contains two noses, showing that the experimental slag system has different crystalline phases precipitating in the high and low-temperature regions.12)
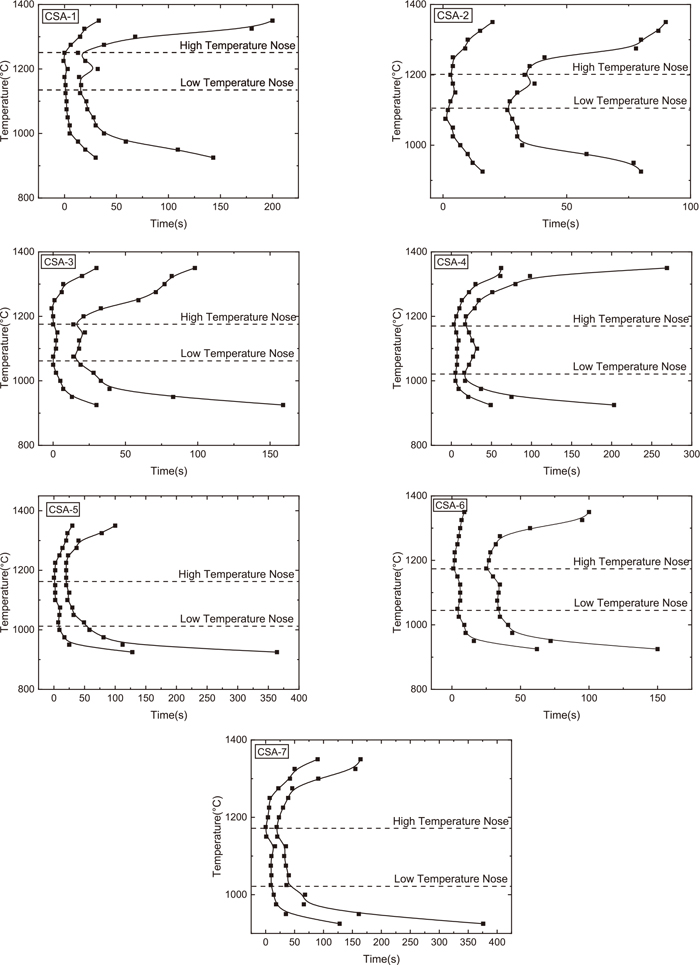
CSA-1~CSA-7 TTT Diagrams.
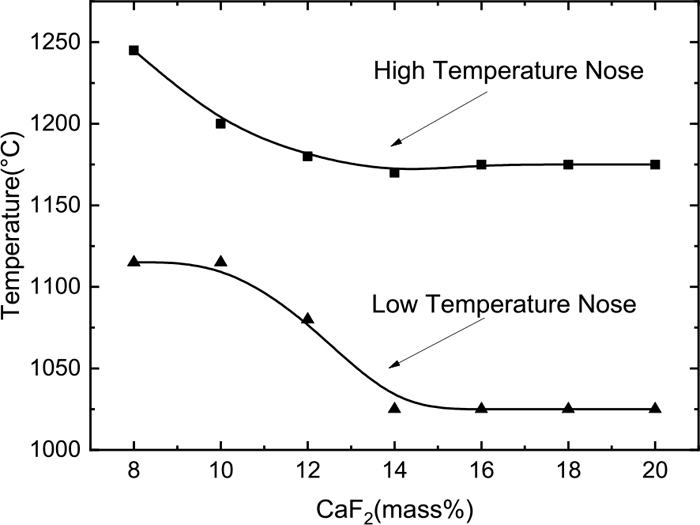
Figure 7 shows the relationship between the nose temperature of the slags and the CaF2 content. We can see that when the CaF2 content is less than 14 mass%, the high and low nose temperatures decrease with the increasing CaF2 amount in the continuous casting mold powder; when the content of CaF2 is more than 14 mass%, then the high and low nose temperatures do not change with the increasing CaF2 amount.
Changes of nose temperature with CaF2 content.
The nose temperature is the equilibrium point between kinetic and thermodynamic conditions, and represents an optimum temperature for the formation of crystals.17) The decrease in nose temperature reflects the better kinetic conditions for crystallization. Therefore, as can be seen from Fig. 7, with the increase of CaF2, the kinetic conditions are getting better first and then does not change. Gao and Wen14) also pointed out in their research that with the increase of CaF2 in CaO–SiO2–Al2O3 slag, CaF2 first acts as a diluent, and then it becomes a trend of network formation. Therefore, the temperature change of the nose temperature can also indicate that with the increase of CaF2 in the CaO–SiO2–Al2O3 slag system, the role of CaF2 in the slag is changed from diluent to the substance that promotes slag polymerization, and with the increase of CaF2, two roles achieve balance.
The changes in the crystal growth time at low and high nose temperatures that change with the composition of specimens are shown in Fig. 8. The crystal growth time refers to the time from crystallization of 5% to the crystallization of 95% in the TTT experiment. Regarding the increase in the CaF2 content in CaO–SiO2–Al2O3 slag, the crystal growth time of a low nose temperature increases continuously when the CaF2 content is less than 16 mass% and is maintained when the CaF2 is more than 16 mass%. However, the crystal growth time of high temperature nose continues to increase. The experimental results show that in the CaO–SiO2–Al2O3 slag when the content of CaF2 is 8–20 mass%, the crystallization performance is weakened by the increase of CaF2. Moreover, the inhibition of crystallization is more pronounced in the high temperature region. The slag at the high nose temperature has better kinetic conditions, it can be speculated that good kinetic conditions are favorable for bridged fluorine to prevent the formation of crystals. In this part, the effect of CaF2 on the crystallization properties is consistent with the results of the critical cooling rate and the nose temperature.
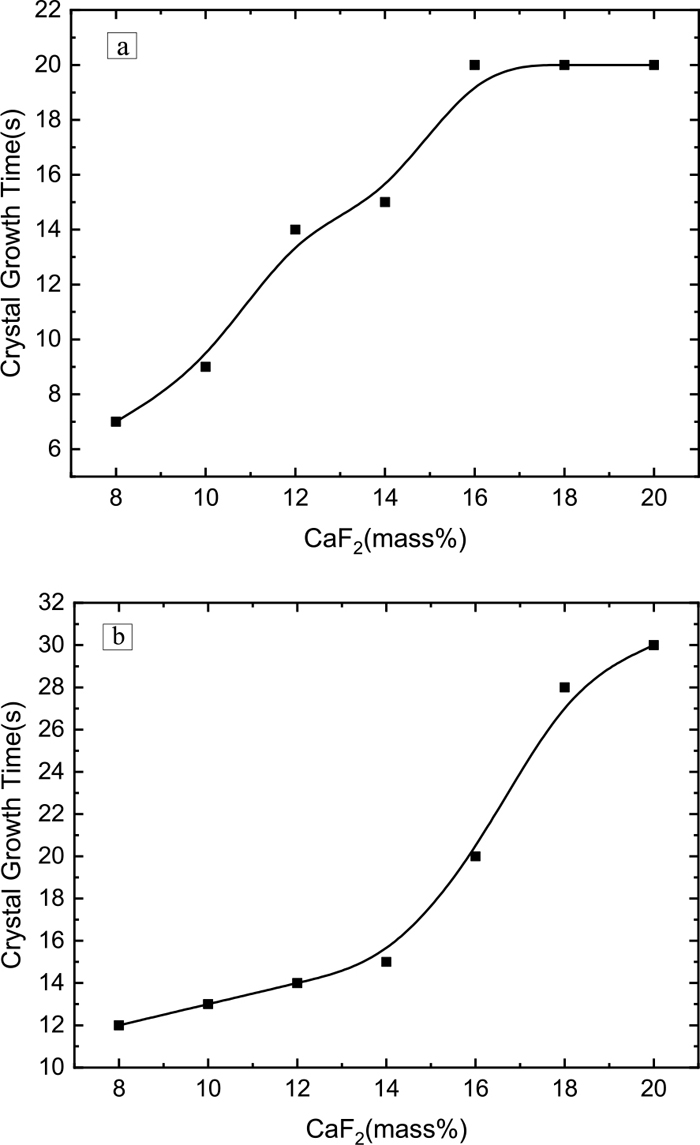
Crystal growth time changes at nose temperature. (a) Crystal growth time of low nose temperature, (b) Crystal growth time of high nose temperature.
The CCT results and TTT results indicate that the increase in the CaF2 substitution of CaO does not promote crystallization, instead inhibiting crystallization. This result confirms the concept that the bridge fluorine will form in the slag, increasing the energy to break the bond and further inhibiting the crystallization.
3.2. Raman Spectroscopy ResultsCSA-2, CSA-4 and CSA-6 specimens were selected for the Raman spectraroscopy testing to further explore the role of the bridging fluoride in the structure. The Raman spectrum deconvolution image is shown in Fig. 9. All the Raman spectra deconvolution peak-fitting R2 values are greater than 99.99%.6) This paper analyzed the structures of Q0, Q1, Q2, Al–O–Si, Al–O−, Si–O0, Al–O0 and Al–F–Al. Qn represents a silicon tetrahedral structure containing different amounts of bridging oxygen, and n represents the amount of bridging oxygen in the silicon tetrahedron from 0 to 4. The larger n is, the more complex the melt structure and the weaker the crystallization property. The schematic diagram of the Q0–Q4 structure is shown in Fig. 10.
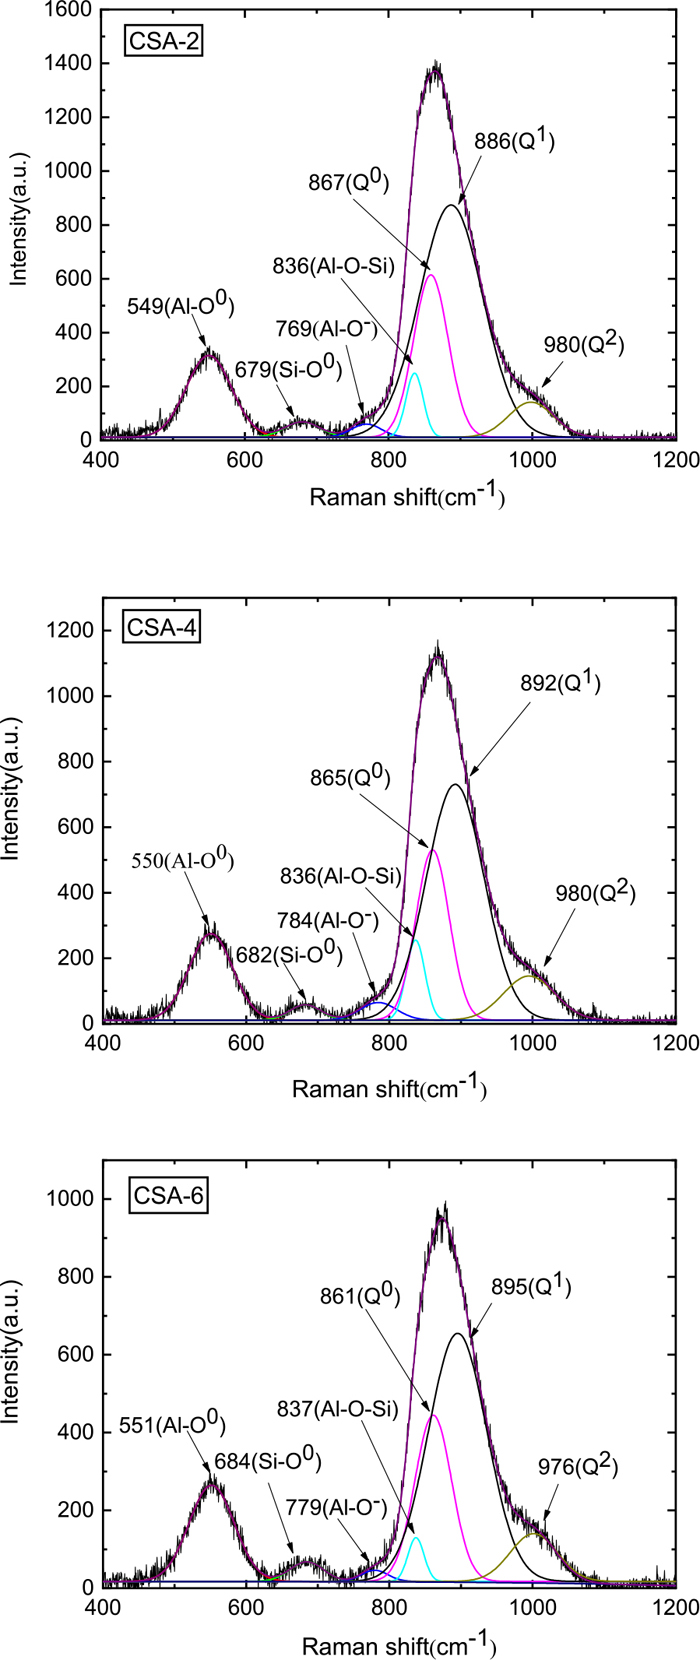
Typical deconvolution of the Raman spectra obtained for the CSA-2 CSA-4 CSA-6 mold flux. (Online version in color.)
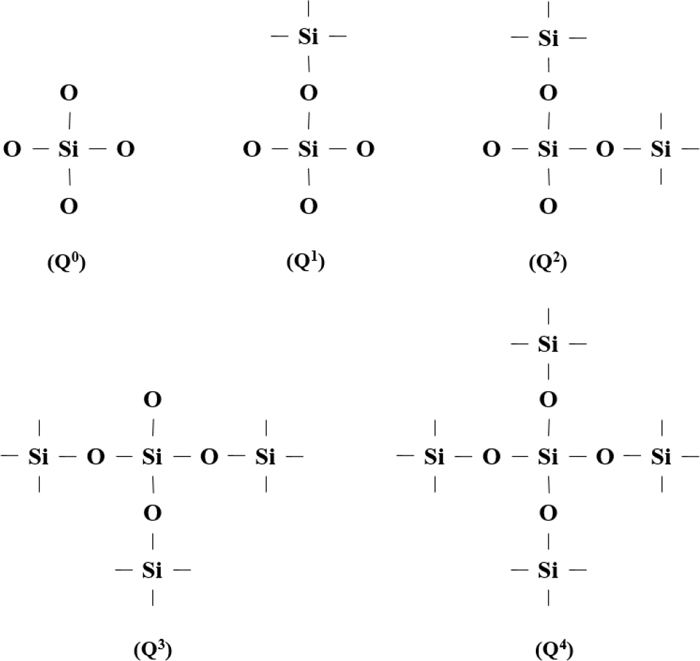
Schematic of five kinds of silicon tetrahedron microstructure.
As a semi-quantitative analysis method,18) Raman spectroscopy can analyze the relative content of the structure in slag. Therefore, by analyzing the Raman peak area of Fig. 9, the Raman shift and the relative change in the content of different structures in the slag are obtained, as shown in Table 2. Some scholars have pointed out that the Raman peaks of Al–O0 and Al–F–Al structures are very similar,19) so the Raman peaks of the two overlap. In Table 2, the Raman peak approximately 552 cm−1 is counted as the sum of the Al–O0 structure and Al–F–Al structure.
| NO. | CSA-2 | CSA-4 | CSA-6 | Raman Bands | Reference |
|---|---|---|---|---|---|
| Raman Shift (cm−1)/Peaks’ Area Ratio (%) | 550/13.40 | 551/13.50 | 552/14.04 | Al–O0 | 6,20) |
| 680/1.97 | 683/1.73 | 685/2.30 | Si–O0 | 21,22) | |
| 769/1.44 | 785/2.31 | 779/1.03 | Al–O− | 6,20) | |
| 836/3.98 | 837/4.35 | 837/5.44 | Al–O–Si | 23,24) | |
| 859/20.26 | 860/19.29 | 861/18.17 | Q0 | 22,25) | |
| 887/53.24 | 892/50.71 | 895/50.23 | Q1 | 22,25,26) | |
| 998/5.70 | 995/8.10 | 1002/8.78 | Q2 | 6,22,26,27) |
The structures of Q0, Q2, Al–O–Si, Al–O0 and Al–F–Al change with the CaF2 content as shown in Fig. 11. As the amounts of Al2O3, Al–O–Si, Al–O0 and Al–F–Al increase, the amount of Q0 decrease as CaF2 substitutes for CaO.
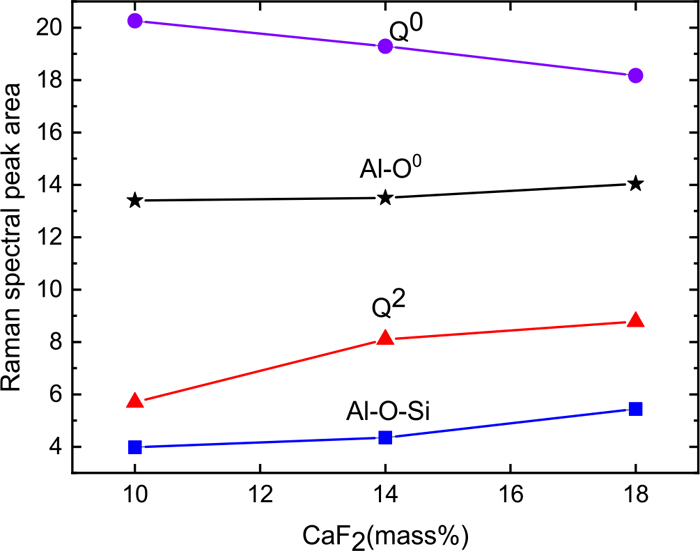
Raman spectral peak area of specimens with changes of CaF2. (Online version in color.)
With increasing CaF2 substitution for CaO, the oxygen content will decrease in the slag system, and the formation of the Al–O0 structure will be suppressed. The Raman peak area near 552 cm−1 decreases which reflects the Al–O0 and Al–F–Al structure.28) This situation occurs because the number of Al–F–Al structures increases indirectly. Under the condition of increasing the number of Al–F–Al structures, the slag crystallization capability reflected by the CCT and TTT curves shows a decreasing tendency. The above discussion shows that more energy is required to break the bond during the crystallization process because of the Al–F–Al structure having a stronger bond energy than that of the Al–O0 structure, so the crystallization performance of the mold powder decreases.
The structure of the experimental slag system changes from Q0 to Q2 when the substitution degree of CaO by CaF2 increases. This result is due to the decrease in the amount of oxygen in the system, leading to a reduced number of bridging oxygen units. The slag structure is developed from Q0 to Q2 with a high degree of polymerization, and thus the slag crystallization is inhibited.
As a result, the prevalence of Al–F–Al and Q2 structures increase with the increasing amount of CaF2 replacing CaO (F− replacing O2−) in the slag, which promotes the degree of polymerization. Thus, the energy required to break these bonds during crystallization increases, and the crystallization properties of the slag are suppressed.
3.3. XRD ResultsThrough the TTT curve, the nose temperatures of CSA-2 are 1100°C and, 1250°C and of CSA-6 are 1150°C and, 1275°C. Thus, we prepared samples of the CSA-2 and CSA-6 based on the above nose temperatures by SHTT. The XRD test results of the CSA-2 and CSA-6 specimens are shown in Fig. 12, and the crystalline types are shown in Table 3. From Table 3, we can conclude that the CaO–SiO2–Al2O3 slag-based continuous casting mold slag precipitates Ca2Al2SiO7 or Ca2SiO4 at a high-temperature, and precipitates CaF2 at a low-temperature. The Ca2Al2SiO7 and Ca2SiO4 remain stable at a low-temperature.
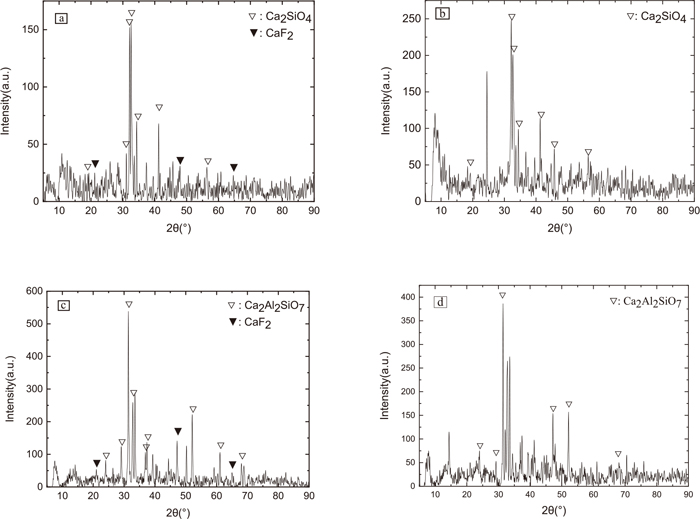
XRD diffraction patterns of CaO–SiO2–Al2O3 slags. (a) CSA-2 1100°C, (b) CSA-2 1250°C, (c) CSA-6 1100°C, (d) CSA-6 1215°C.
| NO. | CSA-2 | CSA-6 | ||
|---|---|---|---|---|
| Temperature/ °C | 1100 | 1250 | 1100 | 1215 |
| Crystal | Ca2SiO4 & CaF2 | Ca2SiO4 | Ca2Al2SiO7 & CaF2 | Ca2Al2SiO7 |
In Fig. 11, as the amount of CaF2 replacing CaO increases, the Q0 structure in the mold powder decreases and the Al–O–Si structure amount increases significantly. The Q0 structure is the crystal frame of Ca2SiO4, and the Al–O–Si structure is one of the main structures to promote the formation of Ca2Al2SiO7.29) Therefore, the decrease in the Q0 prevalence suppresses Ca2SiO4 precipitation, and the increase in the Al–O–Si structure prevalence promotes Ca2A2lSiO7 precipitation. The high-temperature precipitate of CSA-2 slag is thus Ca2SiO4, and the high-temperature precipitate of CSA-6 slag is Ca2Al2SiO7. The precipitation of CaF2 at low-temperature is due to the segregation of components caused by the high-temperature crystallization phase, which is consistent with the XRD results of BOXUN LU30) on CaO–Al2O3 slag.
(1) From the CCT and TTT curves, the critical cooling rate decreases and the crystallization time increases when replacing CaO by an equimolar amount of CaF2 in the CaO–SiO2–Al2O3 slag system. The crystalline capacity of CaO–SiO2–Al2O3 slag is inhibited.
(2) As an equimolar amount of CaF2 increasingly replaces CaO in the slag, the Al–O0 and Q0 structures prevalences decrease, while the Al–F–Al and Q2 structures prevalences increase. The energy required to break the network bonds increases, and the crystallization properties are inhibited.
(3) With the increase in the amount of CaF2 replacing CaO, the precipitation of specimens changes from Ca2SiO4 to Ca2Al2SiO7. This phenomenon is also confirmed by the change in the microstructure via the Raman spectral experiment. CaF2 precipitates and Ca2Al2SiO7 or Ca2SiO4 remains stable at low temperatures.