3. Results and Discussion
3.1. Effect of the FeSO4 Concentration on the Composition and Current Efficiency of the Deposited Alloy
Figure 1 shows the Ni content in the Fe–Ni alloys deposited at various current densities from the solutions containing FeSO4 at different concentrations. The broken line in the figure shows the composition reference line (CRL) of Ni, which means that the Ni content in the solution is identical to that in the deposits. If the Ni content in the deposits is greater than the CRL, normal codeposition occurs, wherein the electrochemically nobler Ni is preferentially deposited over Fe. By contrast, if the Ni content in the deposits is less than the CRL, anomalous codeposition occurs, wherein the less-noble Fe is preferentially deposited over Ni. In all solutions containing FeSO4 at different concentrations, the Ni content in the deposits was greater than the CRL in the low-current-density region of approximately 10 A·m−2, indicating normal codeposition. Meanwhile, the Ni content in the deposits greatly decreases with increasing current density, resulting in a shift toward the anomalous codeposition region. The Ni content in the deposits reaches a minimum value at current densities of 200 to 500 A·m−2 and then increases as the current density further increases. Focusing on the difference in the FeSO4 concentration, as this concentration increases, the curve showing the relationship between the Ni content in the deposits and the current density shifts toward a lower current density in the low-current-density region of 10 to 100 A·m−2, whereas it shifts toward a higher current density in the high-current-density region above 1000 A·m−2. In the current density region of 200 to 500 A·m−2, the change in the Ni content in the deposits as a function of current density becomes small with increasing FeSO4 concentration.

Figure 2 shows the current efficiency for Fe–Ni alloy deposition at various current densities from the solutions containing FeSO4 at different concentrations. In all of these solutions, the current efficiency for Fe–Ni alloy deposition increases with the current density, reaches a constant value at 2000 A·m−2. The current efficiency is higher in the higher concentration solution than that in the lower-concentration solution in the current density region of less than 1000 A·m−2. In a solution containing 0.507 mol·dm−3 of FeSO4, the current efficiency decreases once at 200 A·m−2, where the Ni content in the deposits reaches a minimum, as shown in Fig. 1.

The total polarization curve and the partial polarization curves for Fe and Ni deposition and hydrogen evolution in Fe–Ni alloy deposition were estimated from the current density dependence of the composition and current efficiency of the Fe–Ni alloy deposition, as shown in Figs. 1 and 2. Figure 3 shows a schematic diagram of the correspondence between the current density–alloy composition and the current density–current efficiency curves (b) and the polarization curves for Fe–Ni alloy deposition (a). There are three regions from the viewpoint of the change in the Ni content in the deposits. At total current densities below the total current density at which Fe begins to deposit (iFe), the Ni content in the deposits is high because the electrochemically nobler Ni is preferentially deposited over Fe. However, at total current densities above iFe, the partial current density for Fe deposition increases, and Ni deposition is suppressed by Fe deposition, causing the slope of the partial polarization curve for Ni deposition to be gentler than that of Fe deposition. Therefore, in region I, where the total current density is higher than iFe, Ni deposition is significantly suppressed with the increasing total current density, resulting in a decrease in the Ni content of the deposits. At total current densities above iFe, when the slope of the partial polarization curve for hydrogen evolution is gentler than those of Fe and Ni deposition, the current efficiency for alloy deposition increases with the current density. In region II, where the slope of the partial polarization curve for Ni deposition becomes identical to that of Fe deposition at total current densities above the total current density at which Ni deposition begins to increase rapidly (iNi), the Ni content in the deposits is almost constant. In region III, where the total current density is higher than the total current density at which Fe deposition approaches the diffusion limitation (iLFe), Fe deposition reaches the diffusion limitation of Fe2+ ions, but Ni deposition does not reach the diffusion-limited current density of Ni2+ ions. As a result, the Ni content in the deposits increases with the current density. If the current density increases further and Ni deposition also reaches the diffusion limitation of Ni2+ ions, the Ni content in the deposits should increase to the CRL and become constant. However, in this study, the Ni content in the deposits increases with the current density in the high-current-density region but does not reach the CRL, as shown in Fig. 1, indicating that Ni deposition has not yet reached the diffusion-limited current density of Ni2+ ions. On the other hand, hydrogen evolution seems to reach the diffusion limitation of H+ ions, but hydrogen evolves via the electrolysis of H2O at a less noble potential. As a result, the current efficiency for alloy deposition becomes to be constant with the increasing current density at current densities above iLFe.

Figure 4 shows the total polarization curve and partial polarization curves for Fe and Ni depositions and hydrogen evolution for the Fe–Ni alloy deposition in the solution containing 0.507 mol·dm−3 of FeSO4. At potentials of −0.45 to −0.7 V, the increase in the partial current density for Ni deposition is gentler than that for Fe deposition. However, the partial current density for Ni deposition increases rapidly at approximately −0.7 to −0.77 V. Although Fe deposition approaches the diffusion limitation of Fe2+ ions at approximately −0.77 V, Ni deposition continues to increase at −0.77 to −1.23 V, indicating that Ni deposition does not yet reach the diffusion limitation of Ni2+ ions. Although the Ni content in the deposits increases with the current density in the high-current-density region, as shown in Fig. 1, it does not actually reach the CRL, indicating that the diffusion limitation of Ni2+ ions is attained in the total-current-density region above 5000 A·m−2. As mentioned above, Fe deposition reaches the diffusion-limited current density of Fe2+ ions at a less noble potential than Ni deposition. The slope of the partial polarization curve for hydrogen evolution is gentler than those of Fe and Ni depositions. The feature of the polarization curve mentioned above is identical to the schematic diagram of the total polarization curve and the partial polarization curves for Fe and Ni depositions and hydrogen evolution in Fe–Ni alloy deposition shown in Fig. 3(a).

It is well known that iron-group metals such as Fe, Co, and Ni inherently do not begin to deposit at their equilibrium potential and require an overpotential for deposition.23,24,25,26,27,28) The minimum overpotential required to initiate the deposition of iron-group metal results from the rate-determining step of the multi-step reduction of iron-group metal ions. The series of reactions below have been proposed as the deposition process for iron-group metals.15,16) M and the subscript ad in the reaction formula denote the iron-group metal and adsorption state, respectively.
|
MO
H
+
+
e
-
→MO
H
ad
| (2) |
|
MO
H
ad
+
e
-
=M+O
H
-
.
| (3) |
The deposition of the iron-group metals proceeds through the adsorption intermediate of MOHad, as shown in Eqs. (2)–(3) above. In addition, the reaction in Eq. (2) becomes the rate-determining step, which shows that the adsorption sites for the MOHad intermediate are limited on the cathode. The dissociation constants of FeOH+ and NiOH+ are 5.78 × 10⁻⁸ and 4.50 × 10−5,6) respectively, indicating that the concentration of FeOH+ in the cathode layer is 1000 times higher than that of NiOH+ during deposition. Therefore, during the Fe–Ni alloy deposition, the adsorption sites for NiOHad are deprived by FeOHad. As a result, the reduction of NiOH+ described by Eq. (2) during Fe–Ni alloy deposition is more significantly suppressed than that from a single-component Ni solution. Therefore, Ni deposition is suppressed only in the case of codeposition with Fe, resulting in anomalous codeposition. The increase in the partial current density for Ni deposition is gentler than that for Fe deposition, as shown in Fig. 4, because the reduction of NiOH+ is suppressed by FeOHad. On the other hand, the deposition rate of Ni increases rapidly at approximately −0.7 to −0.77 V (Fig. 4). This rapid increase is attributed to the release of the adsorption sites for NiOHad that had been deprived by FeOHad. This release is due to the decrease in the coverage of FeOHad because the reduction of Fe2+ ions approaches the diffusion limitation of Fe2+, and the rate of reduction from FeOHad to Fe increases. The current efficiency for Fe–Ni alloy deposition decreases once at 200 A·m−2 (Fig. 2) because the suppressive effect of FeOHad on Ni deposition becomes large.
Figure 5 shows the partial polarization curves for Fe deposition (a), Ni deposition (b), and H2 evolution (c) from the Fe–Ni alloy solutions containing FeSO4 at different concentrations. The partial polarization curve for Fe deposition is rarely affected by the FeSO4 concentration at partial current densities less than 100 A·m−2, and the potential at which Fe deposition approaches the diffusion limitation of Fe2+ ions shifts from −0.7 to −0.8 V with the increasing FeSO4 concentration. In other words, it is difficult for Fe deposition to reach the diffusion limitation of Fe2+ ions with the increasing FeSO4 concentration [Fig. 5(a)]. On the other hand, the potential for Ni deposition was polarized with the increasing FeSO4 concentration at low partial current densities of 10 to 100 A·m−2 [Fig. 5(b)]. That is, Ni deposition was increasingly suppressed with the increasing FeSO4 concentration in the low-current-density region. The deposition rate of Ni rapidly increases at −0.77 to −0.88 V and at −0.7 to −0.77 V in the solutions containing 0.296 and 0.507 mol·dm−3 of FeSO4, respectively. The potential for hydrogen evolution was increasingly polarized with the increasing FeSO4 concentration, similar to that for Ni deposition, showing that the hydrogen evolution was more suppressed. Typically, hydrogen does not begin to evolve at the equilibrium potential, similar to the iron-group metals mentioned above, which is attributed to the slow elementary process present in hydrogen evolution.23,29) The elementary process, which is the rate-determining step for hydrogen evolution, is the reduction through the adsorption intermediate Had, and the slow elementary process means that the adsorption sites for Had (i.e., the active sites for hydrogen evolution) are limited. Therefore, the potential for hydrogen evolution is polarized by foreign substances (i.e., the suppressive agents for hydrogen evolution), which preferentially adsorb onto the adsorption sites for Had, thereby decreasing the number of available sites. In this study, FeOHad seems to suppress hydrogen evolution, and this suppressive effect increases with the FeSO4 concentration. The current efficiency for Fe–Ni alloy deposition is higher in a solution containing a higher concentration of FeSO4 in the current density region below 1000 A·m−2, as shown in Fig. 2, because the suppressive effect on the hydrogen evolution increases with the FeSO4 concentration.

The effects of FeSO4 concentration on the current density dependence of the composition and current efficiency of Fe–Ni alloy deposition were investigated from the shape of the total polarization curve and the three partial polarization curves. Figure 6 shows a schematic diagram of the changes in the polarization curves for the Fe–Ni alloy deposition (a) and current density–alloy composition and current density–current efficiency curves (b) with the increasing Fe2+ ion concentration. In the low-current-density region of iFe to iNi, since Ni deposition is increasingly suppressed with the increasing FeSO4 concentration, the curve of the Ni content in the deposits as a function of current density shifts toward a lower current density. On the other hand, with the increasing FeSO4 concentration, the total current density iLFe at which Fe deposition approaches the diffusion limitation of Fe2+ ions increases to iLFe’. As a result, this curve in the high-current-density region above iLFe shifts toward a higher current density. That is, the current density at which the Ni content in the deposits begins to increase with the current density increases. As mentioned above, region II, in which the Ni content in the deposits becomes almost constant, broadens with the increasing FeSO4 concentration. If the electrolysis conditions are fixed to obtain the Fe–36mass%Ni alloy in region II, the invar alloy can be produced in a wider current density region. On the other hand, with the increasing FeSO4 concentration, the partial polarization curve for hydrogen evolution is polarized, thus increasing the current efficiency for Fe–Ni alloy deposition.

Figure 7 shows the Ni content in Fe–Ni alloys deposited at various current densities from solutions of different pH values. In this experiment, the current density was fixed at 100 to 1000 A·m−2 to focus on region II, in which the Ni content in the deposits becomes almost constant. In all solutions, the Ni content in the deposits decreases with increasing current density in the low-current-density region. Specifically, at low current densities of 100 to 200 A·m−2, the Ni content in the deposits decreases with increasing pH. In a solution of pH 3.0, the Ni content in the deposits reaches a minimum at 200 A·m−2 and increases as the current density further increases, whereas in a solution of pH 1.5, the Ni content in the deposits is constant at 700 to 1000 A·m−2, showing no increase in the Ni content. In a solution of pH 2.4, the Ni content in the deposits is almost constant at 300 to 600 A·m−2 and somewhat increases as the current density further increases. That is, regions I, II, and III, depicted in Fig. 3, are present for solutions of pH 2.4 and 3.0, and only regions I and II are observed for a solution of pH 1.5. At a high-current-density of 1000 A·m−2, the Ni content in the deposits increases with increasing pH, showing the opposite trend to that of low current densities of 100 to 200 A·m−2.

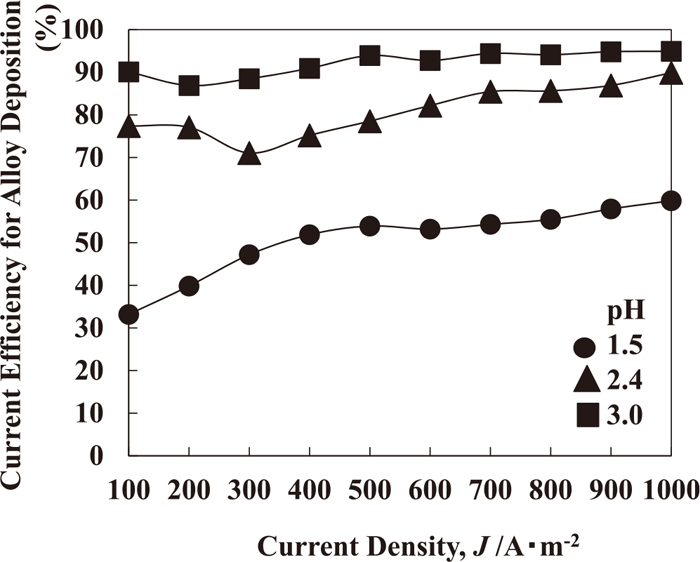
Figure 8 shows the current efficiency for the Fe–Ni alloy deposited at various current densities from solutions of different pH values. The current efficiency for the alloy deposition increases with the current density in all of the various pH solutions. In addition, the current efficiency increases with pH at all current densities.
Figure 9 shows the partial polarization curves for Fe deposition (a), Ni deposition (b), and H2 evolution (c) from the Fe–Ni alloy solutions of different pH values. The partial polarization curves for Fe and Ni deposition shift slightly in the noble potential direction with the decreasing pH to 1.5. However, the partial polarization curves at pH 2.4 and 3.0 are hardly different. By contrast, the partial polarization for hydrogen evolution significantly changes depending on pH. Specifically, the partial polarization for hydrogen evolution shifts toward a higher current density with the decreasing pH.

The effect of the solution pH on the current density dependence of the composition and current efficiency of Fe–Ni alloy deposition was also examined from the shape of the total polarization curve and partial polarization curves. Figure 10 shows a schematic diagram of the changes in the polarization curves for Fe–Ni alloy deposition (a) and current density–alloy composition and current density–current efficiency curves (b) with decreasing pH. The partial polarization curves of Fe and Ni in Fe–Ni alloy deposition change slightly depending on the pH, but the degree of change is significantly smaller than that of the partial polarization curves for hydrogen evolution (Fig. 9). Therefore, in the schematic diagram of the polarization curve for Fe–Ni alloy deposition shown in Fig. 10(a), only the partial polarization curve for hydrogen evolution and the total polarization curve are expected to change in the direction indicated by the arrow in this figure with decreasing pH. Since the total current density iFe at which Fe begins to deposit increases to iFe’ with decreasing pH, the current density at which the Ni content in the deposits begins to decrease shifts toward a higher current density. Since the total current density iLFe at which Fe deposition reaches the diffusion limitation of Fe2+ ions increases to iLFe’ with decreasing pH, the current density at which the Ni content in the deposits begins to increase shifts toward a higher current density. In other words, the curve of the Ni content in the deposits as a function of current density shifts toward a higher current density with decreasing pH. Therefore, with decreasing pH, the Ni content in the deposits increases at a low current density of 100 to 200 A·m−2, and it decreases at a high-current-density of 1000 A·m−2 (Fig. 7). On the other hand, with decreasing pH, the current efficiency for Fe–Ni alloy deposition decreases over the entire current density region because the partial polarization curve for hydrogen evolution shifts toward a higher current density.

Figure 11 shows the Ni content in Fe–Ni alloys deposited at various current densities from the solutions at different temperatures. In the solutions at all temperatures, the Ni content in the deposits decreases with increasing current density in the low-current-density region. The Ni content in the deposits increases with temperature at a current density of 100 to 400 A·m−2. In the solutions at all temperatures, the Ni content in the deposits reaches a minimum and then increases as the current density is further increased. At a current density of 700 to 1000 A·m−2, the Ni content in the deposits was almost identical, regardless of temperature.

Figure 12 shows the current efficiency for Fe–Ni alloy deposition at various current densities from the solutions at different temperatures. In the solutions at all temperatures, the current efficiency for Fe–Ni alloy deposition gradually increases with the current density as a whole. The current efficiency decreases with an increase in temperature in the high-current-density region above 500 A·m−2, whereas it increases with temperature at low current densities below 400 A·m−2. The current efficiency in the solutions at 40°C, 50°C, and 60°C decreases once at 200, 300, and 500 A·m−2, respectively. At these current densities, the Ni content in the deposits decreases toward a minimum value (Fig. 11), which suggests that the suppressive effect of FeOHad on the Ni deposition reaches a maximum, thus decreasing the current efficiency.

Figure 13 shows the partial polarization curves for Fe deposition (a), Ni deposition (b), and H2 evolution (c) from the Fe–Ni alloy solutions at different temperatures. All partial polarization curves shift toward less noble potentials with decreasing temperature. In particular, in Ni deposition, the degree of polarization increases with decreasing temperature in the region of low partial current density below 50 A·m−2 [Fig. 13(b)]. In other words, the suppressive effect of FeOHad on the Ni deposition in the low-current-density region increases with decreasing temperature. The partial current density for hydrogen evolution significantly decreases with decreasing temperature under the condition of a high total current density.

Figure 14 shows a schematic diagram of the changes in the polarization curves for Fe–Ni alloy deposition (a) and the current density–alloy composition and current density–current efficiency curves (b) with decreasing temperature. The relationship between the current density, alloy composition, and current efficiency shown in Fig. 14(b) depends on the relative change in each partial polarization curve. When the changes in all three polarization curves with decreasing temperature (Fig. 13) are identical to each other, the effect of temperature on the current efficiency and the Ni content in the deposits is canceled. As a result, the current density–alloy composition and current density–current efficiency relationships do not change. Therefore, the relative changes in the polarization curves for Fe and Ni deposition and hydrogen evolution are important. In this study, a relatively large change in the polarization curves for Fe and Ni deposition and hydrogen evolution is reflected in the schematic diagram. As shown in Fig. 13, all the Fe and Ni depositions and hydrogen evolution are affected by the temperature, but with decreasing temperature, both the polarization of Ni deposition in the low-current-density region and the decrease in the partial current density for hydrogen evolution in the high-current-density region are remarkable. Thus, Fe deposition was assumed to be constant in Fig. 14. With decreasing temperature, since Ni deposition is more suppressed in the low-current-density region of iFe to iNi’, the curve of the Ni content in the deposits as a function of current density shifts toward a lower current density. With decreasing temperature, the current efficiency increases in the high-current-density region because of the decrease in the partial current density for hydrogen evolution, and it decreases in the low-current-density region because the suppressive effect on the Ni deposition prevails.
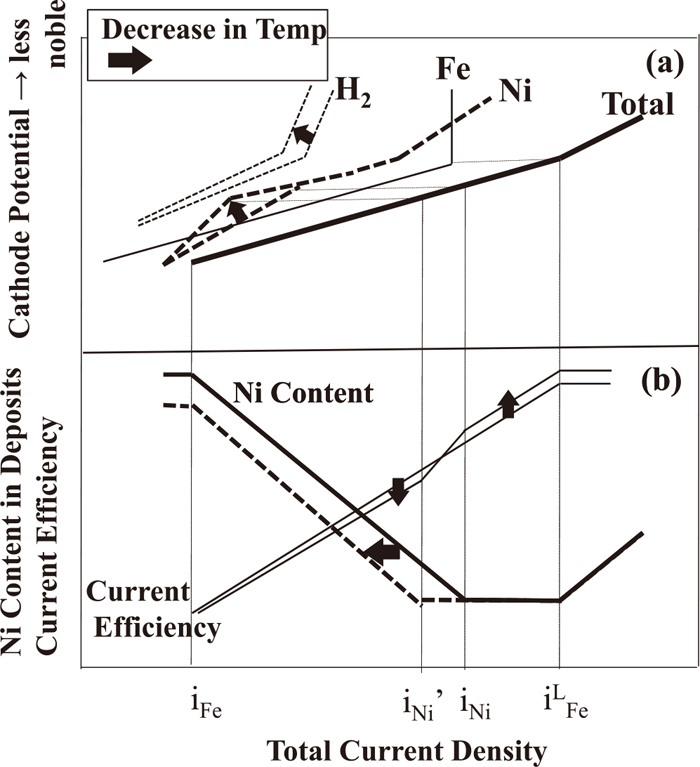
Figure 15 shows the Ni content in the Fe–Ni alloys deposited at various current densities from stirred and unstirred solutions. The Ni content in the deposits decreases with an increase in the current density in the low-current-density region, regardless of the stirring. In a solution with stirring, the Ni content in the deposits reaches a minimum at 300 to 600 A·m−2 and increases at current densities above 600 A·m−2. Meanwhile, in the solution without stirring, the Ni content in the deposits reaches a minimum at 200 A·m−2 and increases with the current density above 200 A·m−2. In the stirred solution, region II shown in Fig. 3, in which the Ni content in the deposits becomes constant, becomes wider, and the current density iLFe at which the Ni content in the deposits begins to increase is increased.

Figure 16 shows the current efficiency for Fe–Ni alloy deposition at various current densities from the solutions with and without stirring. Both with and without stirring, the current efficiency for Fe–Ni alloy deposition generally increases with current densitiy. However, the current efficiency from a solution with stirring is lower than that from a solution without stirring.

Figure 17 shows the partial polarization curves for Fe deposition (a), Ni deposition (b), and H2 evolution (c) from the Fe–Ni alloy solutions with and without stirring. The partial polarization curves for Fe deposition (a) with and without stirring rarely change, but the potentials at which Fe deposition reaches the diffusion-limiting current of Fe2+ ions are −0.78 and −0.75 V with and without stirring, respectively, indicating that reaching the diffusion limitation of Fe2+ ions is difficult with stirring. In the partial polarization curve for Ni deposition (b), the current density increases rapidly at approximately −0.73 V without stirring, whereas it increases rapidly at approximately −0.77 V with stirring. As a result, the polarization for Ni deposition at partial current densities above 100 A·m−2 is higher with stirring than without stirring. These rapid increases in the Ni deposition rate at approximately −0.73 V without stirring and −0.77 V with stirring are attributed to the fact that the adsorption sites for NiOHad deprived by FeOHad are released as the system approaches the diffusion limitation of Fe2+ ions during Fe deposition, as mentioned above. With stirring, however, reaching the diffusion limitation of Fe2+ ions is more difficult; thus, the adsorption sites for NiOHad are released less easily, resulting in an increase in the polarization for Ni deposition. On the other hand, the partial polarization curve for hydrogen evolution (c) shifts toward a noble potential with stirring in the partial-current-density region below 100 A·m−2, which seems to be caused by the accelerated diffusion of H+ ions with stirring.

Figure 18 shows a schematic diagram of the changes in the polarization curves for Fe–Ni alloy deposition (a) and current density–alloy composition and current density–current efficiency curves (b) with stirring. The total current density iLFe at which Fe deposition reaches the diffusion limitation of Fe2+ ions increases to iLFe’ when the solution is stirred. Therefore, the curve of the Ni content in the deposits as a function of current density in the high-current-density region shifts toward a higher current density with stirring. That is, the current density at which the Ni content in the deposits begins to increase in the high-current-density region is increased by stirring. As a result, region II, in which the Ni content in the deposits becomes almost constant, becomes wider with stirring. On the other hand, the current efficiency for Fe–Ni alloy deposition decreases with stirring in all current density regions because the partial polarization curve for hydrogen evolution shifts toward a noble potential. The polarization for Ni deposition by FeOHad is higher with stirring [Fig. 17(b)], which is one of the causes of the decrease in the current efficiency.

In this study, the malonic acid is added in the electrolysis solution. Although the malonic acid seems to affect the deposition behavior of Fe–Ni alloy due to its pH buffer action and the formation of complexes with Fe2+ and Ni2+ ions, the detail is unknown, and further investigation is required.