Abstract
Molten oxides have been used for a range of processes; however, their physical and rheological properties affect the quality of products manufactured from them. Although various reports of structural analysis exist, the methods employed are typically time consuming. Herein, a method is established for rapidly estimating the structures of melts by combining impedance measurements and thermodynamic calculations regarding the cell model. The melt structure is calculated using two thermodynamic parameters; however, these parameters have not yet been reported for systems containing alkali metal oxides. Thus, impedance measurements were carried out for SiO2–Al2O3–RO melt systems (R = Ca or Mg), and relationships between the equivalent circuit components and the thermodynamic parameters of the cell model were established. The structures of melts containing alkali metal oxides were then estimated by calculating the thermodynamic parameters of these systems by substituting the equivalent circuit components in the correlation equations. The structures estimated by the proposed method appear to correlate with those measured by NMR spectroscopy.
1. Introduction
Molten oxides such as silicate melts are used in various fields, including metal manufacturing1) and radioactive waste treatment.2) However, the rheological properties of the melt affect the quality of the manufactured products; moreover, the physical properties of the melt—such as the viscosity,3,4,5) thermal conductivity,6,7) density,8,9,10) and surface tension11,12)—are affected by its chemical composition, crystallization, and structure. Numerous studies into the physical and structural properties of melts have therefore been carried out. Currently, structural analyses are performed by Raman spectroscopy13,14) and/or nuclear magnetic resonance (NMR) spectroscopy;15,16) however, structural analyses by NMR spectroscopy can be particularly time consuming depending on the required conditions (such as relaxation time). The development of a method that can rapidly analyze the structural properties of a melt is therefore highly desirable.
In the present study, melt crystallization was detected by the electrical capacitance measurement method applied by Ohta et al.17) to detect the crystallization of glasses above the glass transition temperature. This method has been used to analyze the effects of agitation (by stirring using a rotating electrode) on the crystallization behavior of silicate melts; it was found that agitation accelerates the crystallization process and changes the morphology of the crystalline phase.18,19,20) Furthermore, by considering the geometrical shape of the electrode, the theoretical solid volume fraction of a melt (i.e., the crystallinity) can be estimated from the capacitance values of a uniform melt (100% liquid) and a crystalline phase (100% solid).21) From these studies, it is clear that the electrical capacitance of the homogeneous melt differs depending on the composition. In CaO–SiO2 melts, the electrical capacitance can be increased by adding an alkali metal oxide (e.g., Li2O, Na2O, or K2O), wherein the extent of the increase is related to the ionic radius of the alkali metal. Notably, the addition of CaF2 remarkably increases the electrical capacitance.18,19) Based on these results, it is thought that electrical capacitance is influenced by the melt structure; moreover, the melt structure could be estimated by measuring and analyzing the electrical properties obtained under an alternating current field.
In the present work, the melt structure is estimated by measuring the impedance value of the melt, which is a more primitive parameter than electrical capacitance. To estimate the structure by impedance measurements, a thermodynamic model was employed. Specifically, the cell model proposed by Kapoor and Frohberg22) was used. This model is suitable for calculating the number of “cells” (comprising two cations and an oxygen ion) in a system by considering the mass and thermodynamic balance of each cell. This cell model has been applied to complex multi-phase slag systems by Gaye and Welfringer23) after modification; however, the thermodynamic parameters required to calculate the number of cells in systems containing alkali metal oxides have yet to be reported. As such, only a few compositions can be calculated using the cell model. Although molten oxides used in many processes often contain alkali metal oxide, their structures cannot currently be estimated by cell model calculations. Furthermore, the behavior of amphoteric Al2O3, such as the coordination number of oxygen ions in the melt, has not been completely revealed. The complex behavior of molten Al2O3 is not fully considered in the conventional thermodynamic model; this could be a key factor in the reduced accuracy of structural evaluations of systems containing Al2O3. Thus, to improve the accuracy of structural evaluations using the thermodynamic model, the behavior of Al2O3 (particularly four-coordinated Al2O3, which acts as a network former (NWF)) was examined herein. The thermodynamic parameters were calculated with consideration to the structural characteristics of Al2O3.
The purpose of this study is to evaluate melt structures in terms of the ratio of bridging oxygen (BO) and non-bridging oxygen (NBO) species present in Al2O3 to give more accurate evaluations than those using conventional thermodynamic parameters. Thus, the impedance values of SiO2–Al2O3–RO melt systems (R = Mg or Ca) were measured, and the required thermodynamic parameters of these systems were obtained from the literature.23) Following the impedance measurements, equations describing the correlations between the impedance spectroscopy measurement results24,25) and thermodynamic parameters were established. The thermodynamic parameters could be estimated from the correlation equation and the impedance measurements. Structural analyses utilizing the cell model were then performed using the estimated thermodynamic parameters. Furthermore, basic data accumulation was carried out for structural analysis, including the ratio of four-coordinated and six-coordinated Al2O3 species present in the melt.
2. Experimental
2.1. Impedance Measurements
The compositions of the SiO2–Al2O3–RO systems (R = Mg or Ca) employed in this study are listed in Table 1. Powders of SiO2, Al2O3, and CaCO3 or MgO (99.9%, Sigma-Aldrich, Japan) were thoroughly mixed to produce the required compositions, and the mixtures were pre-melted in a Pt crucible at 1873 K under air prior to quenching on a copper plate to obtain the sample glasses.
Table 1. Initial compositions (mol%) of samples for impedance measurements.
| No. | SiO2 | Al2O3 | CaO | MgO |
|---|
| 1 | 55.0 | 15.0 | 30.0 | |
| 2 | 51.0 | 12.5 | 36.5 | |
| 3 | 36.0 | 9.9 | 54.1 | |
| 4 | 39.5 | 9.5 | 51.0 | |
| 5 | 60.1 | 9.8 | 30.1 | |
| 6 | 51.0 | 12.5 | | 36.5 |
| 7 | 50.0 | 10.0 | | 40.0 |
| 8 | 50.0 | 15.0 | | 35.0 |
| 9 | 50.0 | 25.0 | | 25.0 |
| 10 | 55.0 | 6.0 | | 39.0 |
Figure 1 shows a schematic representation of the impedance measurement system; details regarding the electrical furnace can be found elsewhere.18) The impedance and phase angle shift were measured using an impedance analyzer (IM3570, Hioki E. E. Co., Japan) by the two-terminal method. A crucible filled with the prepared glass sample was placed in a furnace and heated to 1873 K under air for 120 min to produce a homogenous bubble-free melt, after which a rod was immersed in the melt to a depth of 10 mm. The crucible and rod were both composed of a Pt–20 Rh (mass%) alloy, and served as the electrodes for the impedance measurements by connecting them to the impedance analyzer with Pt wires. Thus, an alternating circuit of cylindrical electrodes was formed between the crucible wall and the rod, allowing the impedance and phase angle shift of the melt to be measured. The applied potential was 1.0 V, and the frequency range was 50 Hz to 150 kHz.

A Nyquist plot showing the imaginary impedance (Z″ = – |Z| sinθ) as a function of real impedance (Z′ = |Z| cosθ), where Z and θ are the impedance and phase angle shift, respectively, is shown in Fig. 2. The higher frequency appears closer to the origin. Typical Nyquist plots that consist of a straight line and semicircle can be represented as an equivalent circuit, as shown in the inset of Fig. 2. The point at which the left-hand side of the semicircle (i.e., the higher-frequency side) intersects the horizontal axis indicates the solution resistance, Rsol (i.e., the electrical resistance of the entire melt), and the diameter of the semicircle indicates the charge transfer resistance (Rct) at the surface of the electrode and the electrical double layer. The semicircle and straight line respectively depend on the capacitance of the electrical double layer (Cdl) at the surface of the electrode, and the impedance of diffusion, Zw. An equivalent circuit was analyzed by fitting the Nyquist plot using EIS Spectrum Analyzer software,26,27) and the optimized equivalent circuit components were calculated using Eq. (1):
|
Z=
R
sol
+
1
jω
C
dl
+1/(
R
ct
+
Z
w
)
| (1) |
where
j and
ω are the imaginary unit and angular frequency, respectively. The imaginary unit was used to decompose the real and imaginary parts of the impedance, and
ω was calculated from the results of impedance measurements. The relationship between the obtained components of the equivalent circuit and the melt structures was considered.
2.2. Structural Analysis Using the Thermodynamic Model
2.2.1. Introduction of the Cell Model
In the cell model modified by Gaye and Welfringer,23) the number of cells is calculated by two thermodynamic parameters: (1) W, the free energy of formation of the asymmetric cell (Mi–O–Mj, see Eq. (2)); and (2) E, the free energy of electrical or physical interactions between each cell. These parameters and mass balance are used to calculate the number of cells. In calculating the number of cells, the reaction of formation of asymmetric cells (comprising an oxygen ion and two different cations) from symmetric cells (comprising an oxygen ion and two identical cations) is considered, as given in Eq. (2).
|
1
2
(
M
i
-O-
M
i
)+
1
2
(
M
j
-O-
M
j
)=(
M
i
-O-
M
j
)
| (2) |
where M
i and M
j are cations. However, the cell formation and cell interaction energies necessary for calculating the number of cells have only been determined for a few compositions (SiO
2, Al
2O
3, CaO, MgO, FeO, Fe
2O
3, and MnO systems), including the compositions shown in
Table 1. Therefore, the cell model has a fundamental problem in that it is difficult to apply to various compositions.
2.2.2. Correlation Equations between Equivalent Circuit Components and Thermodynamic Parameters
Each equivalent circuit consists of four components (Rsol, Rct, Cdl, and Zw) regardless of the melt composition. Rct and Cdl arise from the phenomena in the double layer, which is a particularly thin layer; therefore, these two components are affected by microstructures such as cells. In contrast, in the case of the SiO2–Al2O3–RO ternary system employed herein, the thermodynamic parameters of the cell model (W and E) are given by considering the formation of asymmetric cells; thus, due to the number of potential cell combinations, six thermodynamic parameters exist (i.e., WSi–Al, WSi–Ca, WAl–Ca, ESi–Al, ESi–Ca, and EAl–Ca). The subscripts represent the cations connected to the oxide ion in each type of cell, so WSi–Al represents the formation energy of the cell consisting of Si, Al, and O ions, while ESi–Al represents the interaction energy of the same cell. To represent these six thermodynamic parameters with two equivalent circuit components, a large amount of data is required. Due to the challenges associated with collecting such data, the melt system was assumed to be a binary system of oxides comprising a network former (NWF) and network modifier (NWM). This “quasi-binary system” can be considered using only two thermodynamic parameters, namely WNWF–NWM and ENWF–NWM. For simplicity, these parameters are hereafter expressed as W and E, respectively. The parameters W and E were calculated by solving the following Eqs. (3), (4), (5) simultaneously:
|
G
M
(ternary)=
G
M
(binary)
| (3) |
|
P=
R
NWF-NWM
(
R
NWF-NWF
⋅
R
NWM-NWM
)
1/2
| (4) |
|
α=
v
j
X
j
v
i
X
i
+
v
j
X
j
⋅
1
RT
, β=
1
RT
| (5’) |
where
GM(ternary) and
GM(binary) are the mixing free energy of the ternary (SiO
2–Al
2O
3–RO) and binary (NWF–NWM) systems calculated by the cell model, respectively;
P is a partition function in the cell model;
α and
β are coefficients; and
RNWF–NWF,
RNWM–NWM, and
RNWF–NWM are the numbers of cells with connected cations of NWF–NWF, NWM–NWM, and NWF–NWM, respectively. These equations are based on a number of assumptions. First,
Eq. (3) assumes that the free energy of the ternary system and the quasi-binary system are identical, since these systems have the same composition despite being expressed differently.
Equations (4) and
(5) are based on the partition law in the cell model. They are suitable for a binary system (or quasi-binary system, such as the case herein), but are applicable only if the composition of system and the number of cells are known. For the SiO
2–Al
2O
3–RO system, the composition and number of cells can be determined, and further details regarding these equations and parameters can be found in literature.
23) Although the binary and ternary systems are expressed differently, the kind and number of elements present in the ternary system melt are considered identical to those in the quasi-binary system. As such, the total of number of cells in each system should be the same, since the number of cells was calculated by the same mass balance.
GM(ternary) can be calculated from the composition of the SiO
2–Al
2O
3–RO system, and
GM(binary) is a linear function of
W and
E.
Equation (4) can be solved using
Ri–j, which can be obtained from the calculated number of cells of the SiO
2–Al
2O
3–RO ternary system, and
P can be calculated from
Eq. (5). Thus,
W and
E can be calculated by solving
Eqs. (3),
(4),
(5). In other words, the mixing free energy and partition coefficient in the quasi-binary system become equal to those in the ternary system when the number of cells in the quasi-binary system is estimated. In
Eq. (5’),
vi is the stoichiometry coefficient of oxygen in the (M
i)
uiO
vi oxide; for example,
vi = 2 for SiO
2 and
vi = 1 for Na
2O or CaO.
Xi is the mole fraction of oxide
i, and
R and
T are the gas constant and absolute temperature, respectively.
α and
β are coefficients, where
α is dependent on the elements present in the system, the mole fraction of the composition, and temperature; while
β depends on temperature alone. Thus, coefficients
α and
β determine the impact of
W and
E on the partition coefficient.
By performing impedance measurements with the compositions given by the thermodynamic parameters of the ternary system, and by establishing correlation equations between the equivalent circuit components and thermodynamic parameters of the ternary system, the thermodynamic parameters of the quasi-binary system can be obtained simply from the equivalent circuit components for various compositions. For the ternary systems listed in Table 1, the thermodynamic parameters can be calculated from literature; thus, such correlation equations could be prepared for these compositions.
3. Results and Discussion
3.1. Impedance Measurements
Figure 3 shows Nyquist plots of the various compositions examined herein. All of the Nyquist plots consisted of a straight line and a semicircle, similar to the example shown in Fig. 2. Equivalent analyses of these Nyquist plots revealed that they were able to reproduce the equivalent circuit shown in the inset of Fig. 2. The component values of these equivalent circuits can be obtained simultaneously; the values are given in Table 2.
Table 2. Estimated parameters of the equivalent circuit obtained by fitting method for the compositions used in this study.
| No. | Rsol [Ω] | Rct [Ω] | Cdl [μF] | Zw [Ω] |
|---|
| 1 | 10.5 | 198 | 0.0991 | 1052 |
| 2 | 7.07 | 60.7 | 0.177 | 352 |
| 3 | 5.97 | 2.28 | 0.834 | 69.4 |
| 4 | 5.54 | 11.1 | 0.376 | 136 |
| 5 | 46.2 | 158 | 0.0195 | 1152 |
| 6 | 7.89 | 4.90 | 0.209 | 129 |
| 7 | 6.77 | 8.76 | 0.236 | 250 |
| 8 | 9.27 | 1.97 | 0.457 | 47.0 |
| 9 | 10.9 | 1.60 | 0.753 | 50.0 |
| 10 | 10.3 | 17.8 | 0.112 | 389 |
In a previous study into the structural analysis of aluminosilicate melts by NMR spectroscopy, there was no significant difference in the structures (such as the concentration of NBO species) of 44.7SiO2–12.6Al2O3–31.9CaO–10.8Na2O and 44.2SiO2–13.4Al2O3–31.6CaO–10.8K2O (mol%), although a minor difference in the oxygen coordination number was observed due to the difference in alkali metal oxides.16) The structures of the 51.0SiO2–12.5Al2O3–36.5RO (R = Mg or Ca) systems examined herein are therefore expected to be similar, i.e., these structures will have similar values of NBO/T and amount of AlO4. NBO/T is the number of NBO per SiO44- unit. The influence of the alkaline earth metal oxide additions on the equivalent circuit components can therefore be discussed. Although the impedances of SiO2–R2O (R = Li, Na or K) systems have been measured previously,28) the compositions examined herein also contain Al2O3, so that the influence of Al2O3 on the equivalent circuit components can be considered. In the current melt systems, Al2O3 is considered to exist as a four-coordinated AlO4 species acting as a NWF, since the amount of Al2O3 is smaller than the amount of RO.29) The charge given by Al3+ in the AlO4 tetrahedron per oxygen is +3/4, whereas the charge given by Si4+ in the SiO4 tetrahedron per oxygen is +4/4. Therefore, when Al2O3 exists as AlO4, electric neutrality is achieved when compensated with a charge of +1/4 from the alkaline earth metal cation. Such charge compensation is easier as the cationic field strength (CFS) of the charge compensation ion decreases.30) The CFS can be expressed by Eq. (6).
where
Z and
r are the valence and ionic radii, respectively. The CFSs of Mg
2+ and Ca
2+ are 3.86 and 2.00, respectively. The smaller CFS of Ca
2+ allows it to act more efficiently as a charge compensation cation.
31) A recent study found that in alkali and alkaline earth aluminosilicate glasses, the charge-compensated cation has a higher ionic conductivity than the NWM cation.
32) This can affect the ionic conductivity or resistivity of a melt,
31) since the cations that act as NWMs are bound to NBOs with a charge of −1, as previously described, whereas the charge compensation cations are bound to the AlO
4 tetrahedra with a charge of −0.25. As a result, the resistance of the charge compensation cations decreases because its electric attractive force is smaller than that of the NWM cation. Furthermore, the solution resistance of the system containing CaO was smaller than that of the system containing MgO (
Rsol = 7.07 vs. 7.89), thereby indicating that
Rsol decreased with increasing ionic radius
33) of the alkaline earth metal. Thus, Ca
2+ has a higher ionic conductivity and can act more easily as a charge compensation cation than Mg
2+. Upon increasing the ionic radius of the alkaline earth metal, the charge transfer resistance increases, whereas the double layer capacitance decreases. These two equivalent circuit components show a similar tendency for the binary alkali silicate melt, and are considered to vary due to changes in double layer thickness and interface polarization caused by the different ionic radii.
28)
3.2. Results of Applying the Cell Model
3.2.1. Relationship between the Thermodynamic Parameters and the Equivalent Circuit Components
The objective of this study was to estimate the ratio of BO and NBO species in aluminosilicate melts through impedance measurements by applying the cell model to correlate the equivalent circuit components with the melt structures. The correlation equations of the thermodynamic parameters, W and E, and the equivalent circuit components obtained by impedance measurements shown in Table 2 were established. Figure 4 shows the relationship between the cell formation energy and each component of the equivalent circuits of the SiO2–Al2O3–CaO and SiO2–Al2O3–MgO systems, with the Spearman’s rank correlation coefficient, ρ, and Pearson’s correlation coefficient, R2.

Spearman’s rank correlation coefficient is given by Eq. (7). It expresses the extent to which the relationship between two variables can be represented by an arbitrary monotonic function when the two variables do not assume any distribution. The value of ρ may range from −1 to +1. Using Spearman’s rank correlation coefficient, the presence or absence of a correlation between two variables can be determined.
|
ρ=1-
6
n(
n
2
-1)
∑
i=1
n
(
X
i
-
Y
i
)
2
| (7) |
where
n is the number of data points, and
Xi and
Yi are the orders of a variable.
Pearson’s correlation coefficient is given by Eq. (8). It expresses the fitting of the regression equation (i.e., the correlation equation), assuming that the variable follows a normal distribution. The R2 value may range from 0 to 1; the closer the value to 1, the better the fit of the correlation equation. Pearson’s correlation coefficient is used to judge the validity of an established correlation equation.
|
R
2
=
{
∑
i=1
n
(
x
i
-
x
¯
)(
y
i
-
y
¯
)
}
2
∑
i=1
n
(
x
i
-
x
¯
)
2
⋅
∑
i=1
n
(
y
i
-
y
¯
)
2
| (8) |
where
n is the number of data points,
xi and
yi are variables, and
x and
y are the arithmetic means
xi and
yi, respectively.
In almost all relationships outlined in Fig. 4, ρ was ≥ 0.8. This indicates that there is a correlation between the cell formation energy and each equivalent circuit component. In particular, for both SiO2–Al2O3–MgO and SiO2–Al2O3–CaO, the ρ values demonstrated that the ρ values for the relationship between the cell formation energy (W) and the charge transfer resistance (Rct) was 1.0, which indicates a strong correlation compared with other equivalent circuit components (see Fig. 4(b)). Furthermore, R2 was ≥ 0.9, indicating that the correlation equations were relatively accurate. As shown in Fig. 4(b), W decreased upon increasing Rct. In a previous study, Rct tended to decrease with increasing NBO in the melt.28) In this study, W is the free energy of formation of a cell in which bonded heterogeneous cations are generated from cells in which cations of the same kind are bonded to one another. The melt systems were assumed to be oxides of NWF and NWM, and so the oxygen atoms in cells bonded to heterogeneous cations are NBO species when considering the NWM cation. It can therefore be considered that W can easily generate cells with NBO coupling. Therefore, when the amount of NBO in the melt decreases and Rct increases, NBO cells are less likely to form in the melt; hence, it is considered that such a relationship between W and Rct can be obtained; moreover, the magnitude of this relationship should be reasonable.
Figure 5 shows the relationship between the cell interaction energy (E) and each component of the equivalent circuit, with the Spearman’s rank correlation coefficient and Pearson’s correlation coefficient values. For almost all relationships shown in Fig. 5, the values of Spearman’s rank correlation coefficient were ≥ 0.9, indicating a correlation between E and each equivalent circuit component. Although details regarding the cell interaction energy were not mentioned in a previous paper by Gaye et al.,23) the electrical interaction of each cell affects E because many ions exist in the molten oxide melt. In this case, the polarization of ions in the melt contributes to the double layer capacitance (Cdl), which increases with increasing polarization.28) Therefore, the correlation between E and Cdl was considered in this study. As shown in Fig. 5(c), the E increased with an increase Cdl. It is thought that the increase in ion polarization in the melt contributed to the increases in Cdl and E. In addition, it was considered that the magnitude of the relationship between E and Cdl would be reasonable.

Correlation equations were reproduced for the two systems (SiO2–Al2O3–CaO and SiO2–Al2O3–MgO), as shown in Figs. 4(b) and 5(c). To estimate the melt structures present in various systems, it is desirable to represent each of these with a correlation equation. Thus, Rct and Cdl were subsequently corrected to consider the effects of each system.
3.2.2. Correcting the Equivalent Circuit Components and Estimating the Melt Structures
In an aqueous solution system at room temperature, Rct can be expressed by Eq. (9),34) where Cs is the electrolyte concentration and γ is a coefficient.
The parameter corresponding to electrolyte concentration in the present study is considered to be the concentration of an alkaline earth metal oxide that can move relatively freely in the melt. In this case, it is reasonable to consider that the concentration of the alkaline earth metal oxide in the melt should be represented by its activity.
Rct was therefore corrected by multiplying with the activity of the alkaline earth metal oxide,
aRO, since
Rct is inversely proportional to its activity.
Rct was therefore corrected as follows:
|
R
ct
′
=
R
ct
⋅
a
RO
| (10) |
Here, the activity of the alkaline earth metal oxide was calculated by using the “Fact oxide database” from FactSage;
35) the calculated activities are therefore reliable values. The effect of the difference in activity by the alkaline earth metal oxide could be ignored in
Eq. (10), which suggests that the relationship between
W and
Rct′ could be expressed by a single correlation equation.
Figure 6 shows the relationship between the
Rct′ and
W. As expected, the relationship between
W and
Rct′ for the SiO
2–Al
2O
3–CaO and SiO
2–Al
2O
3–MgO systems could be expressed by a correlation equation. According to
Eq. (9), when
Rct was corrected with a mole fraction of RO, the could not be expressed by a single correlation equation (see
Fig. 6). This indicates that the mole fraction of RO in the melt differs from the effective mole fraction (
i.e., the activity), and so it was considered that correction should be performed based on activity rather than mole fraction.
We also note that interfacial polarization is a key factor in contributing to Cdl. Interfacial polarization refers to the phenomena of ion movement (i.e., alkaline earth metal ions in this case) under an external electric field. The interfacial polarization and Cdl were found to increase with increasing distance of ion movement. As described in section 3.1, in aluminosilicate melts, an alkaline earth metal ion with a smaller CFS facilitates charge compensation, and the ion mobility is considered to increase; thus, CFS was used to correct Cdl. To standardize the polarizability magnitude, Cdl was corrected by multiplying by the ratio based on the average CFS value of the alkaline earth metal cations (i.e., Mg and Ca) that can undergo interfacial polarization in the present aluminosilicate melt as follows:
|
C
dl
′
=
C
dl
⋅
CFS
R
CFS
avg
| (11) |
where CFS
R is the CFS of the alkaline earth metal ion in the sample melt, and CFS
avg is the average CFS of Mg
2+ and Ca
2+, which is ~2.93. These values were calculated using
Eq. (6) and the ionic radii reported by Shannon.
33) The effect of the polarization difference contributed by the alkaline earth metal ion was ignored in
Eq. (11), which suggests that the relationship between
E and
Cdl′ can be expressed by a single correlation equation.
Figure 7 shows the relationship between the
Cdl′ and
E. As expected, the relationship between
W and
Cdl′ of the SiO
2–Al
2O
3–CaO and SiO
2–Al
2O
3–MgO systems could indeed be expressed by a single correlation equation.

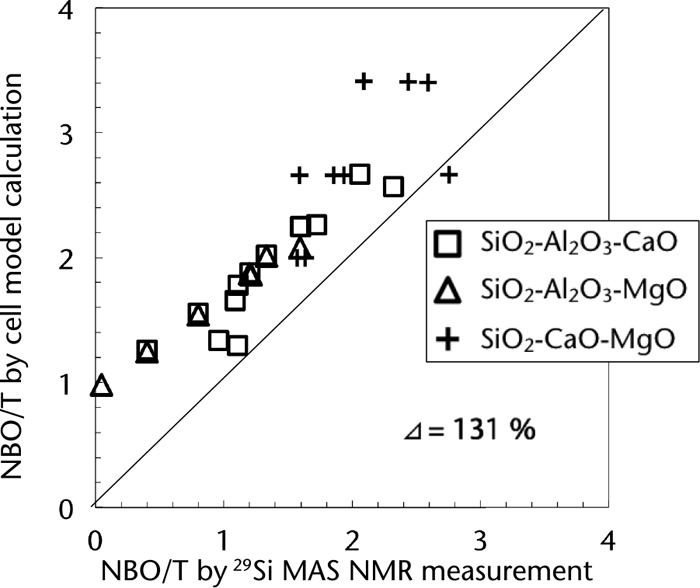
We also note the importance of obtaining the thermodynamic parameters of the cell model from the equivalent circuit components using the correlation equations obtained from Figs. 6 and 7, in addition to estimating the melt structures. Thus, the impedance values of the systems shown in Table 3 were measured, and the thermodynamic parameters of these systems were calculated by substituting the components of the equivalent circuit into the correlation equations. It should be noted that the compositions outlined in Table 3 include an alkali silicate system without thermodynamic parameters in the cell model. The structures of these compositions were analyzed by NMR spectroscopy previously.36) Figure 8 shows the relationship between the melt structures estimated by the method proposed herein and those analyzed by NMR spectroscopy. NBO/T, which is one of the indices representing the size of the silicate melt network structure, was employed for the purpose of this study. NBO/T is the number of NBO per SiO4 unit, and a greater value implies a decrease in the size of the network structure of the silicate melt. In Fig. 8, considering the values of the horizontal and vertical axes, the closer the plots to the solid line, the more accurate the structural estimations. In Fig. 8, structural estimations for each composition are close to the solid line, indicating that the estimations were accurate. For comparison, the relationship between the estimation results of SiO2–Al2O3–CaO, SiO2–Al2O3–MgO, and SiO2–CaO–MgO from thermodynamic parameters from literature and from the NMR measurements37,38) are shown in Fig. 9. Specifically, the structural estimation results obtained using the thermodynamic parameters reported in literature indicated that the NBO/T was evaluated in excess compared with that evaluated using NMR measurement results. Furthermore, it was evident that these results were poorer than the results estimated herein using the correlation equations. In this case, evaluation using the global delta,39) Δ (%), was introduced as a more quantitative evaluation method for accurate estimation. Δ can is expressed by the following equations, and represents the relative difference between the measured and estimated values:
|
Δ =
1
N
⋅
∑
n=1
N
|
δ
n
|
| (12) |
|
δ
n
=
(NBO/T)
est
–
(NBO/T)
meas
(NBO/T)
meas
× 100
| (13) |
where
N is the number of samples, and (NBO/T)
est and (NBO/T)
meas are the estimated and measured NBO/T values, respectively. It is generally known that the smaller the value of Δ, the more accurate the estimation; the calculated values of Δ obtained from
Figs. 8 and
9 were ~42.2% and ~131%, respectively. The value of Δ for the structural estimations obtained using thermodynamic parameters that had been calculated by the correlation equations between the equivalent circuit components and thermodynamic parameters were found to decrease by ~89% compared with the value of Δ obtained using the thermodynamic parameters given in the literature. It was therefore apparent that the structural estimations carried out herein were more accurate than those performed using conventional thermodynamic parameters. However, the value of Δ obtained using the correlation equations was ~40%, suggesting that there is room for improvement. We also note that for the purpose of this study, the equivalent circuit components were corrected to allow their expression as a correlation equation for different compositions, and the obtained results suggested room for improvement in the correction method. However, at the same time, it was considered that this was the limit of calculation of the cell model; therefore, further studies are necessary in the future to further evaluate these points.
Table 3. Compositions for estimating the melt structure by the modified cell model proposed in this study.
| SiO2 | Al2O3 | Li2O | Na2O | K2O | CaO | MgO |
|---|
| 66.7 | | 33.3 | | | | |
| 66.7 | | | 33.3 | | | |
| 66.7 | | | | 33.3 | | |
| 50.0 | | | | 50.0 | | |
| 80.0 | | | | 20.0 | | |
| 66.7 | | | 26.64 | 6.66 | | |
| 66.7 | | | 16.65 | 16.65 | | |
| 66.7 | | | 6.66 | 26.64 | | |
| 66.7 | | | 26.64 | | 6.66 | |
| 66.7 | | | 16.65 | | 16.65 | |
| 66.7 | | | 6.66 | | 26.64 | |
| 66.7 | | | | 26.64 | 6.66 | |
| 66.7 | | | | 16.65 | 16.65 | |
| 66.7 | | | | 6.66 | 26.64 | |
| 55.0 | 15.0 | | | | 30.0 | |
| 51.0 | 12.5 | | | | 36.5 | |
| 36.0 | 9.9 | | | | 54.1 | |
| 39.5 | 9.5 | | | | 51.0 | |
| 60.1 | 9.8 | | | | 30.1 | |
| 50.0 | 10.0 | | | | | 40.0 |
| 50.0 | 15.0 | | | | | 35.0 |
| 50.0 | 25.0 | | | | | 25.0 |
| 55.0 | 6.0 | | | | | 39.0 |
4. Conclusions
Herein, we reported on the development of a method for rapidly estimating the structures of melts by combining impedance measurements and calculations of thermodynamic parameters of the cell model. The relationships between the thermodynamic parameters of the cell model and the components of the equivalent circuit obtained by the analysis of Nyquist plots were systematically investigated. It was found that the cell formation energy was correlated with the charge transfer resistance, while the cell interaction energy was correlated with the double layer capacitance. These relationships were expressed by their respective correlation equations by correcting the equivalent circuit components. Finally, the melt structure was estimated by the cell model using the thermodynamic parameters obtained by impedance measurements and the obtained correlation equations, and it was found that the developed estimation method had superior accuracy to that employing literature-reported thermodynamic parameters. These results are of importance as current methods for the structural analyses of molten oxides are both limited and time consuming.
References
- 1) K. C. Mills and A. B. Fox: ISIJ Int., 43 (2003), 1479.
- 2) K. Raj, K. K. Prasad and N. K. Bansal: Nucl. Eng. Des., 236 (2006), 914.
- 3) K. C. Mills: ISIJ Int., 33 (1993), 148.
- 4) T. Iida, H. Sakai, Y. Kita and K. Shigeno: ISIJ Int., 40 (2000), Supplement, S110.
- 5) M. Chen, D. Zhang, M. Kou and B. Zhao: ISIJ Int., 54 (2014), 2025.
- 6) H. Hasegawa, T. Kowatari, Y. Shiroki, H. Shibata, H. Ohta and Y. Waseda: Metall. Mater. Trans. B, 43 (2012), 1413.
- 7) Y. Kim and K. Morita: ISIJ Int., 54 (2014), 2077.
- 8) L. Shartsis, S. Spinner and W. Capps: J. Am. Ceram. Soc., 35 (1952), 155.
- 9) E. F. Riebling: J. Phys. Chem., 39 (1963), 3022.
- 10) Y. E. Lee and D. R. Gaskell: Metall. Trans., 5 (1974), 854.
- 11) W. D. Kingery: J. Am. Ceram. Soc., 42 (1959), 6.
- 12) M. Nakamoto, A. Kiyose, T. Tanaka, L. Holappa and H. Hamalainen: ISIJ Int., 47 (2007), 38.
- 13) D. R. Neuville: Chem. Geol., 229 (2006), 28.
- 14) B. Hehlen and D. R. Neuville: J. Phys. Chem. B, 119 (2015), 4093.
- 15) H. Maekawa, T. Maekawa, K. Kawamura and T. Yokokawa: J. Phys. Chem., 95 (1991), 6822.
- 16) S. Sukenaga, K. Kanehashi, H. Shibata, N. Saito and K. Nakashima: Metall. Mater. Trans. B, 47 (2016), 2177.
- 17) Y. Ohta, M. Kitayama, K. Kaneko, S. Toh, F. Shimizu and K. Morinaga: J. Am. Ceram. Soc., 88 (2005), 1634.
- 18) N. Saito, K. Kusada, S. Sukenaga, Y. Ohta and K. Nakashima: ISIJ Int., 52 (2012), 2123.
- 19) Y. Harada, K. Kusada, S. Sukenaga, H. Yamamura, Y. Ueshima, T. Mizoguchi, N. Saito and K. Nakashima: ISIJ Int., 54 (2014), 2071.
- 20) Y. Harada, S. Sakaguchi, T. Mizoguchi, N. Saito and K. Nakashima: ISIJ Int., 57 (2017), 1313.
- 21) Y. Harada, N. Saito and K. Nakashima: ISIJ Int., 57 (2017), 23.
- 22) M. L. Kapoor and M. G. Frohberg: Chemical Metallurgy of Iron and Steel, The Iron and Steel Institute, London, (1973), 17.
- 23) H. Gaye and J. Welfringer: Proc. 2nd Int. Symp. on Metallurgical Slags and Fluxes, ed. by H. A. Fine and D. R. Gaskel, TMS-AIME, Warrendale, PA, (1984), 357.
- 24) I. M. Hodge, M. D. Ingram and A. R. West: J. Electroanal. Chem., 74 (1976), 125.
- 25) J. T. S. Irvine, D. C. Sinclair and A. R. West: Adv. Mater., 2 (1990), 132.
- 26) B. C. Riggs, G. E. Plopper, J. L. Paluh, T. B. Phamduy, D. T. Corr and D. B. Chrisey: Proc. SPIE, 8371 (2012), 83711F.
- 27) A. P. Sandoval, J. M. Feliu, R. M. Torresi and M. F. S. Herrera: RSC Adv., 4 (2014), 3383.
- 28) Y. Harada, N. Saito and K. Nakashima: ISIJ Int., 59 (2019), 421.
- 29) S. Sukenaga, P. Florian, K. Kanehashi, H. Shibata, N. Saito, K. Nakashima and D. Massiot: J. Phys. Chem. Lett., 8 (2017), 2274.
- 30) F. Shimizu, H. Tokunaga, N. Saito and K. Nakashima: ISIJ Int., 46 (2006), 388.
- 31) K. Kanehashi: Solid State Nucl. Magn. Reson., 84 (2017), 158.
- 32) S. Amma, M. T. Lanagan, S. H. Kim and C. G. Pantano: J. Am. Ceram. Soc., 99 (2016), 1239.
- 33) R. D. Shannon: Acta Crystallogr., A32 (1976), 751.
- 34) W. Zhang, J. Ma, P. Wang, Z. Wang, F. Shi and H. Liu: J. Membr. Sci., 502 (2016), 37.
- 35) C. W. Bale, E. Belisle, P. Chartrand, S. A. Decterov, G. Eriksson, A. E. Gheribi, K. Hack, I. H. Jung, Y. B. Kang, J. Melancon, A. D. Pelton, S. Petersen, C. Robelin, J. Sangster, P. Spencer and M. A. V. Ende: Calphad, 54 (2016), 35.
- 36) Y. Harada, S. Sukenaga, N. Saito and K. Nakashima: ISIJ Int., 59 (2019), 1956.
- 37) T. Matsumiya, K. Shimoda, K. Saito, K. Kanehashi and W. Yamada: ISIJ Int., 47 (2007), 802.
- 38) C. I. Merzbacher, B. L. Sherriff, J. S. Hartman and W. B. White: J. Non-Cryst. Solids, 124 (1990), 194.
- 39) T. Iida, Y. Kita, M. Ueda, K. Mori and K. Nakashima: Viscosity of Molten Slag and Glass, Agne Gijutsu Center, Tokyo, (2003), 77 (in Japanese).