Abstract
Using a medium-carbon steel containing 2 mass% Si, we investigated the effect of its tempered martensite microstructure on its mechanical properties. We found that the tensile strength of tempered martensite continuously decreases with increasing tempering temperature and that its yield strength markedly decreases in a tempering temperature range of 673 K to 723 K. To investigate the correlation with the microstructure, we examined the effect of tempering temperature on the microstructure by SEM and TEM and identified Fe carbide phases by TEM nanobeam diffraction pattern analysis and X-ray diffractometry. In the tempering temperature range where the yield strength significantly decreases, the morphology of the ε carbide precipitated in martensite blocks changed from platelike to granular and the χ carbide was precipitated in a small amount in the samples tempered at 723 K. SAXS quantitative evaluation of the ε carbide revealed that the decrease in the size and volume fraction of the ε carbide with the increase in the tempering temperature was far greater than with the samples tempered at 673 K and below. The sharp decrease in the yield strength was suggested to be correlated with the increase in the mobility of dislocations with the decrease in the precipitate volume fraction resulting from the dissolution of ε carbide in the transformation process of the Fe carbides.
1. Introduction
Medium-carbon steels are widely used as materials for the structural parts of machines. Parts that require high strength, such as automotive springs and bolts, are quenched to martensite. The parts are then tempered to obtain the necessary mechanical properties.
With carbon steels, the microstructural change with increasing temperature during martensite tempering can be classified into three tempering stages.1,2) Hexagonal ε carbide (FexC)3) or orthorhombic η carbide (Fe2C)4) precipitates in the first stage, retained austenite (γ) decomposes in the second stage, and ε carbide or η carbide transforms to orthorhombic cementite (θ-Fe3C) in the third stage.5) Imai et al.6,7) reported that monoclinic χ carbide (Fe5C2) forms before the formation of cementite (θ) in the third tempering stage. Kenneford and Williams8) investigated the effect of alloying element additions on the temperature at which the first and second stages of tempering occur. They reported that the tempering temperature changes little with the addition of most alloying elements except Si and that the addition of Si stabilizes the ε carbide and shifts the third stage to the high end of the tempering temperature range (transformation from ε to θ).
Martensite changes in mechanical properties as its microstructure changes in the tempering process. Generally speaking, increasing the tempering temperature decreases the strength and increases the ductility and toughness. When the effect of tempering temperature on the mechanical properties is checked in detail, tempering at about 523 K to 673 K markedly decreases the ductility and toughness (or causes low-temperature temperature brittleness), regardless of the carbon content. The cause may be related to the decomposition of retained austenite (in the second tempering stage) or the transformation of Fe carbides (in the third tempering stage).9,10,11)
As noted above, many studies have reported on the changes in the microstructures and mechanical properties in the martensite tempering process, but there are few systematic studies on the effect of carbide morphology change in the Fe carbide transformation process (the third tempering stage). In this study, we prepared tempered martensite samples with various Fe carbides (such as ε and θ) dispersed, using a high silicon-added medium-carbon steel, and attempted to clarify the effect of the Fe carbides on the mechanical properties of martensite.
2. Experimental
2.1. Material
The chemical composition of the studied steel is shown in Table 1. The studied steel was a medium-carbon steel with its Si content increased to 2 mass% to stabilize the ε carbide. The steel was vacuum melted and cast into a 150 kg ingot. The ingot was heated to above 1523 K and hot forged into a 30 mm bar. The bar was normalized by heating to 1198 K and holding for 3.6 ks and turned and cut to prepare 13-mm diameter and 110-mm long cylinders. They were quenched and tempered by heating to 1173 K, holding for 0.9 ks, quenching in 333 K oil and holding at 573 K to 823 K for 1.8 s. These heat treatments produced a tempered martensite structure in each sample as shown in Fig. 1.
Table 1. Chemical composition of steel (mass%).
| C | Si | Mn | P | S | Cr | N |
|---|
| 0.55 | 1.98 | 1.60 | 0.008 | 0.002 | 0.71 | 0.0054 |
To examine the effect of tempering temperature on the microstructure of the samples, we observed the microstructure of the samples with a field emission scanning electron microscope (FE-SEM) and a field emission transmission electron microscope (FE-TEM). A JEOL JSM-6500F FE-SEM was used at an acceleration voltage of 15 kV for the SEM observations and a JEOL JEM-2100F FE-TEM was used at an acceleration voltage of 200 kV for the TEM observations. Samples were cut off from the cylinders so that their observation surface became normal to the longitudinal direction of the cylinders. The SEM samples were mirror finished by mechanical polishing and electrolytically etched. The TEM samples were ground with emery paper to a thickness of 60 μm and punched into 3-mm diameter discs. The discs were twin-jet electrolytically polished to prepare thin-film samples. The Fe carbides were identified by FE-TEM analysis of nanobeam diffraction (NBD) patterns and by X-ray diffractometry (XRD). A Rigaku RINT-2500 X-ray diffractometer was used with 0.07093 nm wavelength Mo-Kα radiation and with the sample in transmission geometry. The XRD profiles of the Fe carbides in the matrix were measured at a measurement angle interval of 0.04 degrees and a measurement time per point of 1.15 ks. Thin-film samples with a thickness of less than 100 μm were prepared by mechanical polishing.
2.3. Tensile Test
No. 14A tensile test samples (JIS Z 2241) with a parallel length diameter of 6 mm were prepared from the core of the quenched and tempered samples. The tensile test used a Shimadzu 250 kN Autograph tensile testing machine and was conducted at a crosshead displacement speed of 5 mm/min. The strain of the samples was measured with 30 mm long strain gauges.
2.4. Quantitative Evaluation of Fe Carbides and Retained Austenite
The Fe carbides were quantitatively evaluated by the small-angle X-ray scattering (SAXS) method. The SAXS measurement used a Rigaku NANO-Viewer diffractometer with 0.07093 nm wavelength Mo-Kα radiation. The measured scattering vector q ranged from 0.1 to 10 nm−1. The magnitude of scattering vector q (= |q|) is a value that depends on the X-ray scattering angle and X-ray wavelength and is expressed by q=4πsinθ/λ where 2θ is the X-ray scattering angle and λ is the X-ray wavelength. Thin-film samples with a thickness of less than 100 μm were prepared by mechanical polishing. The volume fraction of retained austenite was measured by X-ray diffractometry (XRD). The XRD measurement used a Rigaku SmartLab diffractometer with 0.15406 nm wavelength Cu-Kα radiation.
2.5. Scattering Length Contrast of Fe Carbides by SAXS Measurement
The size and volume of second phase particles in the matrix can be quantified by normalizing the SAXS scattering profiles into absolute intensity. Whether or not the second phase particles can be detected by SAXS can be pre-studied from the scattering length density difference (scattering length contrast) Δρ2 between the matrix and the second phase particles in the following Eq. (1):
|
I(
q
)
=Δ
ρ
2
∫
0
∞
N(
r
)
V
2
(
r
)
f(
r
)
F
2
(
q,r
)
dr
| (1) |
where
I(
q) is the scattering intensity,
N(
r) is the number density of second phase particles with the radius
r,
V(
r) is the volume of second phase particles,
f(
r) is the size distribution function of second phase particles, and
F(
q,r) is the form factor of second phase particles. The scattering length density
ρ is defined by
|
ρ=
d
N
∑
element
b
element
c
element
| (2) |
where
dN is the number density of atoms,
b is the scattering length (scattered wave amplitude), and
c is the atomic fraction (concentration of each element).
Table 2 shows the scattering length density
ρ of the matrix phase and the second phase particles (Fe carbides
ε,
12) χ13) and
θ5) and austenite
γ14) and the scattering length contrast Δ
ρ2 of the second phase particles. The larger the value of Δ
ρ2, the smaller the amount that can be detected. Roughly speaking, the
ε carbide with Δ
ρ2 > 1×10
21 cm
−4 can be detected in a trace amount, but the
θ carbide with Δ
ρ2 < 1×10
20 cm
−4 cannot be detected. The detection of the
χ carbide calls for a number density about 10 times greater than the lower detection limit of the
ε carbide. We thus considered that the SAXS method can be used to quantify the precipitation state of the Fe carbides (
ε and
χ) other than
θ.
Table 2. Difference in scattering length density between matrix and carbides, retained austenite.
| Phase | Scattering length density, ρ×1011 (cm−2) | Δρ=ρmatrix−ρcarbide or γ ×1011 (cm−2) | Δρ2×10²² (cm−4) |
|---|
| matrix | 6.215 | – | – |
| ε-FexC | 5.624 | 0.591 | 0.349 |
| χ-Fe5C2 | 6.041 | 0.174 | 0.030 |
| θ-Fe3C | 6.141 | 0.074 | 0.005 |
| γ-Fe | 6.309 | −0.094 | 0.009 |
3. Results
3.1. Microstructural Observation and Fe Carbide Identification
Figure 2 shows SEM images of the Fe carbides at different tempering temperatures. When the samples were tempered at 648 K and 673 K, platelike carbides about 0.2 μm in length were precipitated. When the samples were tempered at 698 K and 723 K, the platelike carbides disappeared. Instead, fine granular carbides were observed but their precipitate volume was small. When the samples were tempered at 748 K and above, the carbides increased in size and volume with increasing tempering temperature. The retained austenite remained by tempering up to 723 K and below and decreased in volume after tempering at 723 K.

Figure 3 shows the TEM images of the carbides formed in the martensite tempered at 673 K and 698 K. Analysis of nanobeam diffraction (NBD) patterns showed that the ε carbide was precipitated in the martensite tempered at 673 K and 698 K. Figure 4 shows the TEM images of the carbides formed in the martensite tempered at 723 K and 798 K. Analysis of the NBD patterns shows the precipitation of the χ carbide in the martensite tempered at 723 K and the precipitation of the θ carbide in the martensite tempered at 798 K. There is room for discussing whether the χ carbide appears during the phase change from the ε carbide to the θ carbide. Since this χ carbide is a part of the carbide formed by tempering and agrees well in crystal structure with the χ carbide reported by Jack and Wild,13) the χ and θ carbides are distinguished in this paper.

Figure 5 shows the XRD diffraction profiles of the samples. The carbides identified by the XRD method agree well with the Fe carbides identified by the NBD method. Also, it can be seen that the diffraction peaks of the ε carbide shift to lower angle as the tempering temperature rises and that the lattice constant of the ε carbide is changed.
From the above results, the effect of the tempering temperature on the transformation of the Fe carbides and the change in the retained austenite volume fraction is shown in Table 3. We succeeded in preparing tempered martensite samples in which various Fe carbides (such as ε and θ) were dispersed.
Table 3. Transition of carbides and amount of retained austenite in the tempering of high silicon-added medium-carbon steel.
| Temperingtemperature (K) | 648 | 673 | 698 | 723 | 748 | 773 | 798 |
|---|
| Carbide phase | ε | ε | ε | χ | χ/θ | χ/θ | θ |
| Retained austenite (vol.%) | 9 | 8 | 8 | 4 | – | – | – |
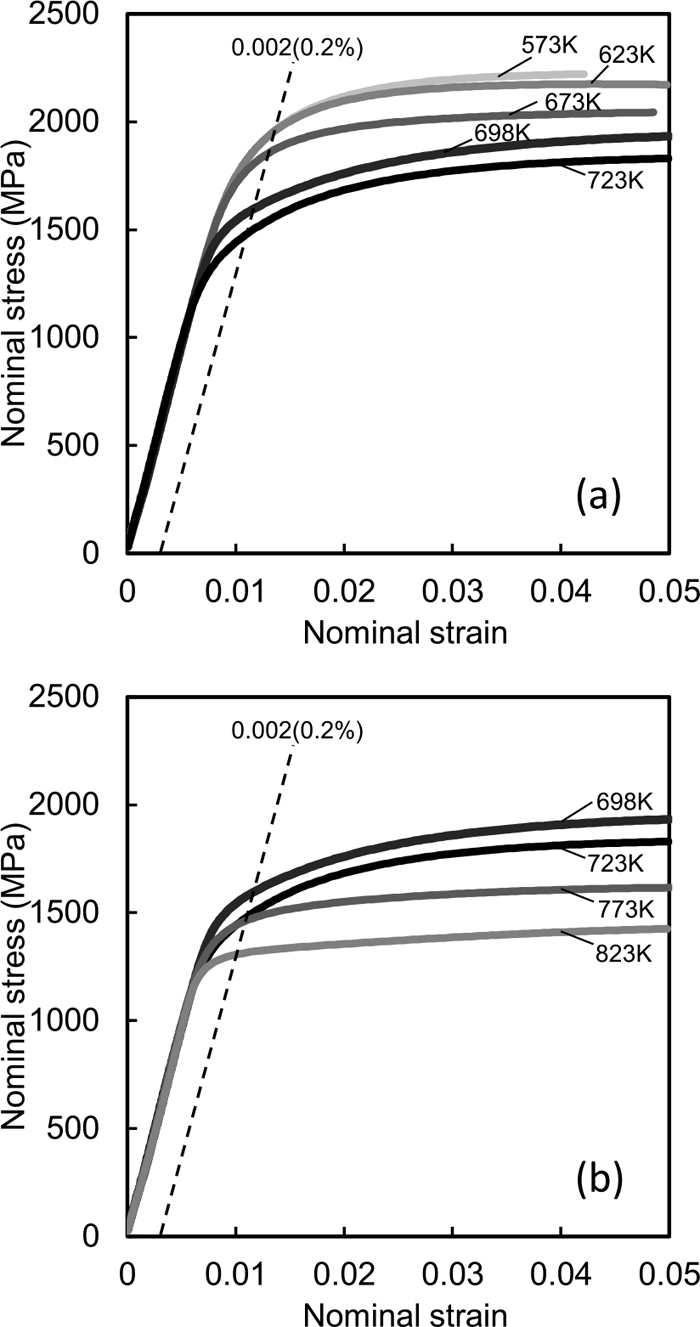
A room temperature tensile test was conducted on the above-mentioned samples. The nominal stress-nominal strain curves of the samples are shown in Fig. 6. For the samples tempered at below 673 K and above 773 K their yield ratio is high and their work hardening rate is low as shown in general stress-strain curves of tempered martensite. On the contrary, for the samples tempered at 698 K and 723 K their yield ratio is low and their work hardening rate is high. Figure 7 shows the effect of the tempering temperature on the tensile strength (σUTS), 0.2% proof stress (σ0.2) and yield ratio (σ0.2/σUTS). The tensile strength continuously decreases with increasing tempering temperature. On the other hand, the 0.2% proof stress increases or slightly decreases with increasing tempering temperature in the ranges of 573 K to 673 K and of 723 K to 773 K and significantly decreases with increasing tempering temperature in the range of 673 K to 723 K. When the tensile test results are organized by the yield ratio, the yield ratio increases with increasing tempering temperature, markedly decreases at the 698 K tempering temperature, and increases again with the 748 K and higher tempering temperatures. These large changes in the mechanical properties appear to correspond with the microstructural changes in the transformation of the Fe carbides (Figs. 2, 3, 4 and Table 3). Notably, the morphology of the Fe carbides formed by tempering greatly changes from platelike to fine granular and the volume fraction of the precipitated Fe carbides appears to significantly decrease in the tempering temperature range of 673 K to 723 K where the 0.2% proof stress significantly decreases (Figs. 2(b)–2(d)). The reason will be discussed in section 4 in conjunction with microstructure.
The change in the size and volume of the Fe carbides, considered responsible for the sharp decrease in the yield strength, was examined by the SAXS method.
Figure 8 shows the SAXS scattering profiles of samples tempered at different temperatures. The 823 K tempered samples show a small scattering contrast and have SAXS-undetectable θ carbide precipitated. For this reason, upward convex scattering profiles are not observed in the measurement range (0.1 < q < 10 nm−1) corresponding to nanosized second phase particles. The shape of the profiles is the combination of background indicating the dependence of q−4 resulting from a microstructure larger than nanosize and background independent of q.15) Upward convex scattering profiles corresponding to nanosized second phase particles are clearly observed in the samples tempered at 573 K to 723 K and where the ε or χ carbide is precipitated. This is different from the 823 K tempered samples. With the samples tempered at 698 K and above, the scattering intensity markedly decreases with increasing tempering temperature. A large change can be thus inferred in the precipitation state of the carbides.
4. Discussion
4.1. Evaluation of Fe Carbide Volume Fraction
We attempted to quantity the ε or χ carbides from the scattering profiles of Fig. 8. The scattering only from the carbides was extracted by subtracting the scattering profiles of the 823 K tempered samples as background references from the scattering profiles of the samples tempered at other temperatures. The results are shown in Fig. 9. The size distribution curves of the second phase particles were derived by fitting Eq. (1) to the extracted scattering profiles. Here, we assumed that the carbide is the ε carbide and is disc-shaped or spherical and that its size distribution function is a logarithmic normal distribution. The volume fractions of the carbides were calculated by integrating the size distribution curves. The results are shown in Fig. 10. The horizontal axis of Fig. 10 shows the carbide particle size converted into equivalent sphere diameter. The carbide volume fraction is about 30% when the scattering profiles of the 723 K tempered samples were fit by assuming that the scattering profiles were those from the χ carbide. When the carbide is assumed to be the ε carbide, on the other hand, the carbide volume fraction drops to about 3% (Fig. 10(b)). If the added carbon all becomes cementite (θ), for example, the θ volume fraction fθ is expressed by fθ(%) = 15.3 × [mass%C].16) The θ volume fraction in the 0.55 mass% C samples becomes about 8%, which indicates measured volume fraction of carbide is in the reasonable range when it is assumed as the ε carbide. We thus considered that the scattering profiles of the 723 K tempered samples are those derived from the ε carbide. It was suggested that besides the χ carbide formed by 723 K tempering, the ε carbide is present in an amount undetectable by TEM microscopy and XRD. Figure 11 shows the average equivalent sphere diameter of the ε carbide formed by tempering at different temperatures. With the samples tempered at 673 K and below, the ε carbide size increases with increasing tempering temperature. With the samples tempered at 698 K and above, the ε carbide size and volume fraction significantly decrease with increasing tempering temperature (Fig. 10(b)). These results agree well with the results of SEM and TEM micrography.

From the above results, the relationship between the precipitation morphology of the Fe carbides and the mobility of dislocations in the tempering temperature range of 673 K to 723 K where the yield strength significantly decreased is schematically illustrated in Fig. 12. The platelike ε carbide precipitated in large amounts in the martensite blocks interacts with dislocations and hinder the dislocation motion to increase the yield strength. As the tempering temperature increases, the ε carbide becomes unstable and partly dissolves to decrease the carbide volume fraction. As the tempering temperature increases further, the ε carbide dissolves further and the χ carbide precipitates, but the carbide volume fraction decreases further. It is considered that the decrease in the precipitate volume fraction in the Fe carbide transformation process increased the dislocation mobility and decreased the yield strength. Focusing on the precipitation site of carbides in the SEM image of Fig. 2, it appears that the amount of carbides at the lath boundary increases as the tempering temperature increases. One of the reasons for the decrease in yield strength is also considered to be the reduction of carbides in the lath. This large change in the precipitate volume fraction affects the dislocation multiplication and recovery in post-yield deformation. The resultant change in the balance between dislocation multiplication and recovery is considered to have greatly changed the work-hardening rate. As the ε carbide dissolves, the carbide precipitate volume fraction decreases. It is necessary to consider the state of carbon to account for the decrease in the precipitate volume fraction. Hence, we discuss the destination of carbon in the ε carbide dissolution process.

Resolution in the matrix, enrichment in the retained austenite and enrichment in the ε carbide are considered as possible destinations of carbon. We studied the carbon enrichment in the ε carbide as a possibility. When we look at the change in the XRD diffraction peaks of the ε carbide in Fig. 5(a), we see that the XRD diffraction peaks of the ε carbide shift toward the low end of the scattering angle range. This may be ascribed to the increase in the carbon content of the ε carbide and to the resultant increase in the lattice constant of the ε carbide. Since the composition range of the ε carbide FexC is wide (2 < x < 3) as reported in past studies,3,17,18,19,20,21) the carbon enrichment in the ε carbide being dissolved seems reasonable. Since this phenomenon is due to the change in the precipitate volume fraction in the transformation process of the Fe carbides, it may not to be limited to the high silicon-added medium carbon steels. For example, medium-carbon steels not containing silicon and carbon steels having different carbon contents may occur.
5. Conclusions
We prepared high silicon-added medium-carbon steel samples with tempered martensite where various Fe carbides (such as ε and θ) were dispersed by tempering and investigated the relationship between the microstructure and the mechanical properties of the samples. As a result, we obtained the following conclusions:
(1) The following tempered martensite structures were formed, depending on the tempering temperature: the ε carbide precipitated when the samples were tempered at 698 K and below, the χ carbide precipitated when the samples were tempered at 723 K to 773 K, and the θ carbide precipitated when the samples were tempered at 748 K and above.
(2) The tempered martensite obtained in the present study continuously decreased in the tensile strength with increasing tempering temperature and significantly decreased in the yield strength (0.2% proof stress) with increasing tempering temperature in a tempering temperature range of 673 K to 723 K.
(3) When the tempered martensite samples were tempered at 673 K and below, the platelike ε carbide was precipitated in a large amount. When the samples were tempered at 698 K, a granular ε carbide was precipitated and the size and volume fraction of the ε carbide were markedly smaller than in the tempered martensite samples tempered below 673 K. In the tempered martensite samples tempered at 723 K, the χ carbide was precipitated. The SAXS method suggested the precipitation of the ε carbide as well. The size and volume fraction of the ε carbide were much smaller than in the tempered martensite samples tempered at 673 K.
(4) According to the above experimental results, we considered the following model. The platelike ε carbide precipitated in a large amount in the martensite blocks interacts with the dislocations and hinder the motion of the dislocations to increase the yield strength. As the tempering temperature increases, the ε carbide becomes unstable and partly dissolves to decrease the carbide volume fraction. As the tempering temperature increases further, the ε carbide dissolves further and the χ carbide precipitates, but the carbide precipitate volume fraction decreases further. The decrease in the precipitate volume fraction in the transformation process of the Fe carbides increased the dislocation mobility and decreased the yield strength.
Acknowledgements
This research was partially supported by the Light Elements in Steels and Their Roles in Microstructure and Properties Research Group of the Iron and Steel Institute of Japan. We are deeply grateful to them for their support.
References
- 1) D. P. Antia, S. G. Fletcher and M. Cohen: Trans. Am. Soc. Met., 32 (1944), 290.
- 2) B. S. Lement, B. L. Averbach and M. Cohen: Trans. Am. Soc. Met., 46 (1954), 851.
- 3) K. H. Jack: J. Iron Steel Inst., 169 (1951), 26.
- 4) Y. Hirotsu and S. Nagakura: Trans. Jpn. Inst. Met., 15 (1974), 129.
- 5) D. Meinhardt and O. Krisement: Arch. Eisenhüttenwes., 33 (1962), 493.
- 6) Y. Imai, T. Ogura and A. Inoue: Trans. Iron Steel Inst. Jpn., 13 (1973), 183.
- 7) Y. Imai, T. Ogura and A. Inoue: Trans. Iron Steel Inst. Jpn., 15 (1975), 79.
- 8) A. S. Kenneford and T. Williams: J. Iron Steel Inst., 185 (1957), 467.
- 9) C. J. Altstetter, M. Cohen and B. L. Averbach: Trans. Am. Soc. Met., 55 (1962), 287.
- 10) R. M. Horn and R. O. Ritchie: Metall. Trans. A, 9 (1978), 1039.
- 11) W. Lee and T. Su: J. Mater. Process. Technol., 87 (1999), 198.
- 12) M. Dirand and L. Afqir: Acta Metall., 31 (1983), 1089.
- 13) K. H. Jack and S. Wild: Nature, 212 (1966), 248.
- 14) L. Cheng, A. Böttger, Th. H. de Keijser and E. J. Mittemeijer: Scr. Metall. Mater., 24 (1990), 509.
- 15) W. Woo, M. Ohnuma and X.-L. Wang: Neutron Scattering - Applications in Biology, Chemistry, and Materials Science, Chapter 12, ed. by F. Fernandez-Alonso and D. L. Price, Academic Press, New York, (2017), 719.
- 16) T. Maki: Tekko-no-soshikiseigyo, Uchida Rokakuho, Tokyo, (2015), 6 (in Japanese).
- 17) L. J. E. Hofer, E. M. Cohn and W. C. Peebles: J. Am. Chem. Soc., 71 (1949), 189.
- 18) Ph. Dünner and S. Müller: Acta Metall., 13 (1965), 25.
- 19) B. S. Lement: Trans. Am. Soc. Met., 45 (1953), 597.
- 20) S. Nagakura: J. Phys. Soc. Jpn., 14 (1959), 186.
- 21) K. F. Hale and D. McLean: J. Iron Steel Inst., 201 (1963), 337.


