Regular Articles
Interaction Coefficient between Al and Sn in Molten High Al Steel
2020 Volume 60 Issue 10 Pages 2147-2151
Details
2020 Volume 60 Issue 10 Pages 2147-2151
The interaction coefficient between Al and Sn in molten iron containing high Al was measured using a chemical equilibrium technique. A molten Fe–Al alloy was equilibrated with a molten Ag–Sn alloy in an Al2O3 crucible at 1823 K. The interaction coefficient of Sn and Al in Fe–Al alloys was measured to be  = −3.18 while varying the concentration of Al in a range from 0.01–0.17 in mole fraction. The influence of Sn on the deoxidation equilibrium of Al and O was estimated using the above interaction coefficient. The results indicate that under a constant Al concentration, a contamination of several percent of Sn slightly raises the O concentration in high Al steel.
Al has been widely used as a deoxidizing agent in the steel-making process. Al-killed steel and Al–Si-killed steel contain about 0.01–0.06 mass% of Al.1) Because the concentration of Al is low compared with that of other alloying elements, its influence on the thermodynamic properties has rarely presented a problem. In recent years, however, in addition to the use as Al as a de-oxidizing element, over 1 mass% of Al is now incorporated as an alloying element in transformation induced plasticity (TRIP) and twinning induced plasticity (TWIP) steels.2)
Tramp elements in steel are elements that are difficult to remove from steel during refining.3,4,5,6,7,8,9,10,11) Tramp elements include Cu, Sn, Zn, Pb, Cd, As, and Bi, among others. These impurities can have an adverse effect on the physical property of steel. Because Sn is less oxidized than Fe, it is difficult to separate from Fe by oxidation during the refining process. Both cold workability and temper embrittlement of steel are negatively affected when there is more than 0.2 mass% of Sn in the steel.12) In addition, the combined presence of Sn and Cu causes deterioration in hot shortness.13) Tin is included in the scrap as a tin plate, and at present, the Sn concentration in electric furnace plain steel from scrap is 0.015–0.01714) mass%.
In contrast, Sn is an element which is desired to be recovered from steel scrap.15) In addition, many studies have been conducted on methods for the removal of Sn from molten iron, and in recent years, removal by oxidation,16) sulfurization17) and ammonia spraying18) have been reported. While the activity coefficient of Sn in molten steel and the interaction coefficient with the main elements have been determined,19,20) the interaction coefficients with elements used as de-oxidizers, such as Al and Mn, have not been reported. In the future, the use of high Al steel will increase, and clarifying the thermodynamic properties of Sn in high Al steel scrap is useful for the removal of Sn and for the estimation of the amount of Sn that can be recycled from steel scrap.
In this study, a molten Fe–Al alloy and a molten Ag–Sn alloy were equilibrated at 1823 K, and the interaction coefficient of Al and Sn in the molten Fe–Al alloy was derived. The activity coefficient of Sn in Fe was derived from the concentration of Sn in the Fe–Al alloy equilibrated with the Ag–Sn alloy, using the activity coefficient of Sn in the Ag–Sn alloy.21) The influence of Al concentration in the Fe–Al alloy on the activity coefficient of Sn was analyzed, and the interaction coefficient of Al and Sn in molten Fe–Al alloy was derived. In addition, the influence of Sn content on the de-oxygen equilibrium of alumina was calculated.
A molten Ag–Sn alloy and a molten Fe–Al alloy were equilibrated to each other at 1823 K. After quenching the sample, the activity coefficient of Sn in Fe was derived from the compositions of Ag–Sn and Fe–Al alloys. Reagent grade of Ag, Sn, Fe and Al were employed in the preparation of the samples. Mixtures of Fe and Al, of an arbitrary composition, were melted and quenched using a vacuum arc furnace to form an Fe–Al alloy. The Al concentration in the prepared master alloy was in the range of approximately 0.006 to 0.137 mole fraction. Before the experiment, the prepared Fe–Al alloy was cut with a fine cutter, and then the surface was polished to remove the oxide film. A high purity Al2O3 crucible was employed as a container to equilibrate the Ag–Sn phase, Fe–Al phase and Al2O3. Table 1 shows the combinations of the initial compositions of the Fe–Al and Ag–Sn alloys for the experiment. The composition was selected that the initial Sn concentration in the Ag phase was 12 mol%, so that the Ag concentration in the Fe phase after equilibration was about 1 mol%. To derive the interaction coefficient in high Al steel, the concentration of Al in the initial Fe–Al alloy was changed from 0.01 to 0.19 mole fraction.
| Fe–Al phase | Ag–Sn phase | |||
|---|---|---|---|---|
| Sample | XFe | XAl | XAg | XSn |
| No. 1 | 0.990 | 0.010 | 0.880 | 0.120 |
| No. 2 | 0.980 | 0.020 | 0.880 | 0.120 |
| No. 3 | 0.959 | 0.041 | 0.880 | 0.120 |
| No. 4 | 0.902 | 0.098 | 0.880 | 0.120 |
| No. 5 | 0.856 | 0.144 | 0.880 | 0.120 |
| No. 6 | 0.813 | 0.187 | 0.880 | 0.120 |
The experimental apparatus is shown in Fig. 1. An electric resistance furnace with a MoSi2 heater was employed. An Al2O3 tube (ODΦ60 mm, IDΦ50 mm, 1000 mm) was installed in the furnace. A thermocouple was connected to the furnace and the hot zone was controlled within ±3 K by a PID controller. Approximately 7 g of the mixture of Ag and Sn and an 8 g mixture of Fe and the Fe–Al alloy were placed in a crucible (Φ12 mm × 40 mm). Three crucibles were placed in an alumina holder. A graphite lid was put on top of the crucible to remove oxygen in the Ar gas.

Schematic of experimental apparatus. (Online version in color.)
The temperature of the hot zone was maintained at 1823 K. Ar gas (99.9999%) at 200 mL/min was used to prevent oxygen from entering the system. After flushing the reaction tube with Ar gas for 1800 s, the holder containing the crucible was slowly lowered into the reaction tube and placed on a support stage located in the hot zone. After holding the sample in the hot zone for a predetermined time, the sample was drawn out from the furnace and quenched in a stream of helium gas. After cooling, the sample was separated into Fe–Al and Ag–Sn phases and cut into 0.1 g pieces using a fine cutter. The composition of each element was determined by inductively coupled plasma atomic emission spectrometry (ICP–AES). Some samples were cut and polished for cross-sectional analysis via field emission electron probe microanalysis (EPMA).
2.3. Determination of Equilibrium TimeThree sets of samples No. 5 in Table 1 were prepared. The samples were kept at 1823 K, for 3600, 7200, or 14400 s and then quenched. The variation of Al and Sn concentration in the Fe phase is shown in Fig. 2. Although the composition of the initial sample and the sample after 3600 s were clearly different, the difference between 3600 s and 7200 s was small. Since the change in concentration of Sn and Al in the alloys after 7200 s was small, it was judged that the Fe–Al and the Ag–Sn phases almost reached equilibrium after 7200 s. Consequently, the time taken for the sample to reach equilibrium in subsequent experiments was concluded to be 7200 s. An equilibrium experiment was conducted for each sample in Table 1.

Variation of concentrations of Al and Sn in Fe–Al alloy.
The appearance of sample No. 5 after quenching is shown in Fig. 3. The Ag–Sn phase penetrated between the Fe–Al phase and the crucible, and the interface in contact with the crucible exhibited an irregular shape. However, the Fe–Al phase and the Ag–Sn phase were separated vertically in the crucible, while still remaining in contact with each other. The sample was divided vertically into two and the cross section was examined. In each phase, no precipitate and no particles of the other phase could be identified.

Appearance of sample of Fe–Al and Ag–Sn melt after heating. (Online version in color.)
An EPMA image of the cross section in the vicinity of the boundary of these two phases is shown in Fig. 4. The composition of the light and dark colored parts, (points 1–5 in Fig. 4), which were quantified by EPMA, are presented in Table 2. The values denote compositions in mole fraction at the five points. Based on these compositions, it is concluded that the bright part shown in the upper part of the figure was the Ag–Sn phase, and the dark part shown in the lower part was the Fe–Al phase. The particles shown at points 1 and 2 were Fe–Al phase, but having a slightly higher Al concentration than the Fe–Al matrix phase. The particles were up to 60 μm in diameter. In contrast, the particles shown as points 3–5 were considerably smaller, having a diameter of approximately several μm and a composition that differed from that of the Ag–Sn phase, being primarily composed of Ag, Fe and Sn. Because these particles have a composition that differed from that of the matrix, it is possible that the matrix Fe might be detected by EPMA analysis, or particles that were not present at the experimental temperature but were precipitated during cooling.

Cross section of sample vicinity of interface after equilibrium.
| Phase | Place | XFe | XAl | XAg | XSn |
|---|---|---|---|---|---|
| Ag phase | Ag matrix | 0.0034 | 0.0181 | 0.849 | 0.130 |
| No. 1 | 0.927 | 0.0659 | 0.0019 | 0.0051 | |
| No. 2 | 0.925 | 0.0677 | 0.0021 | 0.0053 | |
| Fe phase | Fe matrix | 0.950 | 0.0438 | 0.0006 | 0.0055 |
| No. 3 | 0.203 | 0.0169 | 0.626 | 0.155 | |
| No. 4 | 0.322 | 0.0246 | 0.556 | 0.0975 | |
| No. 5 | 0.334 | 0.0176 | 0.524 | 0.125 |
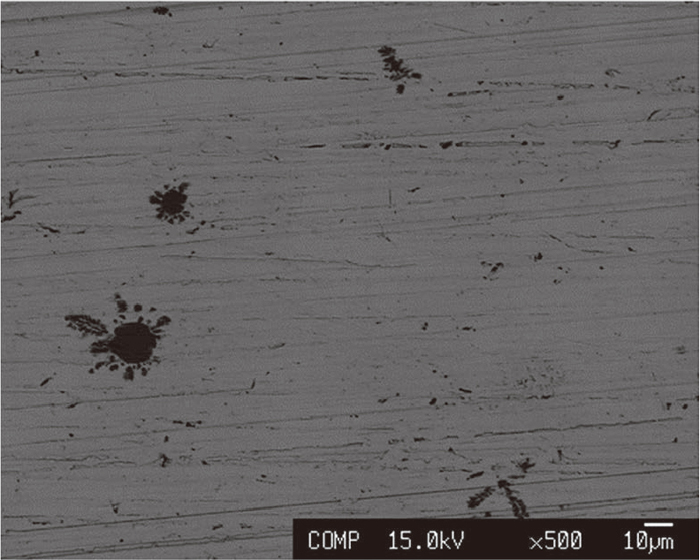
Figures 5 and 6 show the EPMA images of the Fe–Al and Ag–Sn phases at positions away from the interface, respectively. In both cases, particles of up to about 10 μm were present. However, the large suspension particle such as seen in Fig. 4 cannot be confirmed. Fe–Al particle in the Ag–Sn phase in Fig. 6 exhibited an indeterminate shape, and thus it can be judged that it precipitated during cooling. Consequently, it was concluded that the equilibrium composition in the molten state could be obtained by sampling Fe–Al and Ag–Sn pieces at locations away from the interface, and chemical analysis on the Fe–Al phase and the Ag–Sn phase.

Cross section of Fe–Al phase after equilibrium.
Cross section of Ag–Sn phase after equilibrium.
Table 3 shows the results of chemical composition of Fe–Al and Ag–Sn phases. The amount of Fe, Ag, and Sn transferred between the Fe–Al and the Ag–Sn phases is small, and a maximum of 0.001 of Ag and 0.007 of Sn in the molar fraction exist in the Fe–Al phase. A certain amount of Al was transferred to the Ag phase, and a maximum of 0.072 of Al was present in the Ag–Sn phase. As the initial Al concentration in the Fe–Al alloy increased, the Al concentration in the Ag–Sn phase also increased.
| Fe–Al phase | Ag–Sn phase | |||||||
|---|---|---|---|---|---|---|---|---|
| Sample | XFe | XAl | XAg | XSn | XFe | XAl | XAg | XSn |
| No. 1 | 0.983 | 0.009 | 0.001 | 0.007 | 0.003 | 0.002 | 0.898 | 0.097 |
| No. 2 | 0.972 | 0.020 | 0.001 | 0.007 | 0.009 | 0.006 | 0.889 | 0.096 |
| No. 3 | 0.951 | 0.042 | 0.001 | 0.007 | 0.003 | 0.016 | 0.883 | 0.098 |
| No. 4 | 0.905 | 0.088 | 0.000 | 0.006 | 0.008 | 0.035 | 0.859 | 0.098 |
| No. 5 | 0.866 | 0.128 | 0.001 | 0.005 | 0.035 | 0.060 | 0.810 | 0.095 |
| No. 6 | 0.826 | 0.170 | 0.000 | 0.004 | 0.004 | 0.072 | 0.827 | 0.097 |
First, the activity of Sn in Fe was derived. The activity of Sn related to liquid Sn in Fe–Al phase or Ag–Sn phase (as(In Fe–Al phase), aSn(in Ag–Sn phase)) have the following relationship:
| (1) |
| (2) |
| (3) |
| (4) |
The activity coefficient of Sn in Fe can be expressed as follows, using a first-order interaction coefficient:
| (5) |
| (6) |

Relationship between concentration of Al and activity coefficient of Sn in Fe–Al alloy at 1823 K.
Since the horizontal and vertical axes in Fig. 7 are XAl and
| (7) |
The interaction coefficient based on a weight percent composition coordinate can be derived from the above interaction coefficient by using the following relationship:19)
| (8) |
De-oxidation equilibria of Al2O3 in molten iron has been reported by many researchers as an important theme in the process of steel refining. The influence of Sn in high Al steel on the de-oxidation equilibrium of Al–O at 1873 K was calculated using the interaction coefficient obtained in present study and measured values20,22) of Al–O de-oxidation equilibrium in molten iron.
The activity coefficients of Al and O in molten iron, based on a weight percent composition coordinate, can be calculated using first and second order interaction coefficients, based on a weight percent composition coordinate, as follows:
| (9) |
| (10) |
Figure 8 shows the relationship between the concentration of Al in Fe and the concentration of O at the saturation of Al2O3 at 1873 K. Solid and broken lines represent the relationships in molten Fe–Al alloy without Sn and with 3.3 mass% of Sn, respectively. No components other than Fe, Sn, Al, and O were considered in the Fe–Al phase. The grey lines are the results calculated considering only the first order interaction parameters, and the black lines are from calculations considering both first and second order parameters. Since the concentration of Sn in the steel was low, the influence of Sn on the de-oxidation equilibria was small, so the conditions in which Sn was extremely concentrated were used for the calculation. Although the interaction coefficient between Al and Sn was positive, the equilibrated concentration of O slightly increased. In the region with high Al concentration, the influence of the interaction between Al and Sn became relatively large. That is because the absolute value of

Deoxidation equilibria of high Al steel with Al2O3.
The Fe–Al alloy and the Ag–Sn alloy were equilibrated in an Al2O3 crucible at 1823 K, and the interaction coefficient of Al and Sn in the molten Fe–Al system was derived. The activity of Sn in the molten Ag–Sn system was derived from the literature. From the influence of Al content in molten Fe–Al alloy on the activity coefficient of Sn, the interaction coefficient of Al and Sn in molten Fe–Al alloy at 1823 K was derived from the following:
Additionally, assuming that the molten system was a regular solution, the interaction coefficient and interaction coefficient, based on a weight percent composition coordinate at 1873 K, were derived as:
Authors thanks to the member of research group Thermodynamics of Deoxidizing Elements, Transition Metals and Tramp Elements in Steel of ISIJ, for their appropriate advices.