Abstract
M2052 is a famous high damping Mn–Cu alloys with good strength, but lack of well corrosion and wear resistance. In this study, we expect to enhance the wear and corrosion resistance of M2052 damping alloys by electroless plating Ni–P coating. Successfully, a high phosphorus amorphous Ni–P coating with thickness about 15 µm plated on M2052 substrate. After electroless plating Ni–P coating, the roughness of samples surface decreased and the microhardness increased. Thus, the coated sample featured better wear resistance, and attributed to adhesive wear mechanism. By contrast, the friction coefficients of uncoated samples presented a high value with great fluctuations, which due to low hardness, high roughness, and easier to be oxidized. This leads to the dominant wear mechanisms are abrasive and corrosive wears. Ni–P coating significantly improved the corrosion resistance, because it has lower Icorr, higher Ecorr, and higher impedance than M2052 substrate. Surface morphologies after electrochemical tests were also observed: the uncoated samples had been corroded severely with a fibrous corrosion product layer dispersing cracks and pits. However, coated samples had not been corroded and remains intact. Furthermore, Mott–Schottky plots inferred that the sample surface after plating Ni–P coating performed an excellent passivation behavior in NaCl solution.
1. Introduction
It is all known that vibrations are very harmful for materials and structures, due to vibrations accelerate the fracture, wear and fatigue etc.1) Vibration is almost inevitable and ubiquitous, for example, strong vibrations usually exist in engineering projects, transportation facilities, industrial productions and so on, especially in boats and ships.2,3,4,5) Pollution of ship noise not only effects the living environment of crew, but also effects the human being near harbors and underwater creatures.6) And research illustrated the commercial shipping can be expected to increase about 87–102% by 2030 due to growth of the world economy.7) Thereby, pollution of ship noise has received more and more attention.
In many methods of vibration reduction and noise reduction, the damping alloys can consume energy through internal friction, which not only can effectively reduce vibration and noise, but also control cost and equipment volume. Metallic materials possess the ability to dissipate mechanical vibration energy by converting mechanical vibration into thermal energy loss, referred to as damping alloys.8) In this case, damping alloys has been one of the best choices for noise and vibration reduction. However, the high damping alloys usually performs bad corrosion resistance and limit its engineering application greatly, such as Fe–Mn,9) Mg–Zr,10) Ni–Ti,11) and Mn–Cu12) alloys, etc. Especially, the components in ships, exploration or mining equipment, pipelines, etc., which bear heavy vibration and corrosion of seawater during long time working.
M2052 (Mn-20Cu-5Ni-2Fe, at%) alloys are a kind of high damping capacity alloy with low Mn content, attributing to the movement of (011) twin boundaries in martensite phase and the phase boundaries during the fcc-fct transformation.13,14,15) M2052 alloys were originally designed by Yin et al.,16) and had been widely studied by researchers last decades. Recently, many researchers have paid attention to the poor corrosion resistance of M2052 alloys and tried to improve the corrosion resistance by alloying other elements such as Zn,12) and Al17) in order to increase the possibilities of engineering applications. As we all known, it is always limited to improve the corrosion resistance by alloying elements.
In another aspect, we find that more and more structure and functional materials all need to coat films to use in rigorous environments. For example, Cr coated Zr-based alloys has been one of the promising candidates due to it performed better water corrosion and wear resistance.18) And besides, electroless plating Ni–P coatings on magnesium alloys has been successful to increase the corrosion resistance.19) However, only few reports about the application of coatings on concerning the corrosion of Mn–Cu damping alloys. And among many coating technologies, electroless nickel phosphorus (Ni–P) alloy coatings have good performance in anti-corrosion, anti-friction, good adhesion, low operational cost, solvent free coating matrix as well as ease of applications at sharp and irregular surface profiles.20,21,22,23,24,25)
Accordingly, the main objective of this study is to electroless plating Ni–P coating on M2052 damping alloys, so that it can be able to apply on ships to reduce the noise and vibrations. And then we evaluated the wear and corrosion behaviors of M2052 alloys with and without coatings. The wear behaviors were studied by a pin on disc mode in air. And the corrosion resistance was studied by electrochemical tests in 3.5 wt.% NaCl solution to simulate seawater environment. Besides, the quality and roughness of coating were detected by SEM, XRD and AFM. The semiconducting properties of passive films on uncoated and coated M2052 samples were analyzed by Mott–Schottky (M–S) plots as well.
2. Experimental Details
2.1. Electroless Ni–P Plating
A commercial M2052 Mn–Cu damping alloy (Mn-20Cu-5Ni-2Fe, at%), with a size of 30 mm × 15 mm × 2 mm, were used as the substrates for electroless Ni–P coatings. Prior to the electroless process, the sample surface was grounding sequentially up to 1000 grit SiC papers, rinsed with deionized water and degreased with alcohol in ultrasonic bath for 10 min. Then, samples were immersed into an alkaline solution consisting of 25 g/L sodium hydroxide, 35 g/L sodium carbonate, 8 g/L sodium phosphate and sodium silicate for 5 min at 30°C to remove metallic oxides on the surface and rinsed with deionized water. The substrate was then etched in an acid solution containing 50 mL/L Phosphate and 30 g/L boric acid for 5 s to perform sensitization and activation treatments, and washed with deionized water. Finally, the cleaned substrate was dipped in electroless bath to plate Ni–P coating as quickly as possible. Table 1 lists the compositions and conditions of electroless plating bath. And the pH of the bath solution was controlled with the addition of ammonia. Due to poor corrosion resistance of M2052 substrate, the electroless Ni–P bath had to be weak acidic and etching by weak acid as well. The samples with and without Ni–P coating were referred to as coated and uncoated below, respectively.
Table 1. Compositions and conditions of the Ni–P plating bath.
| Chemical composition | Concentration | Operation condition |
|---|
| Nickel sulphate (NiSO4·6H2O) | 25 g/L | Temperature: 85 ± 1°C |
| Sodium hypophosphite (NaH2PO2·H2O) | 30 g/L | pH: 6.0–6.5 |
| Citric acid (C6H8O7) | 18 g/L | Plating time: 60 min |
| Succinic acid (C4H6O4) | 13 g/L | Stirring speed: 200 rpm |
| Lactic acid (C3H6O3) | 20 mL/L | Bath volume: 200 mL |
| Sodium dodecyl sulfate (C12H25SO4Na) | 0.03 g/L | |
Surface and cross-sectional morphologies of Ni–P coating were analyzed by scanning electron microscope (SEM; JSM-5900LV) equipped with energy dispersive X-ray spectroscopy (EDS). The cross-sectional morphology and element distribution of Ni–P coating was observed by backscattered electron (BSE) and line-scan, respectively. The surface morphology and element composition of Ni–P coating was observed by secondary electron image and EDS. The crystal structure of substrate and the coatings were characterized by X-ray diffraction (XRD; X’Pert Pro MPD DY129) with using Cu–Kα radiation (λ = 1.54 Å) in 2θ range of 30°–80° (room temperature, scan speed of 1°/min, step size of 0.01°, voltage 40 kV, and current 300 mA). The 3D images and roughness were determined by an atomic force microscope (AFM; MFP-3D-BIO) using tapping mode. The surface morphologies were observed by a field emission scanning electron microscope (FE-SEM, S3400N).
2.3. Microhardness and Wear Test
Microhardness of the coatings was examined on polished cross sections using a Vickers digital microhardness tester (HVS-1000, Shanghai Second Optical Instrument Factory, China) under a load of 50 g with a 15 s duration. Five measurements for each sample were obtained and the average value were calculated, as well as the standard deviation. Friction and wear experiments were conducted under dry condition using a ball-on-disk sliding apparatus (CERT UMT-3, USA) at room temperature. New Si3N4 ball with a diameter of 5 mm was used for each test. Before the wear test, all samples were cleaned by ultrasonic and ethanol. Wear test parameters are 15 mins sliding time, 5 N load, 500 rpm sliding speed, and 2 mm sliding radius for each specimen. The whole sliding distance was calculated to be about 94.2 m. After the wear tests, the three-dimensional wear track was studied by an optical profilometry (Contour GT-K Optical profiler) and the wear mechanism was studied by scanning electron microscope (SEM; JSM-5900LV) equipped with energy dispersion spectrum (EDS). The measurements of the cross-sectional areas and length of the circumference of the wear track allowed the calculation of the wear volumes.
2.4. Electrochemical Tests
Potentiodynamic polarization, EIS, and Mott–Schottky measurements of the coated and uncoated M2052 samples were carried out using a CS 2350 electrochemical workstation with a computer at room temperature. A platinum foil served as auxiliary electrodes, a saturated calomel electrode (SCE) worked as a reference electrode. The samples were used as a working electrode with 1 cm2 surface area exposed in 3.5% sodium chloride solution. Prior to all electrochemical tests, samples were immersed in the solution for 1 h to ensure the open circuit potential (OCP) approached the steady state and a stable passive film was formed on the surface of the samples. Electrochemical impedance spectra (EIS) measurement was performed at a frequency ranging from 105 Hz to 102 Hz with an applied 10 mV amplitude of the AC signal. The data of impedance spectra were fitting by ZSimpWin software (version 3.30) and interpreted by the basis of equivalent electrical circuits. Potentiodynamic polarization curves were recorded from −0.5 V vs. SCE to a transpassive direction at a scan rate of 1.0 mV s−1. Mott–Schottky measurements were performed in the potential range from −0.5 to 1.0 V (vs. SCE) at a scanning rate of 10 mV/Step with a fixed frequency of 1 kHz. A high scanning rate could avoid electroreduction and thickness change of the passive film, and ensure the stability of defect concentrations within the passive film during the whole measurements.26)
3. Results and Discussions
3.1. Microstructure
Figure 1(a) shows the cross-sectional backscattered electron image of as-deposited Ni–P coating. It can be observed that the electroless deposited Ni–P coatings showed a compact structure without any relevant features or defects at the substrate/coating interface, suggesting good adhesion to the substrate.27) Further inspection on the cross-sectional chemical distributions, EDS line-scan in Fig. 1(b) reveals that the as-deposited coating mainly consists of Ni and P with a thickness about 15 μm. Figure 1(c) illustrates the XRD patterns of coated sample surface and shows a typical broadened peak of Ni (111) at around 2θ of 44.5°, indicating an amorphous structure. The secondary electron image of coated sample surface in Fig. 1(d) shows the coating are of a typical spherical nodular structure. EDS analysis in Fig. 1(e) suggests that the coating contains about 86.32 wt.% Ni and 13.68 wt.% P, which belongs to a high-phosphorus coating. Because the coating whose P content is higher than 9 wt.% are defined as high phosphorus coating.28) Figure 1(f) shows the XRD pattern of uncoated sample surface. Clearly observed that γ–Mn (f.c.c.) and γ′–Mn (f.c.t.) phases co-exist in the specimens, correspondingly assigned to the diffraction peaks of (111), (200), and (220) planes of γ–Mn, (220) plane of γ′–Mn, respectively.

A detailed analysis of the surface morphology and surface roughness was carried out by AFM. Figure 2 compares the 3D and 2D surface morphologies of coated and uncoated samples and shows the surfaces exhibit different features and roughness. As shown in Fig. 2(a), the 3D-AFM image of uncoated sample surface appears lots of scratches. However, some scratched gullies disappear after electroless plating Ni–P coating (Fig. 2(b)). Because the deep gullies were filled with as deposited Ni–P alloys. 3D RMS (root mean square) roughness of these two samples are also calculated. The roughness of the surface decreases from 392.4 nm to 267.8 nm after electroless plating Ni–P coating. Besides, a quantitative analysis of the surface roughness of coated and uncoated samples by 2D AFM was undertaken and the respective profiles are shown in Figs. 2(c)–2(f). As shown in Fig. 2(e), the surface after coating becomes flatter and some typical spherical nodular structures. And the height of Line A and B is depicted in Figs. 2(d) and 2(f), respectively. Fluctuations of the height decreases and the average roughness decrease from 13.2 nm to 11.7 nm after electroless plating Ni–P coating.

The 3D wear morphologies of uncoated and coated samples are shown in Figs. 3(a) and 3(b), respectively. Apparently, the wear track of uncoated sample was wider and deeper than coated sample, which presented more intuitively in Figs. 3(c) and 3(d). The depth and width of the wear track of uncoated sample is almost 20 μm and 1 mm, respectively. By contrast, depth and width of wear track of coated sample are almost 4 μm and 0.5 mm. The cross-sectional profiles of samples were used to calculate the cross-sectional areas of wear tracks. Thus, the volume loss was able to calculate and the results are shown in Fig. 3(e). The volume loss of the M2052 substrate (0.987 mm3) is more than 15 times that of Ni–P coating (0.0629 mm3). Microhardness of the uncoated sample surface is about 185.2 HV0.1 and the uncoated sample surface is 438.3 HV0.1, also involved in Fig. 3(e).

Figure 3(f) shows the coefficient of friction (COF) of coated and uncoated samples. These curves with typical characteristics can be segmented into two obvious parts by the blue dash line at 7 min as shown Fig. 7(f). All the friction coefficients are increased abruptly from the lower value to a relatively steady state in part I and then fluctuate around this value in part II, which may be caused by the increased contact area. The large fluctuation in COF curve of uncoated samples is thought to be caused by periodic localized fracture of surface layer, and periodic accumulation and elimination of debris. During the running-in period, initially coarse surfaces are ground to smooth status owing to the higher friction force.29) COF of M2052 substrate with an average value of 0.69 is higher than that of coated samples with an average value of 0.56. What’s more, contrasted to that of uncoated samples, the curve of coated samples is extremely smooth with evidently slight fluctuation. This is resulted from different wear mechanisms, which were further discussed and confirmed by SEM morphologies.

Figure 4 shows the morphologies of the worn surface of uncoated and coated samples. The worn surface of the uncoated samples presented severe damage with deep grooves parallels to the sliding direction, as shown in Figs. 4(a) and 4(b). Moreover, significant and dark spalling areas can be observed on the worn surface of the uncoated samples in air, which suggests the dominated wear mechanism of the uncoated samples is abrasive wear. Oxide materials cover on the worn surface with a proof of super high oxygen fraction (53.9 at%) listed in Fig. 4(c) indicating oxidation occurs. That is mainly caused by the instability of Mn thermodynamics with a standard electrode potential of −1.185 V. Thus, the wear mechanisms of the uncoated samples are abrasive and corrosive wears.

On the other hand, the worn surface of the coated samples was covered with some delamination and lots of cracks, as shown in Figs. 4(d) and 4(e). The increase of the hardness value of Ni–P coating and high adhesive strength between the Ni–P coating and the M2052 substrate improve the wear resistance. As shown in Fig. 4(e), the coarse surface of coated sample was ground to smooth and broken owing to the higher friction force during the running-in period. EDS results of Area 2 and 3 show the cracks region (32.59 at%) has higher oxygen than delamination area (16.26 at%), that is due to crack regions contain more oxides debris. Therefore, the wear mechanisms of the coated samples are mainly adhesive wears.
The morphologies of the worn surfaces all agree well with the results of friction coefficients. Uncoated samples performed low hardness, high roughness, and easier to be oxidized, leading to the dominant wear mechanisms are abrasive and corrosive wears. After plating Ni–P coating, the wear mechanism changed into adhesive wear. Because, the Ni–P coting has good adhesion and higher hardness. Besides, the coating formed lots of cracks during wear test, which can absorb part of impact force. The phosphorus content provides natural lubricity which is beneficial for the tribological properties, for example, reduce the coefficient of frication.30) Besides, literature shows that the wear resistance of the Ni–P coating can reach 11 times that of pure Ni.31) Therefore, the phosphorus could enhance the microhardness and act as lubricity, which improves the tribological properties.
3.3. Electrochemical Characterizations
3.3.1. Electrochemical Polarization and Impedance Spectroscopy
Figure 5(a) shows the Open circuit potential (OCP) curves of the uncoated and coated samples tested in 3.5 wt.% NaCl aqueous solution. It is easy to find that the OCP of coated samples is higher than that of the uncoated samples. The OCP of coated samples quickly achieved a stable state at −0.40 V. However, the OCP of uncoated samples decreased from about −0.913 V to −0.925 V after immersion about 600 s. Then it increased to about −0.909 V after immersion about 1200 s, which may be caused by the formation of oxide films on the surface. And the OCP curve fluctuated again, reaching about −0.90 V at the end of the test. This was caused by the further increase of oxide films.

To compare corrosion resistance of the coated and uncoated samples, the potentiodynamic polarization curves are shown in Fig. 5(b). And the corresponding corrosion potentials (Ecorr), corrosion current densities (Icorr), and corrosion rates were determined by Tafel slope extrapolation and are listed in Table 2. After coating, the corrosion current density of samples sharply decreased from 1867.6 to 4.67 μA/cm2. Corrosion rates of uncoated and coated samples were 21.968 and 0.055 mm/year, respectively. Corrosion potential of coated samples is −0.428 V, which is more positive than that of uncoated; −0.945 V. It can be inferred that the coatings increased corrosion potential to more positive values, due to Ni and P are more electronegative metal than Mn and Cu, i.e. the standard reduction potential of Ni (E°Ni2+/Ni = −0.257 V vs SHE) is more positive than that of Mn (E°Mn2+/Mn = −1.18 V vs SHE). A passive region appears in the polarization curve of uncoated samples from −0.85 to −0.74 V, which cycled out by a black cycle. This indicated that surface of the sample formed oxide films in this region in 3.5 wt.% NaCl aqueous solution.
Table 2. Tafel-polarization fitting parameters for the electrochemical corrosion in the 3.5 wt.% NaCl aqueous solution.
| Samples | Ecorr (V) | Icorr (μA/cm2) | Corrosion rate (mmpY) |
|---|
| Uncoated | −0.945 | 1867.6 | 21.968 |
| Coated | −0.428 | 4.67 | 0.055 |
Figures 5(c) and 5(d) show the Nyquist plots obtained for the uncoated and coated samples in 3.5 wt.% NaCl solution at their respective open circuit potential. And the corrosponding phase angle and Bode plots are depicted in Figs. 5(e) and 5(f), respectively. The Nyquist plot obtained for all the samples exhibit a two-depressed semicircle showing two capacitive loops indicating the presence of two time constants. The semicircle of smaller diameter can be observed at the higher frequency region followed by the larger diameter semicircle at the intermediate and lower frequency regions. It is well known that the diameter of the semicircle is related with the corrosion resistance of the samples. The larger the diameter, the better the corrosion resistance of the sample is. The coated samples showed larger semicircles as compared with the uncoated substrate, indicating the coatings improved corrosion resistance.
Electrical equivalent circuits (EEC) in Fig. 6(a) were used to fit EIS datas of uncoated substrate. The circuit description code (CDC) for the equivalent circuit can be written as Rs(Qr(RrW))(QdlRdl), where Rs attributed to the ohmic resistance of solution between the reference electrode and and the working electrode, Qr is a constant phase element, Rr is the resistance of the corrosion product layer generated during the immersion time, W is Warburg impedance; and Qdl represents the double-layer capacitance and Rct is the charge transfer resistance, which are used to describe the electrochemical reaction process at the coating/solution interface. Constant phase element (CPE) accounts for the deviation from ideal capacitive behavior and is related to surface inhomogeneities . The capacitance (Q) is replaced with CPE for better quality fit.

On the other hand, the CDC for the equivalent circuit of coated samples can be written as Rs(Qc(Rc(QdlRct))), where Rc is coating resistance and Qc is the coating capacitance. Figures 5(c)–5(f) show an excellent correlation between the experimental and the fitted data. The fitting procedure matches well with experimental data shown as individual points. Table 3 includes fitting results with an fitting variance (χ2) of 0.12 − 1.3 × 10⁻³.
Table 3. The corrosion characteristics of the uncoated and coated samples in 3.5 wt.% NaCl solution, evaluated by EIS technique.
| Samples | Rs (ohm) | CPEr/c, Y0 | nr/c | Rr/c (ohm) | w | CPEdl, Yo | ndl | Rct (ohm) | χ2 (×10−3) |
|---|
| Uncoated | 2.74 | 0.246 | 0.90 | 27.9 | 0.095 | 0.055 | 0.87 | 0.146 | 0.12 |
| Coated | 7.75 | 2.0 × 10⁻⁵ | 1 | 1964 | / | 9.1 × 10⁻⁴ | 0.76 | 80520 | 4.8 |
As for uncoated substrate, resistance of the corrosion products layer (Rr) had a value of 27.9 Ω, and the charge transfer resistance (Rct) appeared low value of 0.146 Ω, indicating the corrosion product layers and the uncoated substrate had a low resistance in 3.5 wt.% NaCl solution. Besides, the Warburg impedance, which is the infinite length diffusion element usually occurring at the lower frequency, appearedin the EEC of uncoated substrate. The Niquest plots at low frequency in Fig. 5(c) reflects this diffusion phenomenon. The corrosion product layer had low resistance my be due to cracks or pores forming in the scares, which will be comfirmed by surface SEM analysis.
To further clarify the corrosion process of the coated samples, a well-accepted equivalent circuit (Fig. 6(b))32,33,34) is used to describe two sub-electrochemical interfaces. It can be seen that the values of both Rc (1964) and Rct (80520) are quite high, whereas Y0(Qc) and Y0(Qdl) are quite low, indicating that the coatings like a barrier layer between the solution and the substrate, providing high resistance to the mass transport and isolating the contact of the corrosive medium with the substrate.
3.3.2. Surface Characterization
The SEM morphologies of the uncoated and coated samples after electrochemical tests are shown in Fig. 7. As shown in Fig. 7(a), the uncoated sample had been corroded severely, and generated a corrosion product layer with lots of cracks and pits. Figures 7(b) and 7(c) show the detail view of the pits, meanwhile lots of metal oxides with micropores and micro-cracks were found. The EDS result of Area 1 in Fig. 7(f) show that pits are enriched with Cl (9.38 at%) and Mn (34.08 at%) atoms but depleted Cu (6.11 at%) atoms with present of oxygen-rich (46.63 at%), which certified the pits were filled with Mn oxides and chlorides. Figures 7(d) and 7(e) show a detail view of the uncoated surface at the blue hexagon (Fig. 7(a)) without pits. Figure 7(d) shows the surface is full of cracks and micro cracks. It seems that the surface was corroded uniformly and produced a lot of fibrous corrosion products in Fig. 7(e). EDS result of Area 2 shows the compositions of the fibrous corrosion products mainly contain Mn (16.89 at%) and Cu (20.45 at%) atoms with Oxygen (51.77 at%) and little chloride (1.78 at%), indicating the corrosion products were made up of manganese oxides dominantly with little chloride.
This phenomenon can be explained by the standard electrode potential, due to Mn is a more electroactive metal than Cu, i.e. the standard reduction potential of Mn (E°Mn2+/Mn = −1.18 V vs SHE) is more negative than that of Cu (E°Cu+/Cu = −0.521 V vs SHE). Thus, M2052 alloys are a kind of twinning interfaces type high damping materials with Mn segregation.35) Therefore, the pits may originate from where Mn segregation and corroded easily by Cl− ions, thereby Mn oxides and chlorides were formed. And fibrous corrosion products formed at where no segregation by uniform corrosion. On the other hand, as shown in Fig. 7(g), the surface of coated sample was not corroded. And the reason was further investigated by the M–S plots.
3.3.3. Mott–Schottky (M–S) Analysis
According to the Mott–Schottky theory,36) the space charge capacitances of n-type and p-type semiconductor were given by Eqs. (1), (2) assuming that the capacitance of the Helmholtz layer could be neglected. n-type semiconductor of space charge layer capacitance was following as:
|
1
C
sc
2
=
2
ε
ε
0
e
N
D
(
E-
E
fb
-
kT
e
)
| (1) |
p-type semiconductor of space charge layer capacitance was following as:
|
1
C
sc
2
=-
2
ε
ε
0
e
N
A
(
E-
E
fb
-
kT
e
)
| (2) |
where
e is electron charge (1.6 × 10
−19C),
ε is the dielectric constant of the oxide film (
ε = 1240),
ε0 is the vacuum permittivity (8.854 × 10
−14 F·cm
−1).
ND and
NA are donors and acceptor concentrations respectively,
E is applied potential,
Efb is flat band potential,
k is Boltzmann constant, and
T is absolute temperature,
ND, N
A and
Efb were calculated from the experimental 1/
Csc2 vs.
E plot. The type of semiconductor of passive film was distinguished according to the sign of the slope of the 1/
Csc2 vs.
E plot. The flat band potential can be determined from the extrapolation of the linear portion to
C−2 = 0.
37,38)
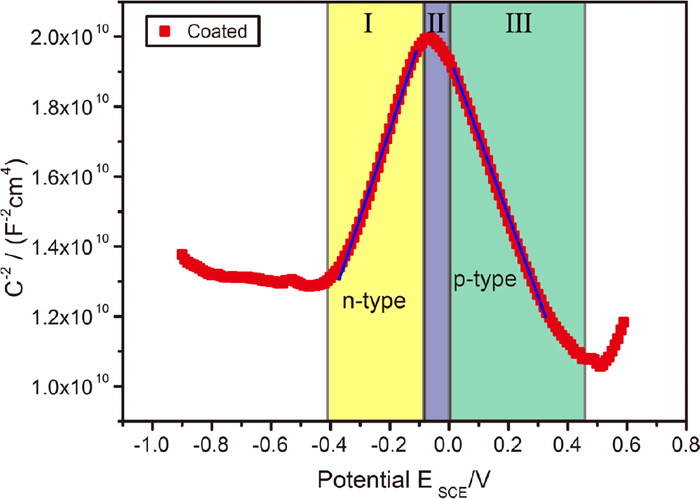
Figure 8 shows the Mott–Schottky plots measured with single frequency of 1 kHz for Ni–P samples. Before Mott–Schottky measurements, the stable passive film formed at the potential of OCP for 1 h in 3.5 wt.% NaCl solutions. After plating Ni–P coating, the sample shows three potential zones I–III in the Mott–Schottky plots, depending on the reaction conditions at two interfaces between Ni–P coating and passive film and electrolyte. Positive and negative slopes corresponding to n-type in zone I and p-type semiconductors in zone III, and potential zones I and III were separated by narrow potential zone II due to electronic band structures coupled to the flat band condition. Therefore, a two regions structure of passive films was highlighted in 3.5% NaCl solution after 1 h immersion at the OCP. The values of the ND, NA and Efb are calculated by the slope in Fig. 8. According to Eqs. (1) and (2), the values are 4.50 × 1020 cm−3, 5.36 × 1020 cm−3 and −281 mV (SCE), respectively. The ND value of Ni–P coating is in the order of magnitude with those of stainless steel nickel39) and stainless steel (~1020 cm−3).40) Therefore, the electroless plating Ni–P coating can protect M2052 damping alloys from corrosion by 3.5 wt.% NaCl solution.
Amorphous alloys have better corrosion resistance to attack than corresponding polycrystalline materials. Coatings containing high P are more resistant to attack than those with lower phosphorus contents neutral or acidic environments. There are three main mechanisms proposed for explaining the effect of phosphorus in Ni–P coating on the corrosion resistance:41) (a) formation of a diffusion barrier and protective nickel phosphate film; (b) chemical passivity by adsorption of hypophosphite ions and (c) formation of a diffusion barrier P-rich film at the interface due to selective nickel dissolution. Thus, phosphorus could transform the coating into amorphous and form phosphorus-containing passivation films, which increase the corrosion resistance.
4. Conclusions
In this research work, an amorphous Ni–P coating containing 86.32 wt.% Ni and 13.68 wt.% P with about 15 μm was successfully plating on M2052 damping alloys in weak acid plating bath by electroless deposition. The quality of the Ni–P coating, the surface morphologies and roughness, wear behaviors, and corrosion resistance before and after plating were analyzed. Conclusions can be briefly summarized as follows:
(1) The roughness of samples surface decreased from 392.4 nm to 267.8 nm after electroless plating Ni–P coating. Microhardness of Ni–P coating was 438.3 HV0.1, which was much higher than M2052 substrate (185.2 HV0.1).
(2) M2052 substrate presented bad wear behaviors due to its low hardness and oxidation resistance. The wear tracks illustrated that the wear mechanisms were abrasive and corrosive wears. After plating Ni–P coating, the wear behaviors of surface improved and the wear mechanisms transformed into adhesive wear.
(3) Surface of M2052 substrate after electrochemical tests in 3.5 wt.% NaCl solution showed a fibrous corrosion product layer with cracks and pits, indicating the M2052 had bad corrosion resistance. Ni–P coating formed good passivation behavior and show good corrosion resistance.
(4) The wear and electrochemical tests showed that electroless plating Ni–P coating improved the wear and corrosion resistance, which could promote the M2052 damping alloys on offshore oil and gas exploration facilities, boats, ships, et cetera.
Acknowledgments
The authors gratefully acknowledge the foundation of Grants provided by National Natural Science Foundation of China (Nos. 51471112 and 51611130204), Science and Technology Planning Project of Sichuan (No. 2016GZ0173).
References
- 1) D. D. L. Chung: J. Mater. Sci., 36 (2001), 5733.
- 2) N. Igata: Key Eng. Mater., 319 (2006), 209.
- 3) H. Lu, X. P. Wang, T. Zhang, Z. J. Cheng and Q. F. Fang: Materials, 2 (2009), 958.
- 4) S. Murugan and P. R. Thyla: J. Reinf. Plast. Compos., 37 (2018), 1456.
- 5) D. Borelli, T. Gaggero, E. Rizzuto and C. Schenone: Noise Mapp., 3 (2016), 107.
- 6) A. Badino, D. Borelli, T. Gaggero, E. Rizzuto and C. Schenone: Appl. Acoust., 104 (2016), 158.
- 7) M. B. Kaplan and S. Solomon: Mar. Policy, 73 (2016), 119.
- 8) I. G. Ritchie and Z. L. Pan: Metall. Trans. A, 22 (1991), 607.
- 9) H. Sun, B. Giron-Palomares, W. Qu, G. Chen and H. Wang: J. Alloy. Compd., 803 (2019), 250.
- 10) J. Wang, Z. Wu, S. Gao, R. Lu, D. Qin, W. Yang and F. Pan: J. Magnes. Alloy., 3 (2015), 79.
- 11) N. Igata, N. Urahashi, M. Sasaki and Y. Kogo: J. Alloy. Compd., 355 (2003), 85.
- 12) D. Li, W. Liu, N. Li, J. Yan and S. Shi: Adv. Eng. Mater., 19 (2017), 1700437.
- 13) Q. Tian, F. Yin, T. Sakaguchi and K. Nagai: Mater. Sci. Eng., A, 442 (2006), 433.
- 14) F. Yin, Y. Ohsawa, A. Sato and K. Kawahara: Acta Mater., 48 (2000), 1273.
- 15) G. I. Nosova: Russ. Metall., 2017 (2017), 216.
- 16) F. X. Yin, S. Iwasaki, T. Sakaguchi and K. Nagai: Key Eng. Mater., 319 (2006), 67.
- 17) W. B. Liu, N. Li, Z. Y. Zhong, J. Z. Yan, D. Li, Y. Liu, X. C. Zhao and S. Q. Shi: Mater. Des., 106 (2016), 45.
- 18) Z. Duan, H. Yang, Y. Satoh, K. Murakami, S. Kano, Z. Zhao, J. Shen and H. Abe: Nucl. Eng. Des., 316 (2017), 131.
- 19) R. Hu, Y. Su and H. Liu: J. Alloy. Compd., 658 (2016), 555.
- 20) M. Czagány and P. Baumli: Surf. Coat. Technol., 361 (2019), 42.
- 21) A. Bahgat Radwan, K. Ali, R. A. Shakoor, H. Mohammed, T. Alsalama, R. Kahraman, M. M. Yusuf, A. M. Abdullah, M. Fatima Montemor and M. Helal: Appl. Surf. Sci., 457 (2018), 956.
- 22) Y. M. Chow, W. M. Lau and Z. S. Karim: Surf. Interface Anal., 31 (2001), 321.
- 23) W. Wang, W. Zhang, Y. Wang, N. Mitsuzak and Z. Chen: Appl. Surf. Sci., 367 (2016), 528.
- 24) J. N. Balaraju, P. Radhakrishnan, V. Ezhilselvi, A. A. Kumar, Z. Chen and K. P. Surendran: Surf. Coat. Technol., 302 (2016), 389.
- 25) J. D. Lin and C. T. Chou: Surf. Coat. Technol., 368 (2019), 126.
- 26) I. Nicic and D. D. Macdonald: J. Nucl. Mater., 379 (2008), 54.
- 27) M. M. Yusuf, A. B. Radwan, R. A. Shakoor, M. Awais, A. M. Abdullah, M. F. Montemor and R. Kahraman: J. Appl. Electrochem., 48 (2018), 391.
- 28) K. G. Keong, W. Sha and S. Malinov: J. Alloy. Compd., 334 (2002), 192.
- 29) Y. Liu, S. Ma, M. C. Gao, C. Zhang, T. Zhang, H. Yang, Z. Wang and J. Qiao: Metall. Mater. Trans. A, 47 (2016), 3312.
- 30) J. Sudagar, J. Lian and W. Sha: J. Alloy. Compd., 571 (2013), 183.
- 31) K.-H. Hou, M.-C. Jeng and M.-D. Ger: Wear, 262 (2007), 833.
- 32) V. Garcia-Arriaga, J. Alvarez-Ramirez, M. Amaya and E. Sosa: Corros. Sci., 52 (2010), 2268.
- 33) H. Ashassi-Sorkhabi and M. Es’haghi: Corros. Sci., 77 (2013), 185.
- 34) Y. Chen, Y. Hao, W. Huang, Y. Ji, W. Yang, X. Yin, Y. Liu and X. Ling: Surf. Coat. Technol., 310 (2017), 122.
- 35) Z. Zhong, W. Liu, N. Li, J. Yan, J. Xie, D. Li, Y. Liu, X. Zhao and S. Shi: Mater. Sci. Eng., A, 660 (2016), 97.
- 36) F. Gaben, B. Vuillemin and R. Oltra: J. Electrochem. Soc., 151 (2004), B595.
- 37) A. Fattah-alhosseini, M. A. Golozar, A. Saatchi and K. Raeissi: Corros. Sci., 52 (2010), 205.
- 38) A. Fattah-alhosseini and S. Vafaeian: J. Alloy. Compd., 639 (2015), 301.
- 39) E. Sikora and D. D. Macdonald: Electrochim. Acta, 48 (2002), 69.
- 40) L. V. Taveira, M. F. Montemor, M. Da Cunha Belo, M. G. Ferreira and L. F. P. Dick: Corros. Sci., 52 (2010), 2813.
- 41) B. Bahadormanesh and M. Ghorbani: Appl. Surf. Sci., 442 (2018), 313.
