Welding and Joining
Numerical Modeling of the Inclusion Behavior during AC Flash Butt Welding
2020 Volume 60 Issue 11 Pages 2503-2511

Details
2020 Volume 60 Issue 11 Pages 2503-2511
The entrapment of inclusions in the solidified weld zone is detrimental to its mechanical properties. In an AC flash welding process, the upsetting rate, the initial temperature of the weld pool, and the size of inclusions may affect the final distribution of the inclusions. Additionally, the concentration of sulfur may induce Marangoni convection in the weld pool, which possibly affects the pushing and engulfment of inclusions by the solid at the solid-liquid interface. In the present work, a two-dimensional numerical model based on Computational Fluid Dynamics (CFD) has been developed to investigate the behavior of alumina inclusions during the AC flash welding of a thin SPFH590 steel plate. The Volume of Fluid (VOF) numerical model was coupled with the dynamic mesh model for the motion of plates, discrete phase for inclusion particles and solidification model. The simulation results show that the upsetting parameters significantly affect the overall inclusion motion. A high upsetting rate pushes the inclusions away from the welded joint. The high initial flash temperature does not affect the removal of inclusions from the weld zone. A similar outcome has been noted with respect to the increase in the diameter of the inclusions. Furthermore, the predicted results show that inclusions are prone to engulfment by the solidification front under the influence of higher interfacial tension between the inclusions and melt. Nevertheless, the inclusion displacement under the influence of an interfacial tension gradient is diminutive because of the rapid solidification rate of the weld pool.
Flash butt welding (FBW) is widely applied in the automobile industry, construction of rails, pipeline and marine structures, welding of plates, hot-rolled coils of sheet steel, and vessel mooring chains1,2) because of the high efficiency in process and good welding quality.3,4) In this welding process, the ends of the pieces to be welded are connected to the secondary circuit of a transformer, which ultimately generates a flash depending on the supplied current. One piece is clamped by movable platen for the upsetting process, while another piece is kept stationary by clamping the device at a fixed platen. Resistive heat is generated when two pieces are brought together under a high current. Based on sufficient heat generation, the metal melts and a weld pool are created between both pieces. In the last step of the process, the surface of the movable piece is butted against another fixed surface with a higher force. This upsetting process enhances the extrusion of the molten metal oxides and other impurities towards the outer surfaces, thus improving the weld quality.5)
Several studies related to maximizing the welded joint strength have been carried out in recent years.6,7,8,9,10,11,12) Various welding processes have been used for several applications, especially to obtain steel products with high mechanical strength. However, achieving flash welded joints with such desired mechanical properties is challenging. Previously, researchers suggested that welding parameters, such as the upsetting rate, inclusion diameter, and initial welding pool temperature, affect the microstructures and mechanical properties of microalloy (HSLA) steels.13,14) It was also suggested that oxide inclusions generated during the welding process have a detrimental impact on the mechanical properties of the welded joints such as their strength, toughness, fatigability, and surface appearance. Several types of nonmetallic inclusions can affect the mechanical and chemical properties of the steel alloys. It has been reported that non-metallic inclusions debone and initiate crack propagation during strain deformation.15) It also has been suggested that nonmetallic inclusions trigger the nucleation of micro-voids within the matrix when the applied strain increases. Subsequently, secondary fractures are created because of the stress concentration in the voids.16) For example, Lu et al.17) pointed out that microcracks are generated at the interface between the steel matrix and non-metallic inclusions on the fracture surface of HSLA 590CL flash butt welding joints in the wheel rims. Shajan et al.18,19) reported that the toughness quality of the flash welding joint deteriorates due to the presence of inclusions. Yu et al.20) and Joo et al.21) also reported that inclusions cause the crack formation in welded joints. Hence, the removal of oxide inclusions from welded joints is a critical issue associated with the flash welding process.
To ensure the high quality of the FBW joints, the oxide inclusion distribution in the weld zone should be investigated with respect to various welding parameters. Xue et al.22) studied the inclusion distribution in heat affected zone (HAZ) of welded joints. The microstructural characterization revealed that the nucleation of voids mainly occurs at the interface between the base and weld metal and is initiated at the inclusions. By using image analysis software, Pamnani et al.23) investigated the effect of the inclusion density, size, and area fraction on the quality of the FBW joints. The results showed that a higher impact toughness of the weld joints is generated by smaller inclusions and a low inclusion content at room temperature. At subzero temperatures, the chemical composition of weld metal, the weld metal grain size, the inclusion content, and the acicular ferrite are factors influencing the impact toughness of the weld metals of various arc welded joints. Moreover, Lan et al.24) reported the optimal range of the size distribution of non-metallic inclusions formed in the weld metal and the essential causes of a deteriorated HAZ toughness. Many authors25,26,27) reported that the presence of inclusions in welding joints, especially in HAZ, is due to various factors.
The effects of the upsetting force (upsetting rate), the size of inclusions, and the flashing temperature on the inclusion distribution in weld joints must be investigated. Ichiyama and Saito3) pointed out that the oxides of Si, Mn, and Al that formed during the flashing process at the sheet edge remain in the weld surface during the application of the upset force. They reported that the toughness of steels with a higher concentration of inclusions decreases. In another study, Ichiyama and Kodama2) experimentally studied the expulsion of oxide inclusions during the upsetting operation based on the change of the current density. They concluded that a higher upsetting current enhances the extrusion of the molten layer and removal of inclusions from the weld joint. Kim et al.5) studied various parameters involved in the FBW process. They reported that a small upset rate does not lead to a discharge of oxides from the welded joint. Furthermore, Lu et al.28) showed that an appropriate increase in the upset pressure enhances the extrusion of oxide inclusions from FBW joints. The oxide inclusions can be produced during the flashing operation in the presence of oxygen in the atmosphere.3,20,29,30) It is generally accepted that the oxide concentration increases with increasing flashing time.31) On the other hand, Xi et al.4) reported that an excessive flash allowance results in the entrapment of oxide inclusions in the weld joint. The upsetting pressure and length parameters significantly influence the removal and entrapment of the oxide inclusions in the weld zone.32) Despite the above-mentioned efforts, the distribution of inclusions in FBW joints is not fully understood.
On the other hand, the distribution of inclusions in solidifying metal is also affected by the interfacial tension, which is a well-known pushing and engulfment phenomenon. Several comprehensive studies on this phenomenon were carried out using the “gas bubble in the water” experiment. Mukai et al.33,34,35) reported that the pushing and engulfment of fine bubbles at the solid-liquid interface is due to interfacial tension gradients at the solid-liquid interface layer. Shibata et al.36) directly investigated the behavior of inclusions in front of the solid-liquid interface on the metal surface. Several researchers carried out microgravity experiments and emphasized that the Marangoni effect caused by the temperature or surface-active element concentration gradients influences the bulk flow.37,38) Yin and Emi38) reported that the Marangoni flow is very strong during the solidification of the steel melt, even at very low concentrations of oxygen and sulfur. Hong et al.39) numerically predicted the inclusion growth and dissolution in the submerged arc weld pool. They studied the composition, size distribution, and density of oxide inclusions in the welded zone. However, the distribution of inclusions on the centerline was not discussed. It should be noted that the FBW process differs from the submerged arc welding process.
The objective of the present study is to evaluate the effect of AC FBW parameters, that is, the upsetting rate, the initial temperature, and the inclusion size, on the distribution of inclusions at the flash butt welding joint by using a numerical simulation method. A two-dimensional numerical model based on computational fluid dynamics (CFD) has been developed to investigate the inclusion motion during the AC flash welding of a thin SPFH590 steel plate. Furthermore, the inclusion pushing and engulfment phenomenon at the solid-liquid interface during solidification is discussed.
Figure 1 shows the steps associated with the flash welding process. The AC FBW process consists of three steps. Firstly, the two conjugate faces are carried forward by a pushing mechanism. Subsequently, an AC arc generates a proper flash between the joints. Finally, upsetting operation is carried out by advancing the movable plate. During the upsetting process, fractions of the weld pool extrude.

Schematic diagram of the AC flash butt welding process and inclusion distribution. (Online version in color.)
In this study, AC FBW was carried out on SPFH590 micro-alloyed steel plates. Table 1 presents the chemical composition of the SPFH590 steel. The thickness of the sample and the weld pool width were 2.4 and 1.6 mm, respectively. After the flash welding, the samples were prepared along the welding direction. Backscatter electron (BSE) images of the samples were obtained with a field emission scanning electron microscope (FE-SEM, Hitachi, S-4300 model). For the SEM analysis, the samples were mounted and polished using 1 μm diamond suspension. Figure 2(a) shows a typical example of wheel rim breakage after joined by AC flash welding. Inclusion distribution at the centerline of the welded joint and some typical inclusions are shown in Figs. 2(b)–2(d). The distribution of inclusions in the center of the weld joint was investigated. Furthermore, different types of oxides (Al2O3 and CaO–Al2O4) were observed at the weld joint. For simplicity, in the following sections, only alumina inclusions are considered for numerical simulation.
| Element | C | Mn | Si | P | Al | Nb |
|---|---|---|---|---|---|---|
| Concentration | ≤0.1 | ≤3.0 | ≤0.5 | ≤0.1 | ≤0.1 | ≤0.1 |

(a) Flash butt welding joint breakage of a wheel rim, (b) inclusion distribution along the center line, (c) inclusion composition: 90.7% Al2O3–9.3% FeO, and (d) inclusion composition: 26.4% CaO–66.5% Al2O3–7.1% MgO. (Online version in color.)
The flash welding operation has been modeled according to the experiment. The CFD model simulates the upsetting process using moving plates (squeezing the weld pool) and successive weld pool solidification. The inclusion distribution has been investigated during the upsetting operation and solidification. In the present work, two-dimensional, multiphase numerical models have been developed to study the effects of the upsetting parameters on the inclusion distribution associated with the FBW process. The CFD simulations were carried out on macro- and micro-scales. For the macro-scale study, the inclusion distribution during the upsetting operation was investigated. For the micro-scale study, the pushing and engulfment of alumina inclusions at the solid-liquid interface were investigated. Both numerical models adopted the multiphase model. The numerical details of both phases are discussed in Section 3.2. The equations governing the mass and momentum can be expressed as follows:
| (1) |
| (2) |
| (3) |
| (4) |
The solidification of the weld pool was calculated using the enthalpy–porosity method. In this method, the mushy region (liquid fraction between 0 and 1) is considered a porous medium. The liquid fraction of each cell is considered the porosity of the cell. Fully solidified cells are considered non-porous cells with a porosity of 1. Thus, the velocities of fully solidified cells are considered to be null. Furthermore, the mushy zone in the weld pool has been modeled as a pseudoporous medium. As the weld pool solidifies, the porosity decreases from 1 to 0.40) The enthalpies of the melt and solidifying steel were computed as the sum of the sensible enthalpy, h, and latent heat, ΔH:
| (5) |
The liquid fraction, β, can be defined as:
The latent heat content of the weld pool is given as L, where ΔH = βL. The latent heat content of solid and liquid can vary from 0 to 1. The energy equation for solidification-melting problems is:
| (6) |
The local mass fraction (Yi) of molten steel and sulfur content are predicted using a convection-diffusion equation for the ith species. This conservation equation for the liquid phase can be expressed as:
| (7) |
In the case of sulfur diffusion in iron, the diffusion coefficient can be expressed with the following equation:41)
| (8) |
The Volume of Fluid (VOF) model enables the computation of multiple phases. In this computational methodology, two or more immiscible incompressible fluid interfaces can be identified. In the study of welding parameters, molten steel and air were used as two immiscible fluids. In the second microscopic simulation, molten steel and alumina inclusions were used as two immiscible fluids. The variables, such as the pressure and velocity, are shared by both phases and correspond to volume-averaged values. The flow equations were volume-averaged to obtain a single set of equations. The interface between the weld pool (liquid steel) and air or alumina inclusions have been tracked using the color function α. When cell volume is filled with the first phase, then the value of α is referred to 1, otherwise 0 in case of the second phase. Further, the interface of the two phases is calculated when the α value of phases is between 0 to 1.
The flow front is advanced by solving the following transport equation of the fluid:
| (9) |
Geo-reconstruct advection schemes have been used in the present work. It is well known that the discretization of the governing equations has a significant effect on the interface representation. Therefore, the solution of a two-dimensional problem can be obtained by the explicit scheme with a geo-reconstruct interface interpolation scheme. In the explicit approach, standard finite difference interpolation schemes are applied to the volume fractions that were computed in the previous time step.
| (10) |
The CFD simulations have been carried out to predict the inclusion distribution during AC flash welding. In the first phase of the simulation, the inclusion distribution has been investigated during the upsetting operation. The effects of three parameters, that is, the upsetting rate, the size of alumina particles, and the initial temperature of the weld pool, were studied. In this simulation, a two-dimensional, multiphase numerical model has been developed to study the inclusion distribution during the upsetting operation of the FBW process. The dynamic mesh model and the discrete phase model of Ansys Fluent (academic version: 18.0) were incorporated to initialize the inclusion and plate motion (upsetting operation). The volume of the fluid method has been used for the multiphase simulation. The local sulfur concentration of molten steel was modeled with a species model. In this simulation, three phases (molten iron, surrounding air, and discrete particles) were selected. The inclusion particles were assumed to be alumina particles for simplicity. The upsetting operation was assumed to be laminar because of the scale of the geometry and the viscosity of molten iron. Figure 3 shows a typical cross-sectional image of an experiment sample, the schematic diagram of the initial condition of the welding process, and the discretized domain for the simulation. The dynamic wall (moving side) was considered as a rigid wall. The outer domain was considered a convective atmospheric domain. It was assumed that the steel plate has a constant thermal conductivity. The interior domain was assumed to be a mesh deforming body. The outer walls were considered to represent a stationary body, acting as a pressure inlet/outlet. The model domain was discretized using a 17000-tetrahedra mesh. The maximum cell size of the domain in this simulation was 30 μm. The thermophysical properties of the sample are listed in Table 2. The data in Tables 1 and 2 were used as simulation input. Here, the surface tension of the SPFH590 steel and the interfacial tension between the SPFH590 steel and an alumina inclusion were experimentally determined in our previous study.43)

(a) Experimental sample, (b) schematic diagram of the initial welding condition, and (c) discretized domain. (Online version in color.)
| Parameter | Value |
|---|---|
| Density of molten steel42) | ρ (kg m−3) = 8621.17 − 0.88T |
| *Viscosity of molten steel42) | μ (mPa s) = 0.2388 × exp(47.44/(RT)) |
| Specific heat44) | 750 J kg−1 K−1 |
| Thermal conductivity44) | 41 W m−1 K−1 |
| Surface tension43) | |
| Interfacial tension43) | |
| #Solidus temperature | 1781 K |
| #Liquidus temperature | 1798 K |
In the second phase of the simulation, the pushing and engulfment of inclusions were studied. The objective of the second phase of simulations was to precisely predict the alumina inclusions under the Marangoni force induced by the sulfur concentration and temperature gradient. The numerical model is a two-phase model, consisting of molten steel and alumina inclusions. The sulfur concentration in the domain was determined by using the species transport model of the Ansys Fluent version 18. The solidification model was incorporated to study the solidification process. The interfacial tension correlation and other thermophysical values remain the same. Transient state solutions were obtained for all simulations. The species continuity equation was solved at each time step.
It is speculated that as the upsetting rate increases more alumina inclusions can be removed from the weld pool. In the present work, three upsetting rates (indicated as cases I, II, and III), that is, 19.3, 15.57, and 12.82 m/s, were examined at 1808 K (10 K above the liquidus temperature). Figure 4 shows the predicted inclusion movements under different upsetting rates. The alumina inclusion size was assumed 5 μm. The alumina inclusion particles are displaced from the weld zone as the force for the movement of the plates was applied. It is found that more inclusions move towards the outside of the welded zone by increasing the upsetting rate. Figure 5 illustrates the inclusion movement during the upsetting process, confirming the above-mentioned predictions of inclusion movements during upsetting. The results show that 98%, 92%, and 88% of the inclusions were removed from the welded joint in the cases I, II, and III, respectively. Figure 6 shows the comparative analysis of the average particle velocity of alumina inclusions for the three cases with different upsetting rates. The maximum average particle velocities in the cases I, II, and III are 0.77, 0.61, and 0.40 m/s, respectively. Therefore, it is considered that a higher upsetting rate enhances the removal of alumina inclusions from the weld zone. It is also noteworthy that a higher particle density is observed near the center of the weld zone in case III of a lower upsetting rate (12.82 m/s). In contrast, a higher concentration of inclusions can be observed on the outside of the weld joint at a higher upsetting rate. Consequently, it is concluded that the upsetting rate has a significant effect on the FBW.

Alumina inclusion distribution after the upsetting operation (inclusion size: 5 μm, weld pool temperature: 1808 K and sulfur content: 10 ppm). (Online version in color.)

Effect of the upsetting rate on the particle removal from the AC flash butt welding joint (inclusion size: 5 μm, weld pool temperature: 1808 K and sulfur content: 10 ppm). (Online version in color.)

Average velocities of the inclusions during the upsetting operation (inclusion size: 5 μm, weld pool temperature: 1808 K and sulfur content: 10 ppm). (Online version in color.)
The size of inclusions may affect the movement in the stream of melt flow. Here, the effect of the inclusion diameter has been examined at 1808 K, while the upsetting rate was fixed at 15.57 m/s. Three different inclusion sizes (5, 10, and 100 μm) were considered. Figure 7 shows the simulation results. The results showed that a larger inclusion diameter leads to a slight decrease in the inclusion movement. Accordingly, it is considered that smaller inclusions tend to be slightly displaced more toward the outside than larger inclusions. However, the inclusion diameter does not affect the percentage of particles removed from the welded joint, as shown in Fig. 8. Thus, it is considered that the inclusion diameter shows no significant impacts on the particle removal from the welded joint. Furthermore, Fig. 9 illustrates the average velocity of alumina inclusions with respect to their size (diameters). The results show that the average velocity of the particles remains nearly the same for all inclusion sizes. The maximum average velocity of the inclusions is ~0.61 m/s at 0.0018 s.

Effect of the particle size on the inclusion distribution after the upsetting operation (upsetting rate: 15.57 m/s, weld pool temperature: 1808 K and sulfur content: 10 ppm). (Online version in color.)
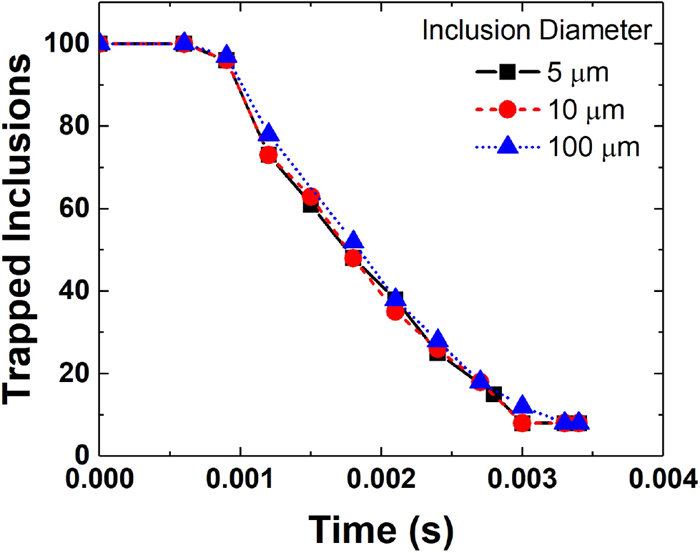
Effect of the diameter on the particle removal from the AC flash butt welding joint (upsetting rate: 15.57 m/s, weld pool temperature: 1808 K and sulfur content: 10 ppm). (Online version in color.)

Effect of the inclusion size on the average velocities of the inclusions during the flash welding process (upsetting rate: 15.57 m/s, weld pool temperature: 1808 K and sulfur content: 10 ppm). (Online version in color.)
The effect of the initial weld pool temperature on the distribution of alumina inclusions was studied. The initial temperature of the weld pool can be altered with an arc flash because the melt viscosity can be decreased with increasing temperature. Figure 10 shows the effect of the initial flash (weld pool temperature) on the distribution of alumina inclusions. It can be observed that a small number of inclusions were trapped in the joint at a weld pool temperature of 1808 K. Besides it can be observed that the inclusions move towards the outer zone of the joint when the initial temperature becomes relatively higher. At a higher temperature, the viscosity of the weld pool decreases, and the inclusions are thus more likely to disseminate towards the outside of the joint. This trend shows that the particles are susceptible to move out from the welding domain if the weld pool fluidity is high enough at a higher temperature. However, the trapped inclusion percentage did not change at higher temperatures (2000 and 2200 K). Figure 11 shows the percentage of the inclusion removal at three different initial flash temperatures, that is, 1808, 2000, and 2200 K. Not that an increase in the flash temperature does not affect the removal percentage, while the distribution of inclusions in the weld zone has been slightly altered. Figure 12 shows the average velocity of alumina inclusions during the upsetting process. The average velocities for the three different flash temperatures were predicted. The results show that the average velocity remains almost the same up to 0.0018 s. The maximum average velocities of the particles are 0.621, 0.629, and 0.635 m/s at a weld pool temperature of 1808, 2000, and 2200 K, respectively. Although the average velocity of the particles depends on the weld pool temperature, only minor difference in the average velocity was observed at 0.003 s, shortly before the end of the upsetting operation within the observation temperature range.

Effect of the initial flash temperature on the inclusion distribution (upsetting rate: 15.57 m/s, weld pool temperature: 1808 K and sulfur content: 10 ppm). (Online version in color.)

Effect of the temperature on the particle removal from the AC flash butt welding joint (upsetting rate:15.57 m/s, weld pool temperature: 1808 K and sulfur content: 10 ppm). (Online version in color.)

Average velocities of the particles at different initial flash temperatures (upsetting rate: 15.57 m/s, weld pool temperature: 1808 K and sulfur content: 10 ppm). (Online version in color.)
Inclusion movement in the weld pool is influenced by the interfacial tension gradient as well as the viscous flow. The interfacial tension plays an important role in the engulfment and pushing of inclusions near the solid-liquid interface. Inclusions are affected by the Marangoni force due to the difference in the interfacial tension caused by the surfactant concentration and temperature gradient. In this study, the behavior of alumina inclusions at the solidification interface has been studied as a function of the sulfur content of the molten weld pool. The discussion of the results obtained for the alumina inclusion engulfment and pushing considers interfacial tension-induced forces acting on the inclusions at the solid-liquid interface.
In the present work, 2-dimensional, two-phase numerical simulation has been carried out to study the behavior of alumina inclusions during solidification. In this case study, a full-scale geometry has been considered, as shown in Fig. 13. The length and width of the model were 2.4 mm and 0.1 mm, respectively. For this study, alumina inclusions of 20 μm in diameter were randomly placed throughout the domain. The upper and lower sides of the domain were assumed to be radiative and convective boundaries, respectively. The left and right sides of the domain were considered to be conductive walls. The simulation calculation was initiated at 1808 K. Figures 14(a) and 14(b) show the position of the inclusions during the solidification of the weld pool at two different sulfur contents (10 and 64 ppm). The figure also illustrates the instantaneous contour of molten metal fraction, mushy zone and solidus fraction between the steel plates. It is noteworthy that the Marangoni force induced by the sulfur content and temperature gradient influences the movement of the alumina inclusions. However, inclusion motion during solidification is not notable at this scale of the domain. The alumina inclusions are influenced by the induced interfacial tension; however, the pushing and engulfment are limited to a few micrometers. The reason for the minute displacement of the inclusions is the rapid solidification rate of the weld pool. The simulation predicts that the weld pool rapidly achieves the solidus temperature (1781 K in 0.013 s). However, a rapid solidification of the weld pool allows minimal time for alumina inclusions to move along with the solid-liquid interface movement. It is noted that the alumina inclusion movement under the Marangoni force is limited to 30 μm in all domains.

Geometric domain considered for the inclusion simulation under different sulfur contents (inclusion size: 20 μm, weld pool temperature: 1808 K and sulfur content: 10 and 64 ppm). (Online version in color.)

Prediction of the inclusion movement with respect to weld pool temperature: (a) sulfur content: 10 ppm, (b) sulfur content: 64 ppm. The liquidus and solidus temperatures are 1798 and 1781 K, respectively (inclusion size: 20 μm). (Online version in color.)
In order to investigate the impact of the AC FBW parameters on the alumina inclusion distribution in the welded joint, numerical investigations have been carried out. The effects of the upsetting rate, the flashing temperature of the weld pool, and the size of the inclusions have been investigated on the distribution of inclusion particles in the welding joint. Initially, a two-dimensional multiphase CFD model was developed to predict the alumina inclusion distribution during the upsetting operation based on dynamic mesh and discrete phase models. The simulation results show that the upsetting rate significantly impacts the inclusion distribution. A high upsetting rate pushes the inclusions away from the welded zone towards the outer weld surface. When the effect of the inclusion diameter was investigated, the results showed that the inclusion diameter has no direct impact on the percentage of inclusion removal from the weld zone. However, a minute difference in the distribution pattern of the particles was observed at the weld joint. Finally, when the effect of the initial flash temperature was examined, there was no significant impact observed in the inclusion distribution. Nevertheless, if the initial flash temperature is not high enough to make a full melting at the edge of the steel plate, the weld quality cannot be guaranteed in practical situations. In this study, only the distribution of alumina inclusions that were already present in the weld pool are discussed. In practical operations, however, more inclusions may form due to the reoxidation of the weld pool. Accordingly, increased numbers of inclusions may affect the weld joint properties. To prevent the reoxidation of the weld pool, the use of a protecting gas flow is suggested.
In the second phase of the present study, a numerical investigation was carried out to analyze the alumina particle motion at the solid-liquid interface of the weld pool under the influence of interfacial tension. The numerical simulation was carried out on two different concentrations (10 and 64 ppm) of sulfur in the weld pool. The Marangoni force was induced in the weld pool using the sulfur concentration and temperature gradient. The predicted results indicate that the inclusions are prone to engulfment by the solidification front due to the rapid solidification of the weld pool at both sulfur concentrations. Therefore, the Marangoni force has no major impact on the inclusion behavior during the solidification of the weld pool. The surfactant effect is more pronounced when the cooling rate of the molten metal is much smaller.
This work was supported by POSCO, South Korea. One of the authors (MIH Siddiqui) was supported by Korea University grant.