Abstract
This paper proposes a dynamic control method for strip flatness and elongation in a skin pass mill. In conventional feedback control, the target values of flatness and elongation are fixed. However, elongation control to a fixed target value is often insufficient to achieve strip flatness when rolling force manipulation for elongation control causes work roll deflection. To improve flatness control performance, we propose an elongation control method which considers flatness. In the proposed method, an optimization problem is solved periodically. The objective function, including flatness control error, is minimized subject to constraints such as the range of elongation and strip thickness and the control outputs. A feedforward control method which suppresses elongation deviations during mill speed changes is also proposed. Accurate online prediction of rolling force using a physical model is difficult due to the heavy computational load. The proposed method utilizes the relationship between the strip strain rate and deformation resistance, which is measured offline, and the designated rolling force change from low to top rolling speed, and does not require a physical model or heavy computation load. An evaluation by simulation and experiments showed that the proposed method improves flatness and elongation control performance.
1. Introduction
Recently, increasingly strict quality requirements, including flatness, mechanical properties, and surface roughness, have been applied to hot-rolled steel sheets. The skin pass mill is the final rolling process for building quality into products. The strip is rolled at an elongation rate of a few percent in the rolling direction while predetermined tensions are set to the entry and exit sides of the mill to improve flatness, eliminate the characteristic of yield point elongation, and control mechanical properties.
Control of skin pass rolling consists of setup control, which sets the rolling conditions and manipulated variables (MVs) to achieve the desired flatness and elongation at the top end of the strip, and dynamic control, which sets the MVs in real time so that the flatness distribution in the strip width direction and elongation rate in the rolling direction achieve the target values. This paper deals with dynamic control of a 4Hi skin pass mill using the leveling position, work roll bending force (bending force), and rolling force as MVs. Although rolling force is expressed as the result of rolling, it can be treated as a MV by the minor control loop, which adjusts the roll gap so that the rolling force achieves the set value. As process information, flatness is measured using a shape meter at the mill exit side and elongation is measured by the roll speed at the entry and exit sides. The exit side strip thickness and rolling force are also measured.
Various flatness and elongation control methods have been proposed. Flatness control methods include a method in which the measured flatness distribution is decomposed into symmetric and asymmetric components, and a convex function composed of the sum of squares of deviations between those components and the target components is minimized by a local search method to obtain the MVs (leveling position and bending force);1) a method applying model predictive control3) for tandem cold rolling mill in consideration of time delay;2) and a multivariable control method using disturbance estimation by an observer.9) Since it has been noted9) that rolling force fluctuation becomes a flatness disturbance, feedforward control is proposed to reduce its effect. As described above, a flatness control system is realized as a multi-input multi-output system, and some methods are excellent in practice, as they can deal with various constraints.
For elongation control, conventional techniques include feedback control of the elongation rate to a fixed target value over the whole length of the strip by changing the rolling force or tension,4,5) one method4) is integral feedback control and the other method5) uses measured elongation rate and grain size of the strip to calculate the MVs; dynamic setup control,6) in which rolling force manipulation is corrected sequentially to shorten the section out of the control range due to setup error; and feedforward control10) by manipulating the rolling force based on predictions of rolling force fluctuations after acceleration/deceleration to improve control accuracy, which indirectly suppresses strip tension variations. These elongation rate control methods are constructed with a single input/or multiple input/single output system which controls the elongation rate to a fixed target value in coil units by changing the rolling force and/or entry- and exit-side strip tension. As described above, flatness control and elongation control are generally constructed independently of each other.
The influence of rolling force fluctuations on flatness results from changes in work roll deflection is difficult to eliminate completely because it does not coincide perfectly with the influence of other MVs (leveling position, bending force) on flatness. Although rolling force fluctuations during acceleration/deceleration are assumed in the literature,9) elongation control also causes rolling force fluctuations, and in some situations, fluctuations due to rolling force manipulation to control the elongation rate to the target value may become excessive. This interference causes large flatness disturbances which cannot be eliminated by using other MVs, resulting in flatness deterioration.
However, even if the elongation rate does not achieve the target value, quality characteristics such as mechanical properties can be ensured provided elongation is controlled within the control range. Focusing on this fact, we propose an optimal control method to improve flatness control performance by controlling the elongation rate to within the control range rather than to a fixed target. Specifically, rolling force, which is conventionally used as a MV for elongation control, is also used to control flatness.
In skin pass rolling, the strip is rolled in the low strain region. During acceleration/deceleration, rolling speed changes are large and average deformation resistance changes greatly accompanying those changes. Without feedforward control, the elongation rate will fluctuate and may exceed the control range. Although the feedforward control10) described above sufficiently reduces rolling force fluctuations before and after acceleration/deceleration, the elongation rate varies depending on the difference in the average deformation resistance before and after speed changes. To eliminate this elongation rate variation, rolling force manipulation equal to the rolling force change due to the average deformation resistance change (δP = (∂P/∂km)Δkm, where km is mean deformation resistance and Δ is a small deviation) is required. As mentioned in one reference11) which notes that the reduction force in skin pass rolling is used almost entirely for work roll flattening, skin pass rolling is characterized by non-circular arc deformation of the work roll. Elastoplastic models for predicting the rolling force in this type of rolling are not suitable for online feedforward control calculations due to their high calculation load. However, offline calculations are not realistic for small-lot, multi-kind production due to the enormous time required for model tuning. Bland and Ford’s rolling force model is generally used in cold rolling and has a comparatively low calculation load, but its prediction accuracy12) is inadequate because non-arc rolling is not assumed. As described above, problems of adjustment and model accuracy arise when using a model. On the other hand, in the steady state after acceleration or deceleration, changes in the necessary rolling force appear as a result of the feedback control. The rolling force change necessary to avoid changing the elongation rate during acceleration/deceleration in a certain rolling speed range is proportional to the change of the average deformation resistance at that time. Therefore, it is possible to calculate the necessary rolling force change without a physical model by utilizing the rolling force change during acceleration/deceleration quantified from past operational results, and the relationship between the change of deformation resistance and change of rolling speed identified in advance by experiments. Based on this concept, this paper proposes a feedforward control method that suppresses elongation rate fluctuations during acceleration/deceleration without using a physical model.
Chapter 2 describes flatness and the elongation rate, which are the operational indices in skin pass rolling, and Chapter 3 explains the proposed control methods. Chapter 4 presents the simulation and experimental results, and Chapter 5 summarizes the conclusions.
2. Flatness and Elongation
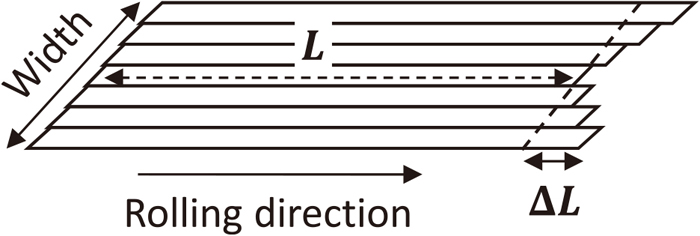
In a skin pass mill (Fig. 1), the operational indices are flatness and elongation. Flatness is quantified by the index of the relative difference in elongation or steepness, which indicates widthwise nonuniformity of elongation in the rolling direction. The relative difference in elongation is defined by the ratio ΔL/L of the difference (ΔL) between the elongation at an arbitrary width position other than the width center and the elongation at the width center, when elongation in the rolling direction at the width center (L) is a reference (Fig. 2). The value obtained by multiplying this ratio by 105 is called the I-unit and is generally used in quality and flatness control. The typical flatness defects are edge wave and body wave. In edge wave, the distribution of the relative difference in elongation in the width direction is convex downward, and in body wave, the distribution is convex upward. The other flatness defect is a composite form with a distribution different from the above. Although all of these flatness forms can be grasped by the widthwise distribution of the relative difference in elongation, some methods7,8) approximate this distribution by a linear combination of the orthogonal function for quantitative evaluation of mode components. In this paper, the I-unit is used as a flatness index.

The elongation rate e [%] is defined as e = (V2−V1)/V1 × 100 = (hin−hout)/hout × 1005) using the strip entry velocity V1 and exit velocity V2 or entry thickness hin and exit thickness hout. The target value and control range of the elongation rate are set for each coil. In hot skin pass rolling, the target value is often set between 0.5% and 2.0%.
3. Optimal Control Using Elongation Rate Control Range and Feedforward Control to Suppress Elongation Rate Fluctuations during Acceleration/deceleration
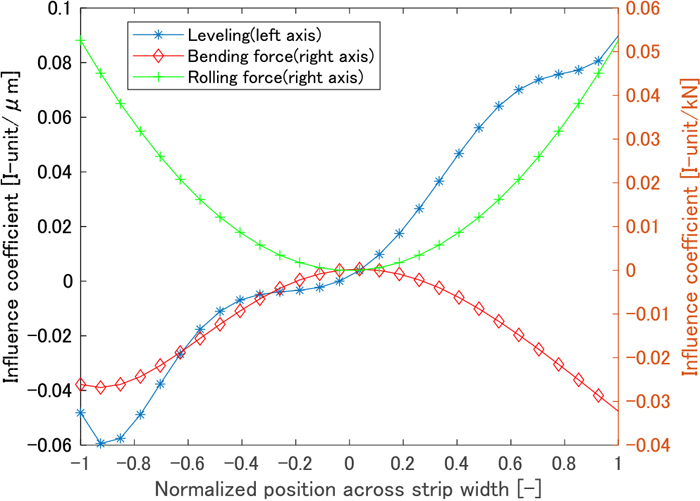
Rolling force fluctuations change work roll deflection, which affects flatness. As an example, Fig. 3 shows the influence coefficient ∂F/∂P representing the effect of the change of rolling force ∂P on the change of flatness ∂F. Here, the width position is normalized from −1 to + 1. From this figure, when the rolling force increases, the relative difference in elongation at the strip edge increases, promoting edge wave. Therefore, it is thought that the flatness is improved by utilizing the rolling force, which affects the flatness, as a MV for flatness control.
The quality of hot-rolled steel sheets can be ensured if the elongation rate is controlled within the control range. Focusing on this fact, this paper presents an optimal control method for setting the rolling force to improve flatness by controlling the elongation rate within the control range rather than to a fixed target value.
In skin pass rolling, the average deformation resistance change accompanying rolling speed changes is large, and without feedforward control, elongation rate fluctuations will increase, possibly exceeding the control range. As described in the Introduction, when a strict physical model is used to predict rolling force in feedforward control, the calculation load and adjustment load become problems. However, the prediction accuracy of simple models is inadequate. Therefore, this paper proposes a feedforward control method without a physical model, using the rolling force change during acceleration/deceleration quantified from past operational results and the relationship between the change of deformation resistance (yield point change) and change of rolling speed identified in advance by experiments.
In this chapter, Section 3.1 describes the dynamic model of a skin pass mill, Section 3.2 explains the optimal control method using a model, and Section 3.3 presents a feedforward control method that suppresses fluctuations of the elongation rate during acceleration and deceleration.
3.1. Dynamic Model of Controlled Object
The controlled object is a multiple input/output system in which the MVs are the references of leveling change Δu1[μm], bending force change Δu2 [kN], and rolling force change Δu3 [kN], and the controlled variables are flatness change Δy1,Δy2,…,ΔyN [I-unit] (N channels corresponding to width position) and elongation change ΔyN+1 [%]. This system can be modeled by the transfer function matrix G(s) described as (1), which has a first-order transfer function at each element.
|
ΔY(s)=G(s)ΔU(s)=[
g
1.1
T
1
s+1
g
1.2
T
2
s+1
g
1.3
T
3
s+1
⋮
⋮
⋮
g
N.1
T
1
s+1
g
N.2
T
2
s+1
g
N.3
T
3
s+1
h
1
T
1
s+1
h
2
T
2
s+1
h
3
T
3
s+1
]ΔU(s).
| (1) |
Here, ΔY(s) and ΔU(s) are the output vector and input vector expressed by the following equations, respectively, and s means a Laplace operator.
|
ΔY(s)=
[
Δ
y
1
(s) Δ
y
2
(s)⋯Δ
y
N
(s) Δ
y
N+1
(s)
]
T
|
|
ΔU(s)=
[
Δ
u
1
(s) Δ
u
2
(s) Δ
u
3
(s)
]
T
|
where,
gj,i (
i = 1,2,3,
j = 1,2,…
N) in
G(
s) represents the influence coefficient of the MV on flatness,
hi (
i = 1,2,3) represents the influence coefficient of the MV on the elongation rate, and
Ti (
i = 1,2,3) represents the time constant. The variable
i (1 ≤ i ≤ 3) is an index corresponding to the reference of leveling change, bending force change, and rolling force change in ascending order.
The outputs (flatness and elongation) reach the steady states on the sample point when the inputs are discrete time inputs which are constant in the sample period Ts, and Ts is sufficiently longer than the time constant of the controlled object. Therefore, (1) can be expressed by a discrete time model using the output vector ΔY(k), input vector ΔU(k), and gain matrix G′, as shown in (2).
|
ΔY(k+1)=
G
′
ΔU(k)=[
g
1,1
g
1,2
g
1,3
⋮
⋮
⋮
g
N,1
g
N,2
g
N,3
h
1
h
2
h
3
]ΔU(k)
| (2) |
where,
|
ΔY(k)=
[
Δ
y
1
(k) Δ
y
2
(k)⋯Δ
y
N
(k) Δ
y
N+1
(k)
]
T
|
|
ΔU(k)=
[
Δ
u
1
(k) Δ
u
2
(k) Δ
u
3
(k)
]
T
|
This section proposes the optimal flatness feedback control method using the model described by (2). As a problem of the conventional method, since the target elongation rate is fixed, the rolling force required to achieve the target value affects work roll deflection, possibly affecting flatness controllability. In the proposed method, the quadratic programming problem is solved at each time step to obtain the optimal MVs which minimize the objective function composed of the sum of squares of deviations between the flatness after one control period and the target value under constraints described by linear inequalities such as the control range of elongation and thickness. Flatness prediction is executed based on the model shown as (2), and the obtained MVs are applied to the system. The rolling force manipulation is calculated under the constraint of the control range of the elongation rate to optimize flatness in the objective function. Physically, this is equivalent to setting the rolling force in consideration of the effect of work roll deflection on flatness and the elongation rate control range.
Next, the objective function and constraints of the quadratic programming problem of this optimal control are described.
3.2.1. Objective Function
The objective function shown as (3) consists of the control deviation of flatness and elongation and terms for evaluating the inputs.
|
f=α
∑
i=1
N
(
r
i
-
y
i
-
∑
j=1
3
g
i,j
Δ
u
j
)
2
+β
(
r
N+1
-
y
N+1
-
∑
j=1
3
h
j
Δ
u
j
)
2
+
∑
j=1
3
z
j
Δ
u
j
2
| (3) |
Here, ri (i = 1,2,…,N) and yi (i = 1,2,…,N) represent the target and measured distributions of flatness at the N-divided strip width position, respectively, and rN+1 and yN+1 represent the target and measured values of elongation rate at the present time. α and β are evaluation parameters having values of 0 or more for prioritizing outputs with different units, namely, flatness and elongation. β = 0 is set to evaluate only flatness. zj is a parameter equal to or greater than 0 for suppressing the magnitude of inputs. Although elongation is not included in the objective function, when β = 0, the MVs are determined by the following constraint (c) so that the elongation rate is within the control range.
The standard matrix form of quadratic programming problems is derived from (3). Using G′ and ΔU in (2), the following matrix representation is obtained.
|
f=
(R-Y-
G
′
ΔU)
T
Q(R-Y-
G
′
ΔU)+Δ
U
T
RΔU
=
1
2
Δ
U
T
(2
G
′
T
Q
G
′
+2R)ΔU-2
(R-Y)
T
Q
G
′
ΔU
+
(R-Y)
T
Q(R-Y)
|
Here, R = [r1 r2 … rN rN+1]T and Y = [y1 y2 … yN yN+1]T are vectors of the target value and measured output. Q(N+1)×(N+1) = diag(α,…,α,β) is a diagonal matrix in which the diagonal elements are parameters.
Since the third term is unrelated to minimization, the following objective function f′ should be minimized.
|
f
′
=
1
2
Δ
U
T
(2
G
′
T
Q
G
′
+2R)ΔU-2
(R-Y)
T
Q
G
′
ΔU
|
The position and velocity constraints of the MVs and constraints related to the elongation rate and thickness are shown below.
(a) Position Constraints of MVs
|
b
i
LL
≤
u
i
Act
+Δ
u
i
≤
b
i
UL
, i=1,2,3
|
where,
u
i
Act
represents the measured value of MV, and
b
i
UL
and
b
i
LL
represent the upper and lower limits, respectively. These constraints are summarized by the following matrix representation (4).
|
[
1
0
0
-1
0
0
0
1
0
0
-1
0
0
0
1
0
0
-1
][
Δ
u
1
Δ
u
2
Δ
u
3
]≤[
b
1
UL
-
u
1
Act
-
b
1
LL
+
u
1
Act
b
2
UL
-
u
2
Act
-
b
2
LL
+
u
2
Act
b
3
UL
-
u
3
Act
-
b
3
LL
+
u
3
Act
]
| (4) |
(b) Velocity Constraints of MVs
|
-
b
i
ΔUL
≤Δ
u
i
/
T
s
≤
b
i
ΔUL
, i=1,2,3
|
where,
b
i
ΔUL
is a positive value representing the velocity constraint of a MV and
Ts represents the control period. These constraints are summarized by matrix representation (5).
|
[
1
0
0
-1
0
0
0
1
0
0
-1
0
0
0
1
0
0
-1
][
Δ
u
1
Δ
u
2
Δ
u
3
]≤[
T
s
b
1
ΔUL
T
s
b
1
ΔUL
T
s
b
2
ΔUL
T
s
b
2
ΔUL
T
s
b
3
ΔUL
T
s
b
3
ΔUL
]
| (5) |
(c) Elongation Rate Constraints
|
b
eLL
≤
y
N+1
+
∑
i=1
3
h
i
Δ
u
i
≤
b
eUL
|
where,
yN+1 represents the measured elongation rate, and
beUL and
beLL represent the upper and lower limits. The constraints can be expressed as (6).
|
[
h
1
h
2
h
3
-
h
1
-
h
2
-
h
3
][
Δ
u
1
Δ
u
2
Δ
u
3
]≤[
b
eUL
-
y
N+1
-
b
eLL
+
y
N+1
]
| (6) |
(d) Thickness Constraints
To obtain the thickness constraints, first, the relationship between the elongation rate and thickness shown as (7) is considered.
|
e=
h
in
-
h
out
h
out
×100
| (7) |
where,
hin and
hout are the thickness at the mill entry and exit sides, respectively. Then, (7) is partially differentiated by
hout to obtain (8).
|
∂e
∂
h
out
=
-
h
in
h
out
2
×100
| (8) |
Using (8), the relationship between the small change of thickness at the exit side Δhout and small change of the elongation rate Δe is obtained as (9).
|
Δe=
∂e
∂
h
out
Δ
h
out
=
-
h
in
h
out
2
×100Δ
h
out
↔Δ
h
out
=-Δe
h
out
2
h
in
1
100
| (9) |
The constraint that the thickness is within the upper and lower limits when the exit thickness changes minutely is expressed as (10).
|
b
hLL
≤
h
out
+Δ
h
out
≤
b
hUL
| (10) |
where,
bhUL and
bhLL represent the upper and lower limits of thickness, respectively. Substituting (9) into (10), the following (11) is obtained.
|
b
hLL
≤
h
out
-Δe
h
out
2
h
in
1
100
≤
b
hUL
| (11) |
Equation (11) can be transformed into the following inequality.
|
-100(
b
hUL
-
h
out
)
h
in
h
out
2
≤Δe≤-100(
b
hLL
-
h
out
)
h
in
h
out
2
|
Since
Δe=
∑
i=1
3
h
i
Δ
u
i
, an inequality which includes Δui is obtained as follows.
|
-100(
b
hUL
-
h
out
)
h
in
h
out
2
≤
∑
i=1
3
h
i
Δ
u
i
≤-100(
b
hLL
-
h
out
)
h
in
h
out
2
|
The matrix representation of this constraint is given by (12).
|
[
h
1
h
2
h
3
-
h
1
-
h
2
-
h
3
][
Δ
u
1
Δ
u
2
Δ
u
3
]≤[
-100(
b
hLL
-
h
out
)
h
in
h
out
2
100(
b
hUL
-
h
out
)
h
in
h
out
2
]
| (12) |
Summarizing (4), (5), (6), and (12), the linear inequality of the matrix form,
AcΔ
U ≤
Bc is obtained. Here,
Ac ∈ R
16×3 and
Bc ∈ R
16×1. This is the constraint of the quadratic programming problem.
3.3. Feedforward Control
The following explains the proposed feedforward control method which suppresses elongation rate fluctuations during acceleration/deceleration without using a physical model. Rolling force appears as a result of changing the roll gap and is used to control the elongation rate to a constant value.
The elongation rate remains constant when the change of the exit thickness during acceleration and deceleration is 0. The variation of rolling force with constant elongation is equal to the variation of rolling force due to the variation of mean deformation resistance (δP = ∂P/∂kmΔkm, where km is mean deformation resistance and Δ is a small variation.). Although Δkm can be quantified by advance experiments, accuracy is a problem when a physical model is used to predict rolling force in skin pass rolling. As mentioned in the Introduction, the rolling force change necessary to obtain the same elongation rate as before a speed change can be determined quantitatively from past operational results, and the rolling force change required to prevent elongation changes during acceleration and deceleration is proportional to the change of mean deformation resistance. Therefore, the rolling force change required in a certain speed region during acceleration/deceleration is obtained by multiplying the rolling force change required to obtain the elongation rate before a speed change by the ratio of the average deformation resistance change in a certain speed region and the average deformation resistance change before/after the speed change. Since the strain rate is essentially proportional to the rolling speed in skin pass rolling, the relationship between the lower yield point and strain rate in Fig. 4 can be converted to the relationship between the lower yield point and rolling speed. Here, the strain rate range corresponds to the assumed rolling speed range (from low to maximum speed). Furthermore, because the average deformation resistance in skin pass rolling is substantially equal to the lower yield point, the relationship between the lower yield point and rolling speed can be regarded as the relationship between deformation resistance and rolling speed. This completes the information necessary for the proposed feedforward control. The details are described below.

In this control method, the rolling speed range from the low speed at threading to maximum speed is divided into equal intervals, and the rolling force change in each speed interval can be achieved during acceleration or deceleration. (These rolling force changes are obtained by multiplying the rolling force changes from low to maximum speed by the rolling force distribution gain gdi derived from the experimental relationship between the lower yield point and strain rate.) For this purpose, the rolling force change ΔPFF in each control period is calculated by setting the rolling force distribution gain gdi according to the current rolling speed and then multiplying it by the control gain gc (discussed below) and measured acceleration rate αAcc (= (current rolling speed − rolling speed one control period before)/TS)). This is expressed as (13).
|
Δ
P
FF
=
g
c
g
di
α
Acc
| (13) |
(1) Step 1
The designer specifies the rolling force change ΔPv required to suppress elongation rate fluctuations when the rolling speed is increased from low speed to top speed VTOP.
(2) Step 2
The rolling speed section (p intervals) is set. Each interval is set equally, as shown below.
|
ΔV×(i-1)≤
V
i
<ΔV×i, i=1,2,⋯p
|
(3) Step 3
Using the relationship between the lower yield point and strain rate, the rolling force distribution gain gdi in the i−th speed section is set. Since the strain rate and rolling speed are proportional, the lower yield point in the strain rate section corresponding to the equally p-divided rolling speed range is the same as the lower yield point in that rolling speed section.
Therefore, the lower yield point change ΔYSi in the i−th speed section is the difference between the adjacent lower yield points in Fig. 4. This is the relationship between the strain rate and variation of the lower yield point in Fig. 5. The rolling force distribution gain gdi in the i−th speed section is calculated by the following equation.
|
g
di
=ΔY
S
i
/
∑
i=1
p
ΔY
S
i
|
(4) Step 4
When (13) is used, the control gain gc is calculated so that the total sum (ΣΔPFF = gcgdiΣαAcc = gcgdiΔV/Ts) of the rolling force change in the i−th speed section is equal to the rolling force change (ΔPvgdi) set in the i−th speed section. This condition is described by (14). Solving this, gc = ΔPvTs/ΔV is obtained.
|
g
c
g
di
ΔV/
T
s
=Δ
P
v
g
di
| (14) |
When the optimal flatness feedback control and feedforward control are used together, the rolling force change is the sum of the results calculated by the respective controls (Δu3 and ΔPFF).
4. Simulation and Experimental Results
In this chapter, the effectiveness of the proposed method is verified by simulation and experiments.
4.1. Simulation Conditions and Results
The effect of the proposed feedback optimum control method on flatness was evaluated by simulation under the following conditions.
4.1.1. Simulation Conditions
The responses of the proposed method and comparison method are compared when only a step output disturbance, corresponding to setup control error, is applied to flatness and elongation at a constant rolling speed. Under these conditions, feedforward control is invalid.
In the comparison method, the weight given to flatness in objective function α in (3) is 1, the weight given to the elongation rate β is 20000, and the elongation rate is controlled to achieve a target value. In the proposed method, weight β is set to 0 but is controlled to be within the control range by the constraint. After showing effectiveness of the proposed method by an example, the statistical effect was verified by simulation using the flatness and elongation after top end rolling extracted from operational data (number of samples: 150) as initial values.
In this section, the influence coefficient gj,i of the MV on flatness in the simulation model (Eq. (1)) corresponding to the position where the strip width is equi-divided into N (=28) is indicated by the points in Fig. 6, and flatness is controlled at these width positions. The influence coefficients for elongation are h1 = −1.2×10⁻⁵, h2 = 1.32×10⁻⁵, and h3 = 7.04×10⁻⁴. The time constants of (1) are T1 = 0.005, T2 = 0.003, T3 = 0.5, and the control period Ts is 0.1 [s]. The target flatness is 0 [I-unit] at all width positions.
4.1.2. Simulation Results
The flatness control results of the comparison method and proposed method are shown in Fig. 7. The horizontal axis represents the normalized strip width position, and the vertical axis represents flatness. “Initial flatness” means the flatness of the strip top end, “Comparison” is the flatness of the tail end by the comparison method, “Proposed” is the flatness of the tail end by the proposed method, and “Reference” is the target flatness. The flatness results of the proposed method are clearly closer to the target value.

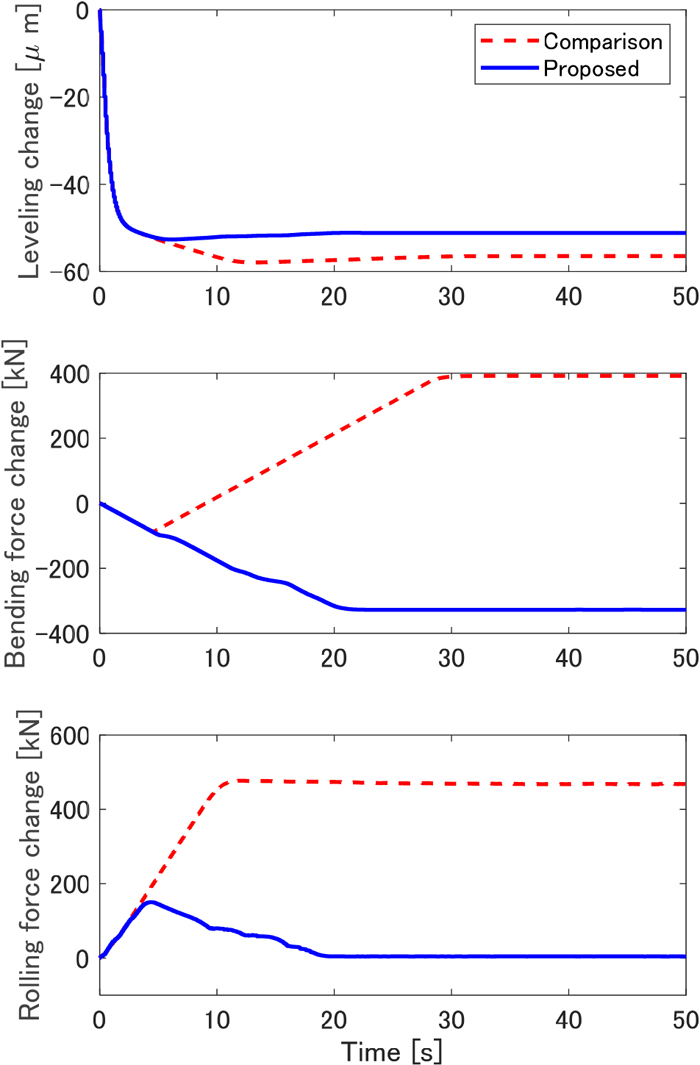
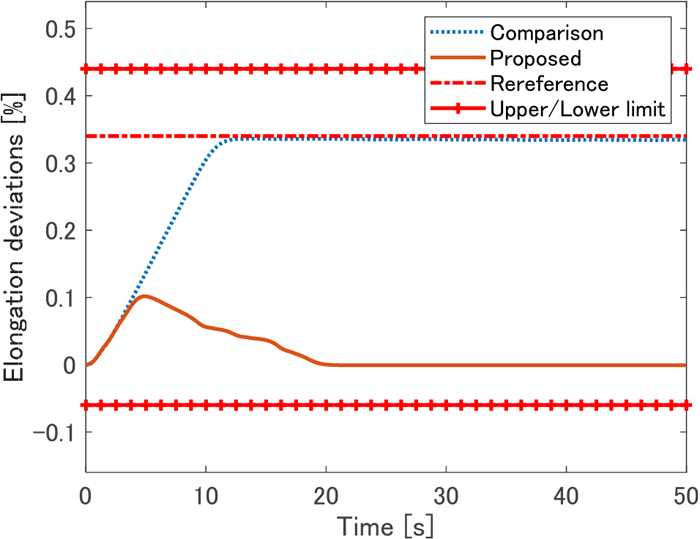
Figure 8 shows the results of elongation rate control by the comparison method and proposed method. The unit of the horizontal axis is seconds (s), and the vertical axis shows the deviations of the elongation rate from the initial value. “Comparison,” “Proposed,” and “Reference” have the same meanings as in Fig. 7, and “Upper/Lower Limit” means the upper and lower limits of the control range. In the comparison method, the elongation rate is controlled to the target value. However, in the proposed method, elongation is controlled to a value within the control range but different from the target value, as this method is based on control within the control range to reduce flatness control error. Figure 9 shows the change of the MVs. In the comparison method, rolling force is increased to control the elongation rate to the target value, and bending force is increased to correct the flatness at this time. In the proposed method, the MVs appear to be changed in the direction that reduces flatness control error.
Next, the reason for the difference in flatness with the comparison method (β = 20000) and proposed method (β = 0) is examined. First, an optimization calculation was performed without imposing constraints. In the calculation that minimized the evaluation function consisting of the sum of squares of the control errors without considering constraints, flatness was 7.8 [I-unit] with the comparison method and 0.0 [I-unit] with the proposed method. From the principle of the optimization calculation, the flatness that can be achieved when constraints are considered is equal to or greater than this value.
It is possible that the difference of the flatness results is due to the constraints. In this control method, constraints are set for each MV, but only the bending force of the comparison method in Fig. 9 reached the constraint (+392 kN). At that time, the flatness (Fig. 7) of the comparison method was 8.1 [I-unit], or slightly larger than the minimum value of 7.8 [I-unit]. Since this difference is small, the effect of the constraints on flatness is considered slight. The difference in flatness by the proposed and comparison methods is thought to be explained as follows: In the comparison method, rolling force is actively changed to control the elongation rate to the target value, and flatness changes accordingly. However, as shown in Fig. 6, the flatness change caused by rolling force change and the flatness change caused by changes in the bending force and leveling position cannot be completely offset due to differences in their effects at the widthwise position. Therefore, if the rolling force change is large, the flatness which cannot be canceled becomes large, and flatness deteriorates. In the proposed method, the MVs are set to minimize flatness control error under the condition that the elongation rate is within the control range. That is, the effect of rolling force changes on flatness is considered in order to reduce flatness changes due to rolling force changes which cannot be offset by changes in the leveling position and bending force, and as a result, flatness is improved.
Next, the statistical results using operational data (number of samples: 150) are presented. The histogram of the flatness improvement rate is shown in Fig. 10, when the flatness evaluation value is the maximum value of flatness at a width position after control, and the improvement rate [%] is defined by (Flatness by comparison method – Flatness by proposed method)/Flatness by comparison method × 100. In this data, the average degree of improvement was 17%.
The simulation described above verified the validity of the proposed optimum feedback control method.
4.2. Experimental Results
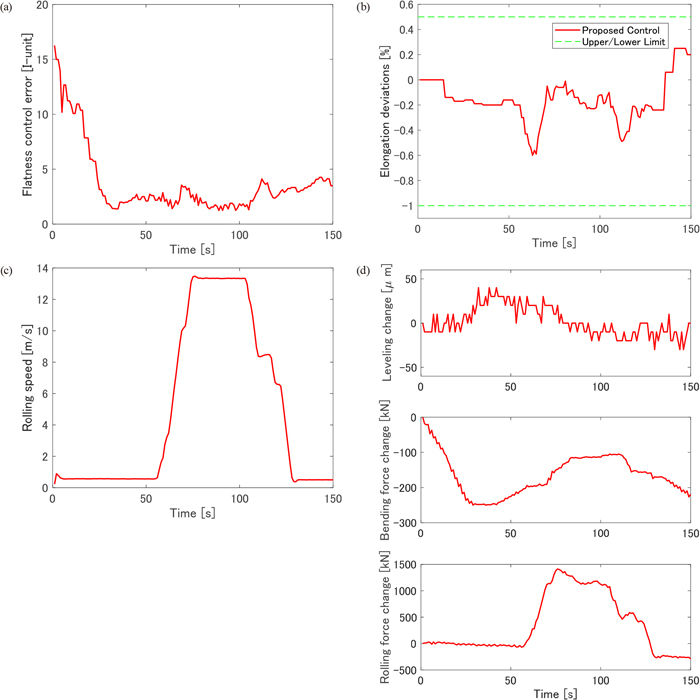
The effectiveness of the proposed method was verified experimentally. Figures 11(a)–11(d) show an example of the flatness control error, elongation deviation, rolling speed, and MV change (rolled strip: entry thickness 2.6 mm, strip width: 1225 mm, mild steel). Flatness control error is the maximum error among the values of N widthwise channels in each control period. As shown in Fig. 11(a), the measured flatness error was reduced from an initial value of around 15 [I-unit] to about 3 [I-unit], demonstrating that the proposed method is effective for flatness improvement. The elongation rate shown in Fig. 11(b) is within the control range.
The effectiveness of the proposed method was verified statistically by comparison with the comparison method, in which elongation is controlled to a fixed target value. The number of samples was 443 for the proposed method and 50 for the comparison method, and the strips were mild steel with entry thicknesses of 1.5 mm to 2.8 mm and strip widths of 750 mm to 1300 mm.
In the histogram in Fig. 12, the horizontal axis represents flatness normalized by the average flatness by the comparison method. When the average flatness at the strip tail end by the comparison method is fave and the flatness at the tail end of the evaluation object is fi, the evaluation value is fi/fave×100. The vertical axis of the histogram represents the appearance rate (ratio of number of all strips and number of strips within that interval). The average flatness by the proposed method was 78, which was smaller than that by the comparison method (100). The distribution of results by the proposed method was also narrower and less variable than that of the comparison method.

Next, the effectiveness of feedforward control is verified. The experimental results (rolled strip: entry thickness 2.0 mm, width: 1012 mm, mild steel) in Figs. 13(a)–13(c) show the elongation rate, rolling force, and rolling speed, respectively. “Without FF control” and “With FF control” mean non-application and application of feedforward control. Without FF control, the elongation rate decreases greatly during acceleration because the stability of the control system must be guaranteed by the optimal feedback control even in case of model error, and rolling force correction is slow because the velocity constraints of the MVs are set narrowly. With FF control, rolling force is corrected quickly and elongation rate fluctuations are small.
As shown here, the proposed control method reduces elongation rate fluctuations during rolling speed changes and prevents violations of the elongation rate control range, ensuring product material characteristics.
5. Conclusions
This paper proposed a dynamic control method which improves flatness and suppresses elongation rate fluctuations. Its effectiveness was verified by simulation and experiments.
5.1. Optimal Flatness Feedback Control
Even if the elongation rate does not achieve the target value, product quality can be ensured if elongation is controlled within the control range. Therefore, we proposed an optimal control method for improving flatness control performance by controlling the elongation rate to within the control range rather than to a fixed target value. In this control method, rolling force manipulation is set in consideration of flatness.
5.2. Feedforward Control to Suppress Elongation Rate Fluctuations
A feedforward control method which does not require a physical model was also proposed. This technique utilizes rolling force changes during acceleration/deceleration, which can be quantified from past operational results, and the relationship between deformation resistance change and rolling speed changes identified in advance by experiments. This makes it possible to construct a feedforward control system that can suppress elongation rate fluctuations with a low adjustment load.
Since the proposed optimal control method is based on a model of flatness and elongation, model accuracy influences controllability. For example, when the strength and size of a strip are significantly different from those used to determine the model parameters, the behavior of the controlled variables fluctuates. To improve controllability, it is necessary to provide a mechanism that maintains model accuracy, such as automatic updating of the model influence coefficients based on actual rolling results or calculation of the influence coefficients by FEM analysis to cope with newly rolled strips.
References
- 1) Theory and Practice of Flat Rolling (Revised edition), ed. by Rolling Theory Committee, ISIJ, Tokyo, (2010), 310 (in Japanese).
- 2) A. Bemporad, D. Bernardini, F. A. Cuzzola and A. Spinelli: J. Process Control, 20 (2010), 396.
- 3) J. B. Rawlings: IEEE Control Syst. Mag., 20 (2000), 38.
- 4) T. Sasaki, A. Kishida and A. Odajima: Kawasaki Steel Giho, 3 (1971), 10 (in Japanese).
- 5) K. Matsumoto: Koutai-no-choshitsu-atsuen-houhou (Temper Rolling Method for the Strip), Japan Patent Tokukai 2001-38401, (2001) (in Japanese).
- 6) T. Ueno and K. Sorao: CAMP-ISIJ, 18 (2005), 329 (in Japanese).
- 7) T. Saito, M. Fukuda, H. Kitamura and M. Kitahama: Proc. 133rd Sosei-Kako Symp., The Japan Society for Technology of Plasticity, Tokyo, (1990), 39 (in Japanese).
- 8) Theory and Practice of Flat Rolling (Revised edition), ed. by Rolling Theory Committee, ISIJ, Tokyo, (2010), 98 (in Japanese).
- 9) I. Hoshino, M. Kawai, M. Kokubo, T. Matsuura, H. Kimura and H. Kimura: IFAC Proc. Vol., 26 (1993), 569.
- 10) F. Nishimura: Sukinpasu-miru-no-nobiritsu-seigyo-houhou (Elongation Rate Control in a Skin Pass Mill), Japan Patent Kokai 62-275514, (1986) (in Japanese).
- 11) K. Mizuno, S. Matsuka, T. Sakurai and S. Kitani: Hitachi Hyoron, 53 (1971), No. 8, 746 (in Japanese).
- 12) Y. Umakoshi and A. Aizawa: Kinzokutai-no-choshitsu-atsuen-houhou (Temper Rolling Method for the Strip), Japan Patent Tokukai 2002-224726, (2002) (in Japanese).