Abstract
The knowledge of P2O5 activities in solid solutions between Ca2SiO4 and Ca3P2O8 is required for more effective dephosphorization. In the present study, firstly, the P2O5 activities in these solid solutions coexisting with CaO or CaSiO3 at 1573 K were measured by equilibrating molten copper with oxide phases under a stream of Ar + H2 + H2O gas mixtures. Subsequently, the sub-regular solution model was applied to Ca2SiO4–Ca3P2O8 solid solutions. The P2O5 activities calculated with the solution model agreed well with the present experimental results and the literature data. It was found that the P2O5 activity in Ca2SiO4–Ca3P2O8 solid solution coexisting with CaO was about 7 digits lower than that coexisting with CaSiO3.
1. Introduction
The dephosphorization reaction in steelmaking processes can be formulated by
|
2
[P]
Fe
+5
(FeO)
slag
=
(
P
2
O
5
)
slag
+5{Fe}
| (1) |
, where [P]
Fe is phosphorus in liquid iron, (FeO)
slag and (P
2O
5)
slag represent FeO and P
2O
5 in slag, respectively, and {Fe} indicates liquid iron. According to Le Chatelier’s principle, the thermochemical conditions for effective dephosphorization are low P
2O
5 activity, high FeO activity, and low temperature. In order to decrease P
2O
5 activities in slags, CaO is added, and then P
2O
5 often is present in solid solutions between di-calcium silicate, Ca
2SiO
4, and tri-calcium phosphate, Ca
3P
2O
8,
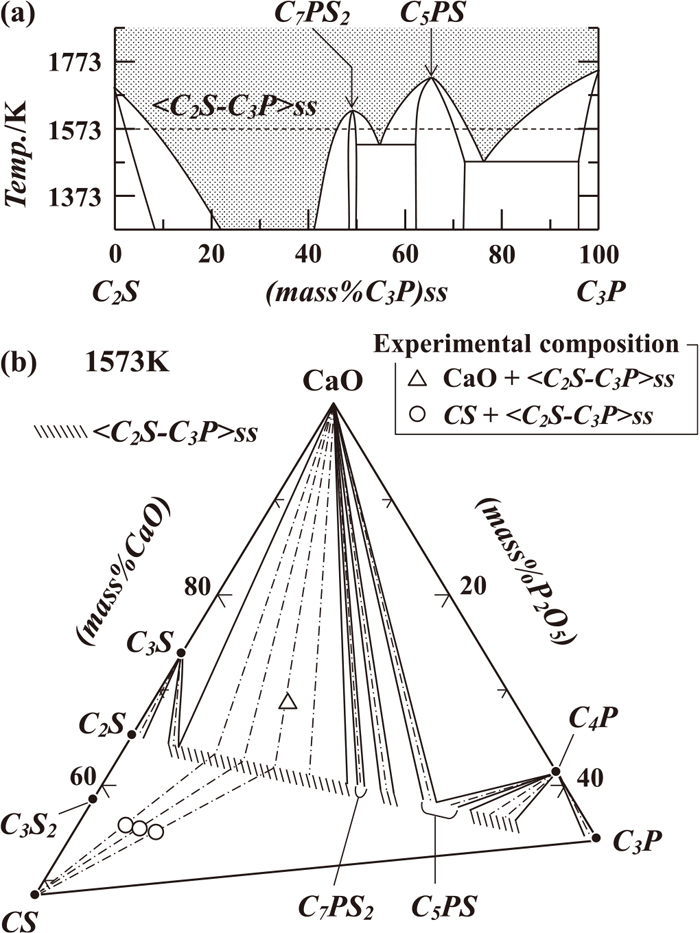
1) as seen in
Fig. 1(a); the pseudo-binary phase diagram of Ca
2SiO
4 and Ca
3P
2O
5 reported by Fix
et al.2) Hereafter, the following abbreviations are used.
|
C
3
S=C
a
3
Si
O
5
=3CaO⋅Si
O
2
C
2
S=C
a
2
Si
O
4
=2CaO⋅Si
O
2
C
3
S
2
=C
a
3
S
i
2
O
7
=3CaO⋅2Si
O
2
CS=CaSi
O
3
=CaO⋅Si
O
2
C
4
P=C
a
4
P
2
O
9
=4CaO⋅
P
2
O
5
C
3
P=C
a
3
P
2
O
8
=3CaO⋅
P
2
O
5
<
C
2
S-
C
3
P>ss=solid solution between C
a
2
Si
O
4
and C
a
3
P
2
O
8
C
7
P
S
2
=C
a
7
P
2
S
i
2
O
16
=7CaO⋅
P
2
O
5
⋅2Si
O
2
C
5
PS=C
a
5
P
2
Si
O
12
=5CaO⋅
P
2
O
5
⋅Si
O
2
|
Based on this consideration, a number of investigations have been conducted to determine activities of P
2O
5 in dephosphorization slags.
Figure 1(b) gives the phase relationship in the region of CaO–CaSiO3–Ca3P2O8 of the ternary system CaO–SiO2–P2O5 at 1573 K.3) The thermochemical data on the formations of C4P and C3P from CaO and P2O5 have been reported as
|
4 CaO+
P
2
O
5
=
C
4
P
| (2) |
|
log K(2)=log
a
C
4
P
-4 log
a
CaO
-log
a
P
2
O
5
=25.18 at 1 573
K
| (3) 4,5) |
|
3 CaO+
P
2
O
5
=
C
3
P
| (4) |
|
log K(4)=log
a
C
3
P
-3 log
a
CaO
-log
a
P
2
O
5
=24.80 at 1 573 K
| (5) 4,5,6) |
By using
Eqs. (3) and
(5), the P
2O
5 activities,
aP2O5, in the three-phase region of CaO +
C5PS +
C4P and the two-phase assemblage of
C4P +
C3P could be derived as follows, respectively.
|
region of CaO+
C
5
PS+
C
4
P
log
a
P
2
O
5
=-log K(2)=-25.18 at 1 573 K
| (6) |
|
region of
C
4
P+
C
3
P
log
a
P
2
O
5
=3log K(2)-4 log K(4)=-23.66 at 1 573 K
| (7) |
Takeshita et al. measured aP2O5 in the three-phase region of C3S + C2S + <C2S–C3P>ss through a gas equilibrium method, in which molten copper containing phosphorus was coexisted with oxides under a stream of Ar + H2 + H2O gas mixtures.7) The result was given as
|
region of
C
3
S+
C
2
S+<
C
2
S-
C
3
P>ss
log
a
P
2
O
5
=-26.53 at 1 573 K
| (8) |
At higher temperatures than 1573 K, Zhong
et al. measured the P
2O
5 activities in
<C2S–
C3P>
ss at 1823 K and 1873 K by equilibrating phosphorus-containing iron with solid solutions in oxygen partial pressures controlled by CO + CO
2 gas mixtures.
8,9,10)
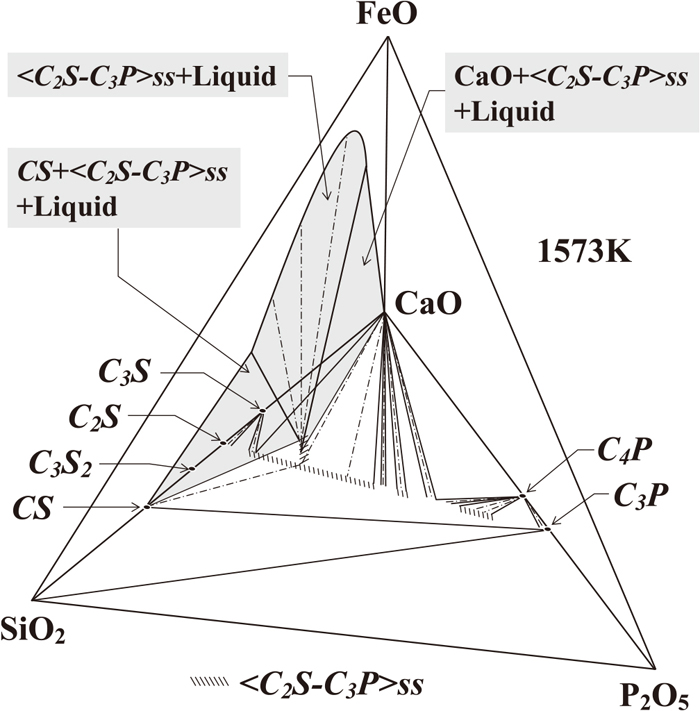
Figure 2 is a schematic diagram of the phase relationship in the CaO–SiO2–P2O5–FeO quaternary system at 1573 K. The base CaO–SiO2–P2O5 of this tetrahedron represents the phase diagram of the corresponding ternary system at 1573 K. It has been reported by Uchida et al. that there was the three-phase region of SiO2 + CS + C3P.11,12) By combining Eq. (5) and the thermochemical data on the formation of CS given in Eq. (10), the P2O5 activity could be derived as follows.
|
log K(9)=log
a
CS
-log
a
CaO
-log
a
Si
O
2
=2.92 at 1 573 K
| (10) 13,14) |
|
region of Si
O
2
+CS+
C
3
P
log
a
P
2
O
5
=log
a
C
3
P
-3log
a
CaO
-log K(4)
=-3[-log K(9)]-log K(4)=-16.04 at 1 573 K
| (11) |
When iron oxide was added to the CaO–SiO
2–P
2O
5 ternary slags,
<C2S–
C3P>
ss could coexist with quaternary liquid phase, hereafter represented as “Liquid”. Matsugi
et al. determined simultaneously the activities of P
2O
5 and FeO in the three-phase region of
CS +
<C2S–
C3P>
ss + Liquid at 1573 K by employing electrochemical technique incorporating MgO-stabilized zirconia.
15) Pahlevani
et al. calculated the P
2O
5 activities in the two-phase region of
<C2S–
C3P>
ss + Liquid at 1573 K by applying the regular solution model to Liquid.
16) For better understanding of dephosphorization reaction, the knowledge of P
2O
5 activities in
<C2S–
C3P>
ss would be necessary, whereas there has been still lack of data measured at temperature of hot metal processing. In this study, firstly, the activities of P
2O
5 were measured in
<C2S–
C3P>
ss at 1573 K to investigate the effects of coexisting solid phases,
i.e., CaO or
CS, on the P
2O
5 activities. Subsequently, the parameters in the sub-regular solution model applied to
<C2S–
C3P>
ss were optimized by using the experimental data to discuss the thermochemical properties in the CaO–SiO
2–P
2O
5 ternary system.
2. Experimental Aspects
2.1. Principle of Measurements
In order to determine the P2O5 activities in the heterogeneous slags, molten copper was brought into equilibrium with oxide mixtures under a stream of Ar + H2 + H2O gas mixtures. The reaction underlying the present study can be formulated as
|
2
[P]
Cu
+5
H
2
O(gas)=
(
P
2
O
5
)
slag
+5
H
2
(gas)
| (12) |
, where [P]
Cu and (P
2O
5)
slag denote phosphorus in liquid copper and P
2O
5 in slag, respectively. The Gibbs energy change for the dissolution of gaseous phosphorus into liquid copper at 1 mass% solution was reported as
|
(1/2)
P
2
(gas)=
[P]
Cu
| (13) |
|
ΔG°(13)/J⋅
mol
-1
=-125 000+0.54
(T/K)
| (14) 17) |
The standard Gibbs energy changes for the following reactions were also available in the literature.
|
P
2
(gas)+(5/2)
O
2
(gas)=
P
2
O
5
(liquid)
| (15) |
|
ΔG°(15)/J⋅
mol
-1
=-1 534 500+506.3
(T/K)
| (16) 4) |
|
H
2
(gas)+(1/2)
O
2
(gas)=
H
2
O(gas)
| (17) |
|
ΔG°(17)/J⋅
mol
-1
=-246 000+54.8
(T/K)
| (18) 18) |
Hence, by combining
Eqs. (14),
(16) and
(18), the equilibrium constant for reaction (12) at 1573 K is given by
|
log K(12)=5 log(
P
H
2
/
P
H
2
O
)+log
a
P
2
O
5
-2 log
h
P
=-10.34 at 1 573 K
| (19) |
In
Eq. (19), the standard state of the P
2O
5 activity is taken to be pure hypothetical liquid P
2O
5. At low phosphorus concentrations, the Henrian activity of phosphorus in liquid copper,
hP, would be equal to the phosphorus concentration in mass percent, [
mass%
P]
Cu, Therefore,
Eq. (19) can be rewritten by
|
log
a
P
2
O
5
=-5 log(
P
H
2
/
P
H
2
O
)
+2 log[mass%P
]
Cu
-10.34 at 1 573 K
| (20) |
indicates that the values for
aP2O5 at 1573 K can be determined by analyzing [
mass%
P]
Cu in liquid copper equilibrated with the heterogeneous slags under a stream of Ar + H
2 + H
2O gas mixtures in which
PH2/
PH2O ratios are fixed.
2.2. Experimental Apparatus and Procedure
The preparation of CaO is based upon heating CaCO3 at 1273 K for 12 hours. C3P and SiO2 were obtained from Nacalai Tesque, Inc., Kyoto, Japan, and dried at 413 K. C2S and CS were obtained by mixing requisite portions of CaCO3 and SiO2, and then heating at 1573 K for 24 hours and 98 hours, respectively. The solid solutions, <C2S–C3P>ss, were prepared by mixing C2S and C3P, and heating at 1573 K for 24 hours. The starting materials thus obtained were mixed to yield the bulk compositions listed in Table 1. In this table and hereafter, (mass%C3P)SS represents the C3P concentration in <C2S–C3P>ss. The oxide mixtures used in this study occurred at the two-phase regions of CaO + <C2S–C3P>ss and CS + <C2S–C3P>ss, illustrated in Fig. 1(b).
Table 1. Experimental conditions and results at 1573 K.
| Region | Bulk composition (mass%) | (mass%C3P)ss | PH2 (atm) | PH2O (atm) | [mass%P]Cu | log aP2O5 |
|---|
| CaO | SiO2 | P2O5 |
|---|
| CaO + <C2S–C3P>ss | 68.75 | 19.64 | 11.60 | 31 | 1.20×10⁻¹ | 2.23×10⁻⁴ | 0.064 ±0.004 | −26.43 ±0.05 |
| CS + <C2S–C3P>ss | 55.72 | 40.16 | 4.12 | 18 | 1.20×10⁻¹ | 8.53×10⁻³ | 0.015 ±0.002 | −19.73 ±0.10 |
| 55.39 | 39.12 | 5.49 | 24 | 1.20×10⁻¹ | 8.53×10⁻³ | 0.017 ±0.002 | −19.62 ±0.09 |
| 550.1 | 37.90 | 7.09 | 31 | 1.20×10⁻¹ | 8.53×10⁻³ | 0.021 ±0.004 | −19.44 ±0.15 |
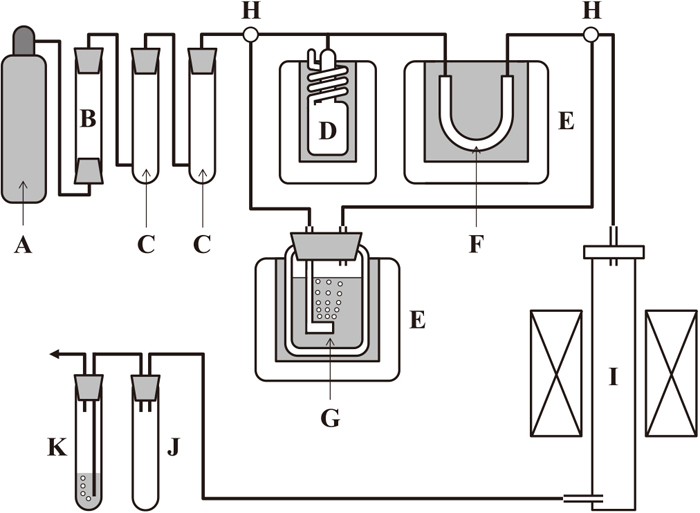
The experimental apparatus and associated gas trains, respectively, are schematically shown in Figs. 3 and 4. A SiC resistance furnace was equipped with a mullite reaction tube of 60-mm o.d., 50-mm i.d. and 1000-mm in length. About 1-g of pure copper and about 0.6-g of the oxide mixtures were charged in alumina crucibles of 10-mm o.d., 8-mm i.d. and 30-mm in height. Seven crucibles were put into a nickel container of 38-mm o.d., 32-mm i.d. and 63-mm in height. This container was suspended from the furnace top via a nickel rod of 3-mm diameter and heated up to 1573 K. Within the crucibles, copper was placed between the oxide mixtures, as shown in Fig. 3. The oxide mixtures, initially placed beneath the copper, did not rise up to the top of the molten copper surface. This arrangement was conducted to increase the contact area between oxide and copper. The oxide mixture on liquid copper was powdery and its thickness was about 2-mm; it would not prevent the contact between liquid copper and gas phase. In the experimental runs, the gas mixtures of Ar + H2 + H2O were introduced into the reaction tube at a flow rate of 200 mL/min.

Temperatures were measured with a Pt-PtRh13 thermocouple placed beside the nickel container, and controlled to ±1 K by using a control thermocouple and a PID-type temperature regulator. The overall errors in temperature measurements and control were estimated to be less than ±2 K.
The two-phase oxide of CaO + <C2S–C3P>ss was brought into equilibrium with Cu–P alloys under a stream of the Ar + H2 + H2O gas mixture prepared by passing Ar + 12%H2 gas mixture through C2H2O4·2H2O + C2H2O4 mixture kept at 268 K within a thermostat bath. The equilibrium partial pressure of H2O fixed by this two-phase mixture has been reported elsewhere;19)
|
log(
P
H
2
O
/atm)=6.88-2 810/(T/K) T<293 K
| (21) |
The water vapor pressures used in this study were much lower than those obtainable through the conventional technique. Thus, the Ar + H
2 gas mixture has to be rigidly moisture-free; the gas trains for Ar + H
2 gas mixture contained silica gel, phosphorus pentoxide and a cold trap kept below 223 K, as illustrated in
Fig. 4.
On the other hand, in the case of the two-phase oxide mixtures of CS + <C2S–C3P>ss, the Ar + H2 + H2O gas mixture was prepared by passing Ar + 12%H2 gas mixture through LiCl·2H2O-saturated water kept at 313 K. The equilibrium H2O partial pressure of LiCl·2H2O-saturated water has been also reported elsewhere;19)
|
log(
P
H
2
O
/atm)=5.94-2 510/(T/K) T>291.5 K
| (22) |
The experimental conditions are summarized in
Table 1.
After the furnace was kept at the experimental temperature for 22 hours, the nickel container was lowered onto the bottom of the water-cooled brass flange inside the furnace tube. The oxide mixtures were then removed from the alumina crucibles, ground and subsequently charged again into the crucibles for repeated durations. These procedures were repeated at an interval of 22 hours. In this study, these procedures were essential, because neither metal nor oxide phases could be agitated during experimental runs. Any unexpected reactions could not be observed between the oxide mixtures and alumina crucibles.
For analyzing phosphorus contents in copper, samples were dissolved in HCl + HNO3 solution. In order to separate copper and phosphorus, ammonium phosphor-molybdate was precipitated from the solution by addition of ammonium molybdate. After being filtered, the precipitate was dissolved in NaOH solution, and subsequently phosphorus was analyzed with an inductive-coupled plasma spectrometer.
3. Experimental Results and Discussion
3.1. Activity Measurements
Figure 5 gives a typical relation between phosphorus content in liquid copper coexisting with oxide mixture of CS + <C2S–C3P>ss of (mass%C3P)SS = 31 and duration at 1573 K. Although there were experimental variations, the equilibrium value for [mass%P]Cu could be obtained if the experiment was continued for 120 hours and more. Taking the mass balance of phosphorus between oxide and metallic phases into account, the change of C3P concentration in <C2S–C3P>ss could be estimated to be less than 0.3-mass%.
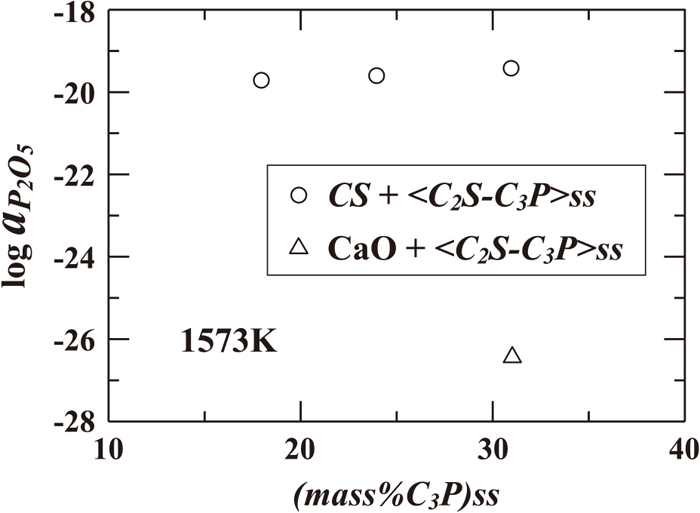
The experimental results are summarized in Table 1, and Fig. 6 shows the P2O5 activities at 1573 K plotted against (mass%C3P)SS. The P2O5 activity in the two-phase region of CS + <C2S–C3P>ss increased with an increase in (mass%C3P)SS. In this two-phase region, the reactions expressed by Eqs. (4), (9) and (23) achieved the equilibrium states.
|
2 CaO+Si
O
2
=
C
2
S
| (23) |
|
log K(23)=log
a
C
2
S
-2 log
a
CaO
-log
a
Si
O
2
=4.78 at 1 573 K
| (24) 13,14) |
By combining
Eqs. (5),
(10) and
(24), we obtained
|
log
a
P
2
O
5
=log
a
C
3
P
-3 log
a
C
2
S
-19.22 at 1 573 K
| (25) |
indicated that the P
2O
5 activity in
<C2S–
C3P>
ss coexisting with
CS increased as (
mass%
C3P)
SS increased at a constant temperature, due to an increase in the
C3P activity and a decrease in the
C2S activity. Therefore, the relationship between
aP2O5 and (
mass%
C3P)
SS illustrated in
Fig. 6 was thermodynamically consistent with
Eq. (25).
Figure 6 also shows that aP2O5 in the two-phase region of CaO + <C2S–C3P>ss is about 7 digits lower than that in the two-phase region of CS + <C2S–C3P>ss at the same C3P content in <C2S–C3P>ss. The thermodynamic consistency of this behavior was discussed based on the comparisons of the CaO and SiO2 activities in the CaO–SiO2–P2O5 ternary system derived by using the present experimental results with those in the CaO–SiO2 binary system, described as follows.
The P2O5 activities measured in this study are given in cells (b) and (h) of Table 2. Considering the experimental conditions, the activities of CaO and CS are unity in cells (a) and (j), respectively. Therefore, by inserting the activities of CaO and P2O5 into Eq. (5), we can obtain
|
log
a
C
3
P
(cell e)=log K(4)+3 log
a
CaO
(cell a)
+log
a
P
2
O
5
(cell b)
=24.80+3×0+(-26.43)=-1.63
| (26) |
Now, it can be assumed that the
C3P activity remains constant in
<C2S–
C3P>
ss of (
mass%
C3P)
SS = 31, whether
<C2S–
C3P>
ss coexists with CaO or
CS.
|
log
a
C
3
P
(cell k)=log
a
C
3
P
(cell e)=-1.63
| (27) |
Then, the followings are obtainable from
Eqs. (5),
(10),
(24) and
(27).
|
log
a
CaO
(cell g)
=[log
a
C
3
P
(cell k)-log K(4)-log
a
P
2
O
5
(cell h)]/3
=[(-1.63)-24.80-(-19.44)]/3=-2.33
| (28) |
|
log
a
Si
O
2
(cell i)
=log
a
CS
(cell j)-log
a
CaO
(cell g)-log K(9)
=0-(-2.33)-2.92=-0.59
| (29) |
|
log
a
C
2
S
(cell l)
=2 log
a
CaO
(cell g)+log
a
Si
O
2
(cell i)+log K(23)
=2×(-2.33)+(-0.59)+4.78=-0.47
| (30) |
It can be assumed again that the
C2S activity is constant in
<C2S–
C3P>
ss of (
mass%
C3P)
SS = 31.
|
log
a
C
2
S
(cell f)=log
a
C
2
S
(cell l)=-0.47
| (31) |
By using
Eqs. (24) and
(31), we have
|
log
a
Si
O
2
(cell c)
=log
a
C
2
S
(cell f)-2 log
a
CaO
(cell a)-log K(23)
=(-0.47)-2×0-4.78=-5.25
| (32) |
On the other hand, the CaO and SiO
2 activities in the CaO–SiO
2 binary system can be calculated by using the thermodynamic data,
13,14) and are illustrated in
Fig. 7. As seen in this figure, the ranges of the CaO and SiO
2 activities coexisting with
CS at 1573 K are as follows.
|
-2.92≤log
a
CaO
≤-2.07
| (33) |
|
-0.85≤log
a
Si
O
2
≤0
| (34) |
and
(29) were consistent with
Eqs. (33) and
(34), respectively.
Table 2. Calculation results of activities in the CaO–SiO
2–P
2O
5 ternary system at 1573 K.
| Region | (mass%C3P)ss | log aCaO | log aP2O5 | log aSiO2 | log aCS | log aC3P | log aC2S |
|---|
| CaO + <C2S–C3P>ss | 31 | (a) | 0 | (b) | −26.43 | (c) | −5.25 | (d) | – | (e) | −1.63 | (f) | −0.47 |
| CS + <C2S–C3P>ss | 31 | (g) | −2.33 | (h) | −19.44 | (i) | −0.59 | (j) | 0 | (k) | −1.63 | (l) | −0.47 |

As shown in Fig. 1(b), (mass%C3P)SS in the three-phase coexistence of CaO + C3S + <C2S–C3P>ss is lower than 31, and the SiO2 activity in this three-phase region is equal to that in the two-phase region of CaO + C3S; log aSiO2 = −4.81 at 1573 K, seen in Fig. 7, while Table 2 gives log aSiO2 = −5.25 in <C2S–C3P>ss of (mass%C3P)SS = 31 coexisting with CaO. Considering Eq. (24), this result was consistent with the thermochemical consideration that, in the case of coexisting with CaO, the SiO2 activity decreased as the concentration and activity of C2S decreased in <C2S–C3P>ss. As already mentioned above, the CaO and SiO2 activities in Table 2 were derived by using the P2O5 activities measured in this study. Therefore, it could be concluded that the present experimental data were not inconsistent with the phase relationship of the CaO–SiO2–P2O5 ternary system.
3.2. Solution Model Applied to <C2S–C3P>ss
Figure 8(a) shows that <C2S–C3P>ss forms between α-C2S and α-C3P, and it is acceptable that electrically neutral molecules of “(1/2)Ca3P2O8” replace with those of “Ca2SiO4” in solid solutions, as illustrated in Fig. 9. Based on this simple assumption, the present authors suggested the regular solution model applied to <C2S–C3P>ss.20) In this study, the solution model was modified by using the present experimental data.
The substitution ratio of Ca2SiO4 for (1/2)Ca3P2O8, Y, was defined as
|
Y=
n
(1/2)C
a
3
P
2
O
8
/(
n
C
a
2
Si
O
4
+
n
(1/2)C
a
3
P
2
O
8
)
=2
n
C
a
3
P
2
O
8
/(
n
C
a
2
Si
O
4
+2
n
C
a
3
P
2
O
8
)
| (35) |
, where
ni represents the number of moles of chemical species
i in solid solutions. In order to calculate the
C2S and
C3P activities, the sub-regular solution model was applied to
<C2S–
C3P>
ss, formulated as follows.
|
RT ln
a
C
3
P
=2RT ln
a
(1/2)C
a
3
P
2
O
8
=ΔG
°
t
(
C
3
P)+2RTlnY+2A
(1-Y)
3
+2B
(1-Y)
2
| (36) |
|
RT ln
a
C
2
S
=ΔG
°
t
(
C
2
S)+RT ln(1-Y)-A
Y
3
+(
3
2
A+B
)
Y
2
| (37) |
In
Eqs. (36) and
(37),
R is the gas constant,
ΔG
°
t
(i)
represents the Gibbs energy change of the phase transformation of
i, and the parameters
A and
B are independent of composition and temperature. The standard states of
C2S and
C3P are taken to be the most stable forms at 1573 K,
i.e.,
α′-
C2S and
α-
C3P, respectively.
Equations (36) and
(37) satisfy Gibbs-Duhem equation.
The thermal data on C2S, heat capacity and heat of the phase transformation, were available.21) By extrapolating the value for heat capacity of α-C2S,
ΔG
°
t
(
C
2
S)
could be calculated as
|
ΔG
°
t
(
C
2
S)/J⋅
mol
-1
=1 132 at 1 573 K
| (38) |
On the other hand, the heat of the phase transformation between
α-
C3P and
α-
C3P has been reported to be zero.
21)
|
ΔG
°
t
(
C
3
P)/J⋅
mol
-1
=0 at 1 573 K
| (39) |
Namely,
Eqs. (36) and
(37) could be rewritten as
Eqs. (40) and
(41), respectively.
|
log
a
C
3
P
=2log Y+2a
(1-Y)
3
+2b
(1-Y)
2
| (40) |
|
log
a
C
2
S
=3.76×
10
-2
+log(1-Y)-a
Y
3
+(
3
2
a+b
)
Y
2
| (41) |
By combining
Eqs. (5) and
(40), the P
2O
5 activity in
<C2S–
C3P>
ss coexisting with CaO could be given as
|
log
a
P
2
O
5
=log
a
C
3
P
-log K(4)
=2log Y+2a
(1-Y)
3
+2b
(1-Y)
2
-24.80
| (44) |
From
Eqs. (5),
(10),
(24),
(40) and
(41), the P
2O
5 activity in
<C2S–
C3P>
ss coexisting with
CS could be also formulated as
|
log
a
P
2
O
5
=log
a
C
3
P
-3[log K(9)-log K(23)+log
a
C
2
S
]-log K(4)
=-19.22+[2logY+2a
(1-Y)
3
+2b
(1-Y)
2
]
-3[
3.76×
10
-2
+log(1-Y)-a
Y
3
+(
3
2
a+b
)
Y
2
]
| (45) |
The optimization of the values for the parameters
a and
b was conducted by comparing the P
2O
5 activities measured with those calculated from
Eqs. (44) and
(45). Then, we obtained
Figure 8(b) shows the
C3P and
C2S activities calculated as functions of
Y, deviated negatively from Raoult’s law. These behaviors corresponded to the chemical affinity between
C3P and
C2S in solid solutions.
Figure 8(c) illustrates the P2O5 activities at 1573 K in the two-phase regions of CaO + <C2S–C3P>ss, C4P + <C2S–C3P>ss and CS + <C2S–C3P>ss calculated from Eqs. (44), (49), and (45), respectively.
|
3
C
4
P+
P
2
O
5
=4
C
3
P
| (48) |
|
log
a
P
2
O
5
=4 log
a
C
3
P
-4 log K(4)+3 log K(2)
=4[
2logY-9.96×
(1-Y)
3
+4.51×
(1-Y)
2
]
-23.66
| (49) |
Although the P
2O
5 activities were estimated too low in the region of
Y < 0.2, the values for
aP2O5 calculated with the solution model were in good agreement with those in CaO +
<C2S–
C3P>
ss and
CS +
<C2S–
C3P>
ss measured in the present study and those in
C4P +
C3P, CaO +
C5PS +
C4P and SiO
2 +
CS +
C3P derived with the literature data
4,5,6) (With respect to detailed calculation methods, see
introduction).
Figure 8(c) also shows the P2O5 activities in the three-phase region of CS + <C2S–C3P>ss + Liquid15) and the two-phase coexistence of <C2S–C3P>ss + Liquid.16) It could be concluded here that the values for aP2O5 in CS + <C2S–C3P>ss + Liquid were slightly lower than those in CS + <C2S–C3P>ss due to dissolution of iron oxide into <C2S–C3P>ss (See Fig. 2). Considering the chemical affinity between CaO and P2O5, it would be expected that the P2O5 activity decreased with an increase in slag basicity. As seen in Fig. 8(c), the values for aP2O5 in <C2S–C3P>ss + Liquid reported in the literature16) were much higher than those in CaO + <C2S–C3P>ss and were almost equal to those in CS + <C2S–C3P>ss calculated in this study; these results were acceptable. However, the detailed effect of slag basicity on aP2O5 in liquid phase saturated with <C2S–C3P>ss would be our important future subject.
4. Conclusion
For better understanding phosphorus removal from hot metal, the present study was aimed at measuring the P2O5 activities in solid solutions between Ca2SiO4 and Ca3P2O8 coexisting with CaO or CaSiO3 at 1573 K. It was clarified that the P2O5 activity in the two-phase region of CaO + Ca2SiO4–Ca3P2O8 solid solution was about 7 digits lower than that in the two-phase region of CaSiO3 + Ca2SiO4–Ca3P2O8 solid solution. The values for the activities of components determined in this study were consistent with the phase relationship in the CaO–SiO2–P2O5 ternary system. The P2O5 activities calculated with the solution model applied to Ca2SiO4–Ca3P2O8 solid solution were in good agreement with the present experimental results and the literature data.
Acknowledgement
This work was supported by JSPS KAKENHI Grant Number 15K06524.
References
- 1) H. Suito, Y. Hayashida and Y. Takahashi: Tetsu-to-Hagané, 63 (1977), 1252.
- 2) W. Fix, H. Heymann and R. Heinke: J. Am. Ceram. Soc., 52 (1969), 346.
- 3) M. Matsu-sue, M. Hasegawa, K. Fushi-tani and M. Iwase: Steel Res. Int., 78 (2007), 465.
- 4) E. T. Turkdogan and J. Pearson: J. Iron Steel Inst., 175 (1953), 393.
- 5) M. Iwase, H. Fujiwara, E. Ichise, H. Kitaguchi and K. Ashida: Iron Steelmak., 16 (1989), No. 4, 45.
- 6) H. Yama-zoye, E. Ichise, H. Fujiwara and M. Iwase: Trans. Iron Steel Soc. AIME, 13 (1992), 41.
- 7) H. Takeshita, M. Hasegawa, Y. Kashiwaya and M. Iwase: Steel Res. Int., 81 (2010), 100.
- 8) M. Zhong, H. Matsuura and F. Tsukihashi: Mater. Trans., 56 (2015), 1192.
- 9) M. Zhong, H. Matsuura and F. Tsukihashi: ISIJ Int., 55 (2015), 2283.
- 10) M. Zhong, H. Matsuura and F. Tsukihashi: Metall. Mater. Trans. B, 47 (2016), 1745.
- 11) Y. Uchida, N. Sasaki and Y. Miki: ISIJ Int., 58 (2018), 869.
- 12) C. Watanabe and Y. Uchida: CAMP-ISIJ, 33 (2020), 1527 (in Japanese).
- 13) O. Kubaschewski, C. B. Alcock and P. J. Spencer: Materials Thermochemistry, 6th ed., Pergamon Press, Oxford, (1993), 257.
- 14) S. Seetharaman, ed.: Treatise of Process Metallurgy, Vol. 1: Process Fundamentals, Elsevier, Oxford, (2014), 539.
- 15) R. Matsugi, K. Miwa and M. Hasegawa: ISIJ Int., 57 (2017), 1718.
- 16) F. Pahlevani, S. Kitamura, H. Shibata and N. Maruoka: ISIJ Int., 50 (2010), 822.
- 17) M. Iwase, E. Ichise and N. Yamada: Steel Res., 56 (1985), 319.
- 18) O. Kubaschewski and C. B. Alcock: Metallurgical Thermochemistry, 5th ed., Pergamon Press, Oxford, (1979), 380.
- 19) H. Takeshita, M. Hasegawa and M. Iwase: High Temp. Mater. Process., 27 (2008), 19.
- 20) M. Hasegawa, Y. Kashiwaya and M. Iwase: High Temp. Mater. Process., 31 (2012), 421.
- 21) I. Barin: Thermochemical Data for Pure Substances, VCH Verlagsgesellschaft mbH, Weinheim, (1989), 327.