Ironmaking
Numerical Investigation for the Temperature Dependency of Coke Degradation by CO2 Gasification Reaction in a Blast Furnace
2020 Volume 60 Issue 12 Pages 2686-2694
Details
2020 Volume 60 Issue 12 Pages 2686-2694
To quantitatively evaluate the temperature dependency of coke degradation by CO2 gasification reaction in a blast furnace, kinetic analyses of gasification reaction with mass transfer for the coke model with approx. 200 million voxels developed from X-ray CT images at the reaction temperatures of 1373, 1573, 1773 and 1973 K were performed. At high reaction temperature, the gas concentration of CO2 was high in the external area of the coke model, and the coke matrix voxels vanished mainly around the external surface. Distinguishing surface area of interface between a carbon matrix voxel and a pore voxel with the gas concentration of CO2 at a neighbor pore voxel, although the surface area with the high gas concentration of CO2 accounted for the majority of the total surface area at 1373 K, the ratio was lower at over 1573 K than at 1373 K. In addition to this, from the effectiveness factor of catalyst, the initial rate-controlling step was chemical reaction at 1373 K but pore diffusion at over 1573 K. Also, although the frequency distribution of local porosity showed unimodal regardless of the progress of reaction, the standard deviation calculated from the distribution was changed by reaction. The change rate of the standard deviation by reaction seemed to be larger at high reaction temperature than at low reaction temperature. The logarithm of the change rate hardly depended on reaction temperature under 1573 K but was proportional to the inverse of the temperature over 1573 K. This study quantitatively showed that the rate-controlling step affects the coke structure after reaction largely.
Metallurgical coke plays as rolls of a reduction agent, a thermal resource and a spacer keeping a permeability in a blast furnace, and the material with all of these functions is considered to be coke only. For a spacer in a blast furnace, coke with high strength has been used for the blast furnace operation, and the production method of the strong coke has been investigated. In previous studies, the dominant factor of the coke strength was largely distinguished to a strength of coke matrix and a pore structure, and it was especially found that the effect of pore structure was large.1,2,3,4,5) The pore structure was subdivided to the shape of a pore, porosity and the others, and the subdivided factors has been investigated respectively. As the research focusing on the shape, Kubota et al. reported the perimeter of a pore with low circularity in a coke sample and its strength had a negative correlation through the drum strength test of the sample and the observation of the cross section of the sample by an optical microscope.2) Also, Sakimoto et al. proposed the new index which comprises circularity and perimeter of pore and quantitatively indicated a volumetric fracture occurred at the part with thin pore wall.3) For the relationship between the porosity of coke and its strength, Kanai et al. measured porosity and a splitting tensile strength of the coke produced from caking coal with low-quality coal, and, as a result, it was found that the porosity of the coke and its strength had a negative correlation as an overall trend.5) Saito et al. also focused on the size of pore and its circularity and indicated that the strength of the coke with many pores with the size of 1000 mm and low circularity was low.1) From these studies, it was found that one of the dominant factors of coke strength is its pore structure.
The pore structure of coke, which affects its strength most largely, changes by gasification reaction in a blast furnace.6,7,8,9) Xing et al. performed the gasification experiment of coke at the temperature of 1273–1773 K as a condition in a blast furnace and showed that the strength of coke samples decreases as the reaction progresses.10) Moreover, with regarding to the coke sample after reaction, it was reported that the porosity and its strength also has a correlation.11,12) The observation by an optical microscope suggested that this correlation was caused by an increase in the number of connected pores by reaction. As like these studies, coke degrades by gasification reaction in a blast furnace, and then its strength decreases. In addition, Xing et al. also performed petrographic analysis for coke gasified with CO2 at the temperature in a blast furnace (1273–1673 K) and evaluated the change of coke matrices by reaction. As a result, around the external surface of coke, both inert maceral-derived components (IMDC) and reactive maceral-derived components (RMDC) vanished by reaction and seemed not to differ.13) Wang et al. performed the gasification experiment of coke with CO2 or H2O at the reaction temperatures of 1223–1523 K and investigated the change of pore structure by reaction through the measurement of bulk density of coke.14) This result showed that at high temperature, the gasification reaction proceeded more around the external surface than at internal area regardless of the reactant gas. On the other hand, at low temperature, the difference of the structural change between at internal area and around external surface was small. These are because the rate-controlling step differs by reaction temperature. In the research of Wang et al., the porosity decreased more around the external surface than at the internal area in the case of H2O gasification reaction of which reaction rate is larger than that of CO2 gasification reaction. From these previous studies, it was found that coke structure in a blast furnace changes largely by gasification reaction from the one when the coke charged. Therefore, the coke structure after reaction would be affected by gasification reaction rather than the initial structure.
Also, the structural change of coke by reaction has been investigated not only experimentally but also numerically. Iwanaga et al. analyzed mass transfer with gasification reaction for the coke model in which porosity was distributed uniformly and indicated that the gasification reaction occurred mainly around the external surface of coke in the case of high temperature and moreover at the internal area in the case of low temperature.15) Yamaoka et al. carried out the numerical analysis for gasification of coke similar to the study by Iwanaga et al. and showed that the compression strength calculated based on the contact breakage model corresponded with the experimental one.16) In addition, Kashiwaya et al. analyzed the diffusion phenomena of gas in a single pore with the size of micro-meter by using the cellular automaton method and investigated the rate-controlling steps at several reaction temperatures.17) In recent years, the numerical simulation of gasification for the whole of a porous carbon material18,19,20,21) is conducted. Richter et al. solved the convective-diffusion problem with gas-gas and gas-solid reactions for the porous model composed of multiple particles and investigated the gas concentration distribution around the porous model.19) Xue et al. conducted a similar analysis to Richter et al. for the model of a single coal char having several conic pores and evaluated the effect of the size of the model particle on the spatial distribution of reaction rate in the model.20) Moreover, there are the researches in which the pore structure of coal char constructed by X-ray CT was directly reflected into calculation. Fong et al. proposed the numerical simulation method of gasification reaction with mass transfer for the model of a coal char developed from X-ray CT images and compared the result of the model with uniform spatial distribution of porosity.21)
Our research group also conducted the analysis of gasification reaction with mass transfer for the porous model constructed from the X-ray CT images of coke.22,23) In the previous study,22) the porous model was developed from the X-ray CT images of coke, and the kinetic analysis of CO2 gasification reaction with mass transfer for a part of the model. At low reaction temperature, the gas concentration of CO2 distributed uniformly in the whole of the analytical object, and thus the rate-controlling step was chemical reaction. At high reaction temperature, the gas concentration increased toward the external surface, and the rate-controlling step was pore diffusion. Moreover, the pore structure of coke is non-uniform and anisotropic, and thus the kinetic analysis of CO2 gasification reaction with mass transfer for the entire coke model with approx. 200 million voxels developed from X-ray CT images at reaction temperatures of 1373 and 1573 K was conducted.23) In this previous study, the relationship between the rate-controlling step and the coke structure after reaction was investigated, and it was found that the structural change by reaction was affected by the initial structure rather than the gas concentration distribution of CO2. The structural change of coke can be quantitatively characterized by the investigation at higher temperature: rate-controlling step of gas diffusion because the gas concentration distribution of CO2 changes by temperature.
In this study, the kinetic analyses of CO2 gasification with mass transfer for the overall coke model constructed by X-ray CT images at reaction temperatures of 1373, 1573, 1773 and 1973 K were carried out, and the temperature dependency of the structural change of the coke model by gasification reaction was investigated. In detail, focusing on the change in the standard deviation of the local porosity in the coke model by the reaction, the relationship between the structural change and reaction temperature was evaluated.
As the porous model of an analytical object, the same cylindrical coke to the previous study23) was employed. This coke model was developed by stacking the X-ray CT images of coke produced from Goonyella coal in a coke oven with an electric heater. The size, the screen resolution and the slice width were Φ20 × 14, 20.6 μm/pixel and 32 μm, respectively. The analytical object was half of the coke model, and the schematic and focused images were shown in Fig. 1. The number of voxels and the number of divisions for the analytical object were 202, 016, 000 and 950 × 950 × 224 (x × y × z), respectively.

Analytical object developed from the X-ray images of coke with approx. 200 million. The voxels with grayscale represent a coke matrix. (Online version in color.)
Figure 2 showed the spatial distribution and histogram of local porosity in the analytical object. The local porosity was calculated by dividing the analytical object on the basis of different coordinate system as follows: the division numbers for the local porosity were decided from the number of the voxels on the radial and axial directions based on the square-root choice and were 31 and 15 on the radial and height directions. In Fig. 2(a), r, R, h and H represent the distance on the radial direction, diameter, the distance on the height direction and height, respectively. From Fig. 2(a), it was found that the local porosity was slightly different by the position in the analytical object, and the initial structure was non-uniform. In addition, focusing on Fig. 2(b), the frequency distribution of the local porosity showed unimodal, and the overall porosity was 0.457. In addition, the standard deviation was 0.144.

Distribution of local porosity for the analytical object before reaction; (a) Spatial distribution and (b) Frequency distribution. (Online version in color.)
In the pore voxel of the analytical object, mass transfer of CO, CO2 and N2 with CO2 gasification reaction was analyzed. The unsteady-state equation of diffusion shown in Eq. (1) was employed as governing equation.
| (1) |
| (2) |
| (3) |
Here, Mm is the molecular weight of gas species m, T is the gas temperature, P is the total pressure, σave is the collision diameter, and ΩD-ave is the collision integral in the Lennard-Jones potential.23)
2.2.2. Heterogeneous ReactionCO2 gasification reaction was only considered as the heterogeneous reaction at the interface of a carbon matrix and pore. It was assumed that this reaction occurred at the interface between a carbon matrix voxel and a pore or gas phase one. The parameter of the reaction rate was calculated from the equation proposed by Kashiwaya et al.26) in similarity to our previous study.23) Also, the density of a carbon matrix voxel was set to 1400 kg/m3, and the local conversion of a carbon matrix voxel Xlocal was defined as the following equation:
| (4) |
| (5) |
For this calculation, the in-house code (SRPM, Simulator for Reaction of Porous Medium)23) was used. The diffusion term in the governing equation was discretized by the second-order central difference method based on the finite volume method, and the time was developed with the first-order implicit Euler method. The iterative calculation in this calculation was continued until the relative residual reached 10−6 by using AGMG (AGgregation-based algebraic MultiGrid)27,28,29) as a matrix solver of the discretization equation. Here, the relative error was calculated from the discretization equation obtained from the governing equation shown in Eq. (1). Also, the calculation was continued until the overall conversion X reached 0.9. The boundary condition was the same as our previous study.23) Specifically, the gradient at the boundary plane of the center on the height direction was set to zero, and this boundary plane was set to the symmetry plane. For the other boundaries, the mass fractions were prescribed as N2:CO2:CO = 0.5:0.5:0.0 In addition, the analysis was conducted at the constant temperature condition of 1373 K, 1573 K, 1773 K or 1973 K, and the temperature dependency of coke gasification with structural change was investigated. The calculation time of 600 steps at 1373 K and 1573 K were approximately 2 days using 6 CPUs (12 Cores, Intel Xeon® E5-2695v2), and that at 1773 K and 1973 K were approximately 21 hours using 4 CPU (16 cores, Intel Xeon Gold 6148 2.4 GHz).
Figure 3 shows the spatial distribution of the local conversion of a carbon matrix voxel and gas concentration of CO2 in the analytical object. Note that a carbon matrix voxel was changed to a pore voxel when the local conversion became over 0.9 as described in the method section. In a comparison of the spatial distribution of the local conversion with reaction temperature at the same overall conversion, the carbon matrix voxels around the external surface of the analytical object mainly vanished at high temperature. In particular, at the overall conversion of 0.75, the difference by the reaction temperature was remarkable. The spatial distribution of gas concentration of CO2 showed a similar trend. At high temperature, the gas concentration of CO2 was high around the external surface but low at the internal area. This concentration distribution caused the selective vanishment of carbon voxels around the external surface. Therefore, the difference of the structure after reaction by reaction temperature as shown in the previous experimental studies14,30) was numerically expressed.

Comparison of spatial distributions of local conversion and gas concentration of CO2 in the analytical object between different temperatures of 1373, 1573, 1773 and 1973 K. (Online version in color.)
Figure 4 shows the changes in the overall conversion of the overall analytical object with time and overall reaction rate as reaction progresses. In Fig. 4(a), the overall conversion at the same elapsed time was high at high temperature. This is because the reaction rate constant given to a carbon matrix voxel accords to the Arrhenius equation. Also, the overall reaction rate decreased as reaction progressed at every temperature as shown in Fig. 4(b). This change was caused by the change in surface area. Figure 5 shows the change of the surface area with reaction progress at each temperature. Here, the total surface area was the summation of surface areas of the interfaces between a carbon matrix voxel and a pore voxel. At each temperature, the total surface area represented by a black line tended to decrease with the progress of reaction, and the change of the total surface area was similar to that of the overall reaction rate. However, the overall reaction rate at high temperature did not monotonically decrease and showed the maximum value at the middle stage of reaction. This is derived from the change of surface area with high gas concentration of CO2 at the neighbor pore voxel. In Fig. 5, the surface areas classified with the gas concentration of CO2 at the neighbor pore voxel are also shown. At the reaction temperature of 1773 K, the overall conversions with the maximum overall reaction rate and the maximum surface area of the gas concentration of CO2 between 0.4–0.5 were 0.380 and 0.516, respectively. At the reaction temperature of 1973 K, the overall conversions with the maximum overall reaction rate and the maximum surface area of the gas concentration between 0.4–0.5 were 0.298 and 0.319, respectively. Therefore, the maximum value of the overall reaction rate corresponded to that of surface area with high gas concentration of CO2. In addition, at the initial stage, the overall reaction rate of high temperature was larger than that of low temperature regardless though the surface area with high gas concentration of CO2 was smaller at high temperature than at low temperature. This is because the reaction rate constant given to a carbon matrix voxel accords to the Arrhenius equation.
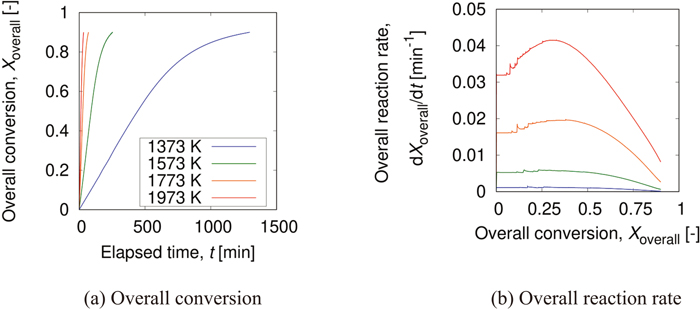
Change of overall conversion and overall reaction rate as the reaction progresses. (Online version in color.)

Change of surface areas at the interfaces between a carbon matrix and gas phase (Online version in color). The surface areas were distinguished by the gas concentration of CO2 at the interface. (Online version in color.)
Also, from the surface area classified by the gas concentration of CO2 in Fig. 5, it was qualitatively found that the rate-controlling step differed by the reaction temperature. At the reaction temperature of 1373 K, the ratio of the surface area with the gas concentration of CO2 between 0.4–0.5 to the total surface area was significantly high, and the tendency did not change by reaction. Over the reaction temperature of 1573 K, the ratio of the surface area with high gas concentration of CO2 was low at the initial stage. Especially, the ratio of the surface area with the gas concentration of CO2 between 0.0–0.1 was high at 1973 K. Also, focusing on 1573 K, the ratio of the surface area with the gas concentration of CO2 between 0.4–0.5 increased by reaction, and thus the rate-controlling step would be also changed.
To quantitatively evaluate the rate-controlling step, Fig. 6 shows the change of the effectiveness factor of catalyst, η by reaction. Here, the effectiveness factor of catalyst was calculated from the following equation.
| (6) |

Change of effectiveness factor of catalyst as the reaction progresses. (Online version in color.)
At the reaction temperatures of 1373 and 1573 K, the effectiveness factor of catalyst was around 0.75 at the initial stage and then slightly increased by reaction. On the other hand, at the reaction temperatures of 1773 and 1973 K, the effectiveness factor of catalyst was under 0.5 at the initial stage and increased more sharply than at the reaction temperatures of 1373 and 1573 K. Considering with the surface area mentioned above, the rate-controlling step at 1373 K was constantly chemical reaction. At 1573 K, the rate-controlling step was changed from pore diffusion to chemical reaction. In addition, at 1773 and 1973 K, the rate-controlling step would be constantly pore diffusion.
3.3. Relationship between Rate-controlling Step and Structural ChangeFigure 7 shows the change of the spatial distribution of porosity in the analytical object with reaction. At the reaction temperature of 1373 K, although the spatial distribution of porosity at each overall conversion had the non-uniformity shown in the initial structure represented by Fig. 2, the local porosity increased uniformly in the analytical object. This is due to the rate-controlling step of chemical reaction. At reaction temperature of 1573 K, the spatial distribution of porosity showed the similar tendency to 1373 K. However, at the initial stage (X = 0.25), the local porosity around the external surface on the radial direction (around r/R = 1.0) was slightly higher at 1573 K than at 1373 K. This tendency also indicated that the rate-controlling step of 1573 K was pore diffusion. Also, the distribution at 1773 K was different from 1373 and 1573 K, and this difference was especially remarkable at the middle stage (X = 0.50). At the middle stage, the local porosity decreased toward the center of the analytical object (around r/R=0.0 and h/H=0.0). Moreover, at reaction temperature of 1973 K, it could be seen that the local porosity was different between the center part and the edge part more largely. These results were consistent with the rate-controlling step mentioned above.
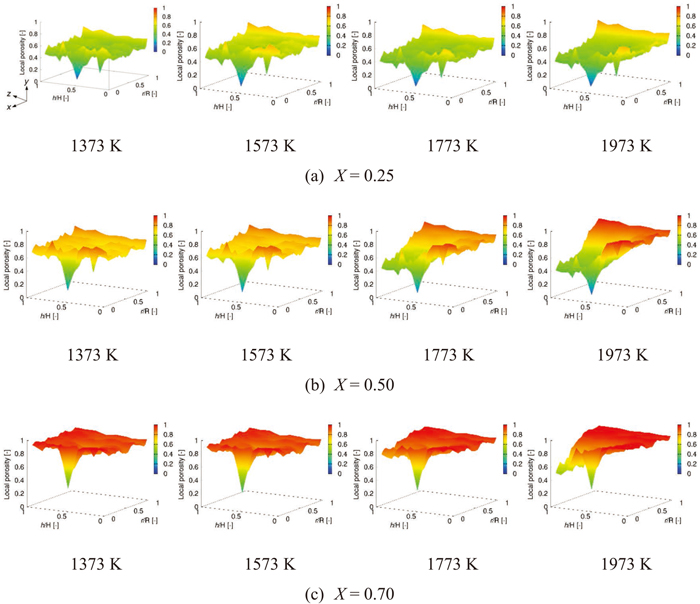
Spatial distribution of local porosity in the coke model at the overall conversion of 0.25, 0.50 and 0.70. (Online version in color.)
To quantitatively evaluate the effect of the rate-controlling step on a structural change, Fig. 8 shows the change of the frequency distribution of local porosity by the reaction. As mentioned in the method section 2.1, the frequency distribution before reaction was unimodal, and the tendency hardly changed by reaction. However, at the reaction temperatures of 1773 and 1973 K, the frequency distribution was broader at the middle stage than that at the initial stage. This is because at high temperature, the local porosity increased around the external surface but hardly changed at the internal area by reaction due to the rate-controlling step of pore diffusion. Also, the frequency distribution became narrower at the final stage than at the middle stage regardless of reaction temperature. This change would be because the reaction progressed mainly in the area with the low local conversion at the final stage.

Frequency distribution of local porosity in the coke model at the overall conversion of 0.25, 0.50 and 0.70.
To evaluate the change of the frequency distribution in detail, the average and the standard deviation of the local porosity was calculated in the whole of the analytical object. Figure 9 shows the change of the average and the standard deviation of the local porosity by the reaction. The average of the local porosity, namely overall porosity increased almost linearly against overall conversion, and thus temperature dependency was hardly shown. On the other hand, the standard deviation was affected by reaction temperature largely. At each temperature, since the structure before reaction was the same, temperature dependency cannot be seen. However, at the middle stage, the standard deviation was large in the case of high temperature, and the difference by reaction temperature enlarged with the progress of reaction. This is caused by the difference in the rate-controlling step as mentioned above.

Change of porosity and the standard deviation of overall porosity as reaction progresses. (Online version in color.)
Figure 10 shows the relationship between reaction temperature and the change rate of the standard deviation to overall conversion. In this study, for simplicity, the change rate of the standard deviation was calculated only from the two values at the overall conversion before reaction (X = 0.0) and the one with the maximum of the standard deviation. The change rate of the standard deviation was hardly different between at the reaction temperatures of 1373 and 1573 K, and the logarithm of the change rate was proportional to the inverse of reaction temperature over 1573 K. These results suggested that this numerical method allows to organize the difference of structure after reaction by the rate-controlling step.

Relationship between change rate of the standard deviation of porosity and reaction temperature. (Online version in color.)
Kinetic analysis of gasification with mass transfer for coke model developed from X-ray CT images at reaction temperatures of 1373, 1573, 1773 and 1973 K were conducted, and the temperature dependency of coke degradation by gasification reaction in a blast furnace was investigated. At low reaction temperature, the gas concentration distribution of CO2 was uniform in the analytical object. On the other hand, the gas concentration of CO2 was high around the external surface of the analytical object, and the carbon matrix voxels mainly vanished at this area. This is due to the difference in the rate-controlling step by reaction temperature. By classifying surface area by the gas concentration of CO2 at the neighbor pore voxel, the surface area with high gas concentration accounted for the majority, but the ratio was lower at over 1573 K than at 1373 K. In addition, from the change of the effectiveness factor of catalyst with reaction, it was found that the initial rate-controlling steps were chemical reaction at 1373 K and pore diffusion over 1573 K. The spatial distribution of porosity after reaction also showed the consistent tendency with the rate-controlling step. Also, although the frequency distribution of porosity showed monomodal regardless of the progress of reaction, the standard deviation obtained from the distribution was changed by reaction. Moreover, the change of the standard deviation seemed to depend on reaction temperature. Focusing on the relationship between the change rate of the standard deviation and reaction temperature, the logarithm of the change rate hardly depended on reaction temperature under 1573 K, but was proportional to the inverse of the temperature over 1573 K.
This work was supported by JSPS KAKENHI Grant Number 19J20961. A part of the results in this study were obtained by using the Supercomputer system “AFI-NITY” at the Advanced Fluid Information Research Center, Institute of Fluid Science, Tohoku University as a collaborative research with this institute. The others were obtained by using supercomputing resources at Cyberscience Center, Tohoku University.