Abstract
Tempering reactions are critical to microstructure and property control in martensitic steels. Here, retained austenite decomposition and cementite precipitation are monitored using Mössbauer spectroscopy in 4340 and 300-M steel under conventional and rapid tempering conditions. Tempering times are compared at a constant tempered hardness by increasing tempering temperatures associated with short time conditions to achieve equivalent matrix softening to that of longer tempering times. Time-temperature combinations that provide equivalent tempered hardness generated microstructures with similar dislocation densities and cementite precipitation fractions; these mechanisms are controlled by self-diffusion. However, systematic differences in retained austenite content were observed at a given degree of softening, where shorter tempering times exhibited higher levels of retained austenite compared to more conventional conditions. At low temperatures, the differences in retained austenite preservation between explored time-temperature conditions are attributed to corresponding differences in carbon diffusion distance (in austenite), the controlling diffusional process of retained austenite decomposition. At higher temperatures, retained austenite decomposition exhibits C-curve kinetic behavior in 4340. Thus, reduced thermodynamic driving force for cementite and ferrite formation at higher temperature is believed to play a role in restricting retained austenite decomposition within some short-time, high temperature tempering regimes. The addition of silicon pushes cementite precipitation and retained austenite decomposition to higher temperatures, although retained austenite decomposition is suppressed to a greater extent than cementite precipitation. Potential is illustrated for coupling rapid tempering with silicon alloying to produce appreciably tempered martensite (~490 HV) with relatively less retained austenite decomposition compared to conventional tempering conditions.
1. Introduction
Quenched and tempered (Q&T) steel has long been used in applications that require a good combination of strength and toughness.1,2) More recently, some heat treatment and alloy designs have focused on stabilizing significant amounts of austenite within a high-strength ferritic/martensitic matrix to achieve attractive strength-toughness properties (e.g. quenching and partitioning, Q&P3,4)). Austenite stabilization within these microstructures is primarily dependent on carbon enrichment, thus alloying additions that suppress cementite formation, such as silicon and/or aluminum,5) are crucial in increasing the availability of carbon for partitioning from martensite to promote austenite enrichment. While austenite retention and stabilization are prevalent topics in transformation-induced plasticity (TRIP)6,7,8,9,10) and Q&P steels,3,11,12,13,14) much less focus has been dedicated to austenite preservation in Q&T microstructures.
Early martensite tempering studies identified retained austenite decomposition as a primary stage of tempering, and established the kinetics of retained austenite decomposition associated with conventional tempering.15,16,17) The decomposition of retained austenite to cementite and ferrite is typically observed between tempering temperatures of 200 and 300°C for a tempering time of 1 h, and is identified as the second stage of tempering.18,19) Roberts et al.17) studied the kinetics of retained austenite decomposition during tempering, and ultimately related the activation energy for retained austenite decomposition in a 1.2 C wt pct steel (121 kJ/mol) to carbon diffusion in austenite (~123 kJ/mol).20)
Retained austenite decomposition upon tempering has been a focal point in the study of tempered martensite embrittlement (TME).21,22,23,24) Tempered martensite embrittlement is associated with a decrease in impact toughness typically observed between ~200–400°C, and is commonly attributed to retained austenite decomposition to interlath cementite. Tempering within the TME regime significantly diminishes strength-toughness properties, and is thus avoided in industrial practice. However, avoiding this range of tempering temperatures also limits the range of achievable properties. Medium carbon steels such as 4340 are particularly susceptible to TME, thus a high-silicon version of 4340, known as 300-M, was introduced to avoid TME without sacrificing attractive strength-toughness properties.25) Silicon delays retained austenite decomposition and cementite precipitation to higher tempering temperatures,16,26,27) consequently pushing the TME regime to higher temperatures and allowing lower temperature tempering (~200–400°C) without diminished toughness.22)
Recently, the authors of the present work studied the effect of rapid tempering on phase evolution and TME in a 4340 steel.28,29) At a given tempered hardness, retained austenite decomposition was found to significantly vary as a function of tempering time, where shorter times led to greater amounts of retained austenite when compared to conventional conditions at the same hardness. In addition to preserving more retained austenite upon tempering, short time conditions exhibited improved strength-toughness properties due to reduced embrittlement associated with TME. Results from Euser et al. are shown in Fig. 1, illustrating the effect of tempering time on retained austenite decomposition and resulting toughness within an equivalent hardness regime.29) It was proposed that these two behaviors are linked, where less severe TME behavior resulted from more limited retained austenite decomposition, a theory consistent with conventional TME mechanisms.21,22,24,30,31) While the previous paper discussed structure-property relationships, the controlling mechanisms of the observed retained austenite behavior were not deeply considered. The present work focuses on the mechanisms that promote retained austenite preservation via rapid tempering. Retained austenite behavior is further explored by comparing the tempering progression of 300-M (1.6 wt pct Si) and 4340 (0.25 wt pct Si), and assessing the effect of silicon on retained austenite carbon content and decomposition during tempering. As cementite precipitation is closely tied to retained austenite decomposition, cementite behavior is also explored within the present study. While it is acknowledged that transition carbides are an important aspect of low temperature tempering, the current work primarily focuses on the effect of rapid tempering and silicon alloying on retained austenite decomposition and cementite precipitation.

2. Experimental Procedures
The chemical compositions of the 4340 and 300-M alloys used in the present study are displayed in Table 1, where the primary difference between the two alloys is silicon content. Carbon content is indicated for each alloy in Table 1, showing both the concentrations reported by the manufacturer and the values measured by the authors using LECO combustion analysis (footnote). The carbon contents of 0.47 and 0.46 wt pct (LECO analysis) for 4340 and 300-M, respectively, were used in all ThermoCalc simulations and carbon balance calculations.
Table 1. Chemical composition of research materials (wt pct).
| wt pct | C | Mn | Si | Ni | Cr | Mo | Ti | Nb | V | Al | S | P | Cu | Sn |
|---|
| 4340 | 0.41* | 0.71 | 0.25 | 1.76 | 0.75 | 0.26 | – | 0.005 | 0.047 | 0.008 | 0.001 | 0.009 | 0.14 | – |
| 300-M | 0.42* | 0.72 | 1.58 | 1.93 | 0.80 | 0.40 | 0.003 | – | 0.08 | 0.038 | 0.001 | 0.006 | 0.12 | 0.009 |
* Carbon analysis using LECO combustion analysis resulted in measured carbon values of 0.47 and 0.46 wt pct for 4340 and 300-M, respectively.
Tempering times of 1, 10, 100 (rapid), and 3600 s (conventional) are evaluated in the present study. All specimens were austenitized at 845°C (4340) or 870°C (300-M) for 1 h and quenched into room temperature, agitated oil to form a martensitic structure. Austenitizing temperatures were selected based on recommended industrial heat treatment practices.32) The temperature of the quench oil was monitored and cooled, so as not to exceed 30°C. Conventional (3600 s) tempers were performed in a nitrate salt bath (4340) or box furnace (300-M), followed by water quenching. Rapid (1, 10, and 100 s) tempering involved heating in a Gleeble® 3500 at a rate of ~650°C/s, followed by quenching with helium to achieve a cooling rate of ~30–60°C/s. The procedures adopted for executing the rapid tempering treatments are covered in greater depth within a previous paper,33) where accounting for tempering that occurs during heating and cooling of rapid heat treatments is addressed.
The tempering matrices of the 4340 and 300-M alloys are shown in Table 2. Temperatures associated with the conventional tempering time of 3600 s were selected to coincide with the reported retained austenite decomposition regimes in 4340 and 300-M.22) Short time (1, 10, 100 s) tempering temperatures were selected to produce a tempered hardness similar to conventional time-temperature combinations, with the intent of imparting an equivalent degree of tempering and capturing the progression of retained austenite decomposition. In previous studies,28,29,33) the Hollomon-Jaffe tempering parameter (H-J TP) was successfully utilized to achieve an equivalent tempered hardness across conventional and rapid tempering conditions of 4340. However, the H-J TP methodology did not result in comparable hardness values for the 300-M alloy in the present study; thus time-temperature combinations of 300-M were chosen based on an independent hardness study, and results are not analyzed here as a function of TP. The range of average hardness values achieved for each “equivalent” time-temperature combination of 4340 and 300-M is displayed in Table 2, where for a given alloy each column corresponds to an “equivalent” temper. Hardness measurements were conducted using an automatic LECO AMH55 (300-M) and a manual LECO MHT200 (4340) Vickers microindentation hardness tester with a 500 g-f load and 10 s dwell time. Samples were prepared via mounting and polishing to a 1 μm finish. Since a temperature gradient, and therefore hardness gradient, is present in all Gleeble® tempered samples, accurate positioning of indentations with respect to the thermocouple location was ensured.34)
Table 2. 4340 and 300-M tempering matrices.
| Alloy | Time (s) | Temperature (°C) |
|---|
| 4340 | 3600 | 200 | 250 | 300 | 350 | 400 |
| 100 | 241 | 295 | 350 | 404 | 458 |
| 10 | 271 | 329 | 386 | 444 | 501 |
| 1 | 305 | 366 | 427 | 489 | 550 |
| Range of Average Hardness (HV) | 624–657 | 582–593 | 538–548 | 507–527 | 461–489 |
| 300-M | 3600 | 350 | 400 | 450 | 500 | 550 |
| 100 | 404 | 434 | 517 | 544 | 567 |
| 10 | 441 | 462 | 519 | 555 | 612 |
| 1 | 434 | 486 | 538 | 575 | 619 |
| Range of Average Hardness (HV) | 611–619 | 586–595 | 526–538 | 508–514 | 492–500 |
Mössbauer spectroscopy was used to characterize retained austenite, transition carbide, and cementite phase fractions in the tempered microstructures. Samples were prepared by grinding to a thickness of approximately 80 μm using a progression of 180, 240, 360, 600, and 1200 grit metallographic paper. Subsequent thinning was performed using a solution of 10 parts deionized water, 10 parts hydrogen peroxide, and 1 part hydrofluoric acid to achieve a final thickness between 15 and 40 μm. WinNormos V3.0 and IGOR Pro V6.3 software were used to fit each Mössbauer spectrum with multiple sub-spectra related to martensite/ferrite (α), retained austenite (γR), transition carbide (η) and cementite (θ) resonance. Cementite sub-spectra were fit considering both magnetic (θm) and non-magnetic (θnm) cementite, as a magnetic transition (θm → θnm) can occur in the presence of significant alloy enrichment.35)
Fitting of Mössbauer spectra was conducted to quantify quadrupole splitting (QS), isomer shift (IS), internal magnetic hyperfine field (Bhf), peak width (W), and resonance area (A). The unique spectral parameters of ferrite, austenite, transition carbide, and cementite enable the identification and separation of spectra related to each phase. Multiple sextets were fit to the martensite/ferrite, magnetic cementite, and transition carbide spectra to account for their total resonance. Non-magnetic cementite does not exhibit a six-line component, given the lack of magnetic splitting; thus, a doublet was appropriately fit in correspondence with non-magnetic cementite. Two singlets and one doublet were fit to account for the austenite resonance, in which each austenite spectrum is associated with specific surroundings of the iron (Fe) atom. The two singlets are thought to be related to Fe with no carbon nearest neighbors (nn) or next nearest neighbors (nnn), and Fe with no nn, but up to four carbon nnn.36,37) The quadrupole split doublet is associated with an Fe atom with one carbon nn or two carbon nn at 90° from each other.36) Conversion of fit spectra to atomic percent iron of each phase was conducted after correcting for effective thicknesses and recoilless fractions, consistent with the procedure outlined in Pierce et al.38,39) Recoilless fraction corrections were implemented based on values associated with α, γR, η, and θ phases.38,39) Error associated with the Mössbauer phase fraction results was estimated in accordance with the methodology outlined in Euser et al.,29) with a slightly higher statistical uncertainty (0.43 at pct) associated with transition carbides in 300-M. The present study presents phase fraction results in terms of atomic percent iron. The volume per Fe atom is similar in martensite/ferrite and austenite are similar (varying by 3 pct or less depending on C contents in the two phases),40) thus the retained austenite values associated with the more conventional unit of volume percent would not differ much from the atomic percent iron results presented here.
The carbon concentration in solution in retained austenite was calculated from the fraction of Fe sites in retained austenite containing no carbon nearest neighbors:
|
r(0)=
(
1-
X
C
1-
X
C
)
6
| (1) |
where
XC is atomic fraction of carbon in austenite and r(0) is the Fe fraction associated with the central resonance of the austenite spectrum.
36,38,41) Conditions with an austenite content below ~0.5 at. pct Fe could not be reliably analyzed to extract carbon concentration in retained austenite, therefore a represented carbon content of 0 indicates an associated austenite amount below the 0.5 at. pct threshold. The carbon consumed by cementite was determined via Mössbauer spectroscopy by utilizing the Fe atomic fractions (
F), stoichiometry (
Y), and atomic fraction of substitutional alloying elements (
a) estimated within each carbide:
|
C in Carbides=
F
Y(1-a)
| (2) |
where
Y = 2 for stoichiometric transition carbide and
Y = 3 for cementite and non-stoichiometric transition carbide.
38,42,43) The atomic fractions of alloying elements in 4340 and 300-M were taken as 0.04 and 0.07, respectively. For the non-magnetic cementite, the value a = 0.15 was used based on the amount of Mn enrichment required to produce this phase.
32) Carbon content of the ferritic matrix cannot be accurately determined using Mössbauer spectroscopy due to the multitude of overlapping ferrite spectra. Thus, a full carbon balance cannot be quantified; however, the total carbon in carbides and retained austenite determined via Mössbauer spectroscopy consistently remained within the bulk (LECO combustion) carbon content of each alloy.
Dislocation density was estimated through peak width analysis of x-ray diffraction (XRD) data. Samples were prepared by sectioning and light grinding using a progression of 250, 320, 400, and 600 grit metallographic paper. Samples were subsequently thinned in a solution of 10 parts deionized water, 10 parts hydrogen peroxide, and 1 part hydrofluoric acid for 15 to 30 minutes to remove the damaged layer associated with grinding. A thickness reduction of at least 0.005 in (0.127 mm) was achieved, per ASTM standard E975.44) Measurements were obtained using nickel-filtered copper radiation and a Phillips X-pert diffractometer instrumented with an X’celerator detector. With operating conditions of 45 kV and 40 mA, samples were scanned over a 2θ range of 40 to 130° with a step size of 0.03–0.05° and overall run times of 0.5–1.5 h. Each sample (for a single time-temperature condition) was run four times to increase accuracy of the measurements. Two measurements were conducted at the same orientation, and then the sample was rotated 90° for two additional measurements. Peak broadening was analyzed using a modified Williamson-Hall method45,46) to determine dislocation density. This approach attributes all peak broadening to dislocations and assumes strain from internal stresses, texture, and other sources to be negligible.
3. Results
Table 3 shows the phase fraction results associated with as-quenched conditions of 4340 and 300-M, as well as the corresponding martensite start (Ms) temperatures estimated using the Andrews linear equation.47) A slightly lower Ms is predicted for 300-M given the higher level of alloying, and thus less autotempering during the quench from austenitization is expected. The small difference in autotempering, as well as the general suppression of tempering associated with silicon alloying, are thought to account for the observed differences in transition carbide and retained austenite content between 4340 and 300-M in the as-quenched conditions.
Table 3. As-Quenched 4340 and 300-M.
| Alloy | Retained Austenite
(at pct Fe) | Transition Carbide Content
(at pct Fe) | Cementite Content
(at pct Fe) | Estimated Martensite Start Temperature (°C) |
|---|
| 4340 | 6.2 ± 0.1 | 2.71 ± 0.48 | 0 | 272 |
| 300-M | 6.4 ± 0.1 | 1.7 ± 0.54 | 0 | 257 |
Figure 2 compares the retained austenite decomposition behavior of 4340 and 300-M as a function of tempered hardness for tempering times of 3600, 100, 10, and 1 s. With increased tempering (i.e. lower hardness), retained austenite decomposes to varying degrees depending upon the tempering time and alloy. In general, retained austenite decomposition is suppressed at shorter tempering times for a constant tempered hardness in both 4340 and 300-M, although the addition of silicon imparts a somewhat greater retardation of retained austenite decomposition for shorter tempering times, particularly at lower hardness values. Cementite content is shown as a function of tempered hardness in Fig. 3 for all time conditions of 4340 and 300-M. Here, no clear variation in cementite precipitation is observed between alloys or tempering time conditions at a given hardness. The impact of silicon on the temperature regime associated with cementite precipitation and retained austenite decomposition is illustrated in Fig. 4. For both rapid (1 s) and conventional (3600 s) conditions, the cementite precipitation and retained austenite decomposition reactions are shifted to higher temperatures for the 300-M alloy compared to 4340.


Figure 5 shows the carbon concentration of retained austenite as a function of tempered hardness for all time conditions of 300-M and 4340. The as-quenched (AQ) conditions of 4340 and 300-M exhibit a carbon concentration close to the average bulk carbon content of both alloys. Upon initial tempering, retained austenite is enriched in carbon in both 4340 and 300-M, although to different extents. While 300-M reaches a concentration of ~1.2 wt pct, 4340 only enriches to ~0.8 wt pct within the same hardness regime. As tempering progresses, 4340 exhibits a relatively constant carbon content of ~0.6–0.85 wt pct, while 300-M undergoes a substantial decrease in retained austenite carbon concentration from ~1.2 to ~0.4 wt pct. It should be noted that the conditions indicating a carbon concentration of zero either contain no remaining retained austenite, or too little to accurately measure carbon concentration via Mössbauer spectroscopy.

The relationship between dislocation density and tempered hardness is illustrated in Fig. 6, where the 1 and 3600 s time conditions of both 300-M and 4340 are compared. Overall, dislocation density decreases with tempering, and there is no significant or systematic difference across alloys and time conditions for a given hardness. Since 300-M is tempered at higher temperatures to achieve the same hardness as 4340, the results in Fig. 6 indicate that dislocation recovery is pushed to higher temperatures with the addition of silicon, as has been previously reported within the literature.48,49)
4. Discussion
4.1. Preserving Retained Austenite via Rapid Tempering
The results presented for both 4340 and 300-M reveal similar cementite content and dislocation recovery behavior between different tempering conditions at a consistent hardness, yet significant and systematic differences in the extent of retained austenite decomposition as a function of time. Traditionally, time/temperature equivalence in tempering is considered in terms of tempered hardness. That is, an equivalent degree of tempering is thought to be achieved for time-temperature conditions that exhibit similar hardness values.50) Historically, this has been considered a valid approach, given the similar mechanical properties (e.g. strength) produced at a given hardness,50,51,52) irrespective of the microstructural details examined more closely herein. To encourage similar microstructural progression between various tempering conditions, time-temperature combinations must be adjusted such that comparable diffusional kinetics are achieved. However, the dependency of tempering stages on different diffusional processes (e.g. carbon diffusion in austenite or iron diffusion in ferrite) introduces significant complexity in this endeavor. Furthermore, the dominant influence of some microstructural characteristics on tempered hardness is such that hardness may not capture the progression of all microstructural processes to the same degree. The impact of these factors and others on the observed preservation of retained austenite with more rapid tempering is discussed below.
Hardness of tempered martensite is primarily impacted by strengthening mechanisms associated with dislocation density and carbon supersaturation (and thus carbide precipitation).53,54) Given the substantial influence of these microstructural characteristics on hardness, the observed consistency of carbide precipitation and dislocation recovery behavior at a given hardness may be expected. In contrast, small amounts of retained austenite (e.g. 6 at pct Fe) are less likely to strongly influence bulk hardness properties. Thus, tempered hardness is a well-suited metric for tracking cementite precipitation, but cannot be anticipated to reflect small changes in retained austenite content.
The kinetics of the second stage of tempering involving retained austenite decomposition is thought to be controlled by carbon diffusion in austenite. Thus, the characteristic diffusion distance of carbon in austenite is assessed for the 4340 time-temperature conditions explored in the present study. The 4340 alloy is used to compare the diffusional kinetics of the different time-temperature conditions, as the controlling mechanisms of stage II (and III) are complicated by the increased silicon levels in 300-M. Characteristic diffusion distance is estimated as:
where t is time and D is diffusivity given by:
where D
o is the pre-exponential frequency factor, Q is activation energy for diffusion, R is the universal gas constant, and T is absolute temperature. Values of 0.15 cm
2/sec and 150 kJ/mol were used for the pre-exponential frequency factor and activation energy, respectively, for carbon diffusion in austenite associated with a ~0.4 wt pct C steel.
20,55) Figure 7(a) shows the estimated diffusion distance as a function of tempered hardness, in which significant and systematic differences are observed at a given hardness as a function of time. Here, shorter times correspond to smaller diffusional distances, consistent with the retained austenite decomposition trends observed in
Fig. 2 as a function of time.

The third stage of tempering, cementite precipitation in ferrite, is believed to be limited by iron self-diffusion or pipe-diffusion in ferrite.56) In contrast to carbon diffusion in austenite, the characteristic iron diffusion distances associated with the controlling process of stage III exhibit similar behavior across time-temperature conditions at a given hardness, as indicated in Fig. 7(b). Here, 5.4 cm2/sec and 252 kJ/mol were used for the pre-exponential frequency factor and activation energy, respectively, for iron self-diffusion in ferrite.57) Thus, while time-temperature equivalence based on tempered hardness is consistent with trends for iron diffusion distances in ferrite (stage III), the same time-temperature adjustments do not result in comparable behavior with respect to carbon diffusion in austenite (stage II). The different time-temperature effects on the diffusional processes controlling tempering stages II and III are therefore thought to explain corresponding differences in retained austenite decomposition and cementite precipitation at a given tempered hardness.
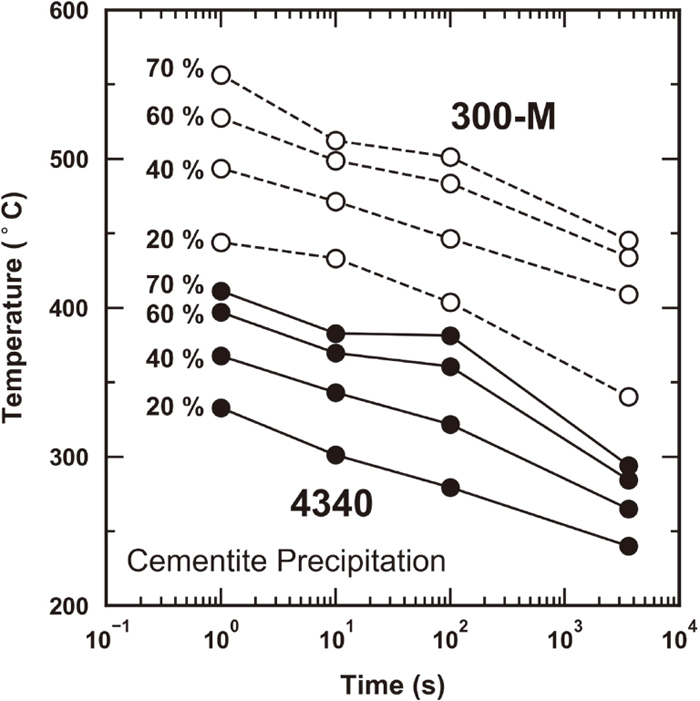
The 4340 retained austenite decomposition behavior shown in Fig. 1(a) indicates a small, yet systematic, increase in retained austenite content with decreasing hardness between ~525 and 450 HV. The source of this phenomenon is explored by representing the data as a “time-temperature-decomposition” (TTD) diagram in Fig. 8. The TTD diagram was constructed by converting austenite content (Fig. 2) to percent retained austenite decomposed relative to the starting condition (i.e., as-quench (6.2 at pct Fe as determined by Mössbauer spectroscopy)), where each number expressed in Fig. 8 corresponds to a specific amount of retained austenite decomposition represented as a percentage. As indicated by the overlaid dashed lines, the behavior within some time-temperature regimes resembles a traditional time-temperature-transformation (TTT) C-curve. In a conventional austenite decomposition TTT diagram, diffusional transformations exhibit C-curve behavior due to the balance between thermodynamic driving force and diffusion kinetics.58) Thus, the decomposition behavior shown in Fig. 8 might be considered similarly to that of conventional C-curve kinetics. At relatively low tempering temperatures (< 350°C), retained austenite decomposition kinetics are likely limited by diffusion. This is consistent with the conventional understanding of stage II kinetics that was previously discussed, in which retained austenite decomposition is thought to be limited by carbon diffusion in austenite. The activation energy associated with the observed retained austenite behavior within this lower temperature regime was determined to be 158 kJ/mol, according to the analysis shown in Fig. 9. This value is within the range of other stage II activation energies presented within the literature (115–185 kJ/mol),16,59,60,61,62,63,64,65) and is similar to the activation energy for carbon diffusion in austenite, 150 kJ/mol, for a ~0.4 wt pct C steel.20) Thus, the retained austenite decomposition behavior at temperatures below ~350°C is thought to be limited by carbon diffusion in austenite. As tempering temperature increases above 350°C, the extent of decomposition does not always continue to increase with increasing temperature, as might be expected for a process solely controlled by diffusion. The slower austenite decomposition kinetics observed at short times and high temperatures may thus be related to reduced thermodynamic driving force for ferrite and cementite formation from austenite. The increase in retained austenite content at low hardness levels (high temperatures) illustrated in Fig. 1(a) is similarly attributed to a reduced driving force for austenite decomposition. To the authors’ knowledge, C-curve behavior for retained austenite decomposition upon tempering has not previously been reported, although it is supported by the traditional understanding of diffusional phase transformation kinetics. The present results emphasize the importance of considering effects from both diffusion rates and thermodynamic driving force on retained austenite decomposition, particularly under short time tempering conditions.


The greater preservation of retained austenite, yet equivalent amount of cementite precipitation, observed with more rapid tempering was analyzed in the preceding paragraphs with respect to the applicability of hardness as a tempering metric, diffusional kinetics associated with tempering stages II and III, and thermodynamic driving force for retained austenite decomposition. Hardness was found to correlate with the extent of cementite precipitation and dislocation recovery across the range of time-temperature conditions, but did not accurately characterize retained austenite decomposition due to the relative insensitivity of hardness to low levels of retained austenite content. Within the diffusion-limited regime, the greater preservation of retained austenite via rapid tempering is possible due to differences in activation energies, and thus time-temperature effects, of the rate-controlling diffusional processes of tempering stages II and III (i.e. carbon vs self-diffusion). At higher temperatures, the driving force for cementite and ferrite formation from retained austenite takes on greater importance, controlling the retained austenite decomposition at short times, as low thermodynamic driving force limits the reaction. Most importantly, it has been shown that rapid tempering can be leveraged to achieve an equivalent matrix hardness to more conventional conditions, yet preserve higher levels of retained austenite. This processing route may be of interest, given preliminary indications of improved strength-toughness properties associated with a greater preservation of retained austenite upon tempering,28,29) as well as the potential for significantly decreasing processing times.
4.2. Effect of Silicon on Austenite Decomposition and Cementite Precipitation
The effect of silicon on retained austenite decomposition is illustrated in Fig. 10 by comparing TTD diagrams of 4340 and 300-M. The points in Fig. 10 were obtained via interpolation of the original phase fraction data in order to produce iso-decomposition curves. The as-quenched retained austenite contents of 4340 and 300-M, 6.2 and 6.4 at pct Fe, respectively, were used as starting conditions to calculate the percentage of retained austenite decomposition. As indicated in Fig. 10, the TTD curves of 300-M are shifted to higher tempering temperatures compared to 4340, representative of a delay in retained austenite decomposition with increased silicon that is consistent with previous literature.16) In contrast to 4340, retained austenite decomposition in 300-M does not exhibit C-curve behavior for the conditions investigated. Higher temperatures and/or longer times may be necessary to observe the C-curve nose in 300-M, where driving force begins to play a dominant role.

The time-temperature-precipitation (TTP) behavior for cementite in 4340 and 300-M is shown in Fig. 11. Represented percentages correspond to the extent of cementite precipitation relative to the estimated final (equilibrium) cementite phase fraction, where equilibrium cementite fractions were estimated at each temperature using ThermoCalc. To produce the iso-precipitation curves in Fig. 11, cementite content data were extracted from the original phase fraction results in Fig. 3 through linear interpolation. The data in Fig. 11 are associated with both cementite precipitated within martensite and cementite formed as a result of retained austenite decomposition, as cementite associated with these different processes cannot be distinguished based on the present data. However, it is assumed that matrix cementite formation dominates the observed behavior due to higher levels of total carbon in the matrix compared to within retained austenite.
The cementite TTP diagrams of 4340 and 300-M indicate no C-curve behavior in either alloy. As discussed, retained austenite decomposition is thought to exhibit C-curve behavior in 4340 due to a significant reduction in driving force for the γ → α + θ reaction at sufficiently high temperatures, given greater proximity to the critical transformation temperature. The absence of C-curve behavior in Fig. 11 is presumably due to high driving force for cementite precipitation from supersaturated ferrite, even at higher tempering temperatures.66) Consequently, the tempering temperature dependence of cementite precipitation (from supersaturated ferrite) is primarily controlled by diffusion kinetics, similar to the lower temperature regime of the retained austenite decomposition C-curve.
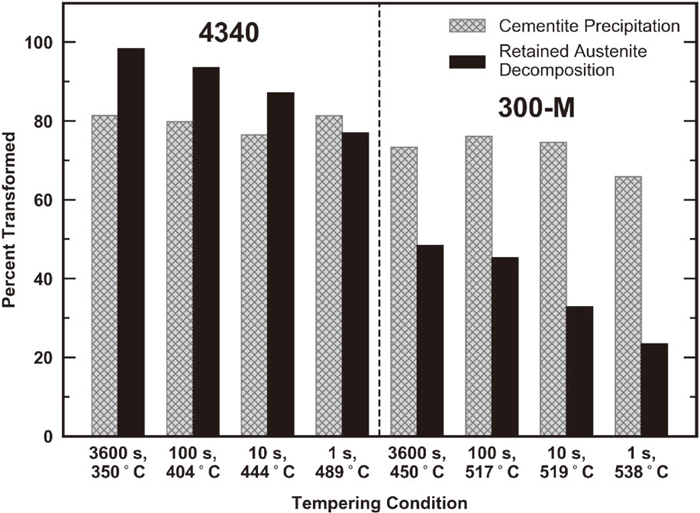
Comparison of 4340 and 300-M precipitation behavior in Fig. 11 indicates that cementite precipitation is pushed to higher temperatures and/or longer times with the addition of silicon, similar to its observed effect on retained austenite decomposition. However, austenite decomposition and cementite precipitation are not affected by silicon to the same extent. This is illustrated in Fig. 12, where the extent of retained austenite decomposition in 4340 and 300-M is compared at a similar hardness and thus a relatively consistent cementite precipitation level (65–80 pct of the equilibrium cementite fraction). The 300-M conditions are clearly associated with lower levels of retained austenite decomposition for a given amount of cementite precipitation. The results indicate that silicon delays the γ → α + θ transformation to a greater degree than the α’ → α + θ reaction.
The mechanism by which silicon suppresses cementite precipitation is primarily linked to its negligible solubility in cementite, where two scenarios are typically discussed within the literature. One scenario, originally proposed by Owen,16) involves the rejection of silicon from cementite and the subsequent build-up of silicon atoms at the transformation interface. For precipitation to continue, silicon must diffuse away from the advancing interface, while carbon simultaneously diffuses toward the growing cementite particle. The added requirement of substitutional diffusion increases the activation energy for diffusion, consequently increasing the tempering temperatures required for cementite precipitation to occur. In addition, silicon increases the activity of carbon,67,68) thus slowing carbon diffusion to the precipitate due to a decrease in chemical driving force. Babu et al.69,70) did not observe silicon redistribution during the early stages of cementite precipitation under some conditions, and thus proposed an additional scenario. At the onset of precipitation, silicon may be trapped within the cementite lattice due to limited mobility at relatively low temperatures, thus promoting paraequilibrium cementite formation (no substitutional diffusion). The trapping of silicon within cementite lowers the free energy change associated with precipitation and thus may retard nucleation and growth due to a decrease in driving force for cementite precipitation. Paraequilibrium cementite was also observed by Thomson and Miller,71,72,73) and Clarke et al.5) at the onset of precipitation, while silicon redistribution was eventually detected upon further tempering.5,69,70) Thus, it is likely that both the formation of paraequilibrium cementite, as well as silicon build-up at the interface, play a role in the suppression of cementite within different nucleation/growth regimes. Silicon’s disproportionate effect on the γ → α + θ and α’ → α + θ reactions, inferred from Fig. 12, is therefore discussed in the context of the two mechanisms by which silicon is thought to affect cementite precipitation.
Kozeschnik and Bhadeshia66) used thermodynamic modeling to compare the effect of silicon on paraequilibrium cementite precipitation in ferrite and austenite. In their study, silicon was found to reduce the thermodynamic driving force for paraequilibrium cementite precipitation in austenite much more significantly than within ferrite. While cementite may not be expected to nucleate within austenite during decomposition associated with tempering, cementite growth into austenite must be associated with a driving force for the replacement of austenite with cementite. Thus, silicon’s greater reduction of driving force for paraequilibrium cementite in austenite compared to in ferrite may contribute to the greater suppression of γ → α + θ compared to α’ → α + θ observed in the present study. Alternatively, assuming that silicon diffusion away from the advancing interface is required for cementite growth, differences in silicon mobility within ferrite and austenite have the potential to affect retained austenite decomposition and cementite precipitation differently. Substitutional diffusion is typically slower in austenite compared to ferrite,74,75) thus the presence of silicon may more significantly suppress cementite formation from austenite compared to ferrite. The greater effect of silicon on the γ → α + θ reaction may thus be associated with both of the mechanisms through which silicon is thought to delay cementite precipitation.
4.3. Carbon Enrichment of Retained Austenite during Tempering
Retained austenite carbon concentration (Cγ) results in Fig. 5 indicate a peak Cγ of ~0.8 and ~1.2 wt pct in 4340 and 300-M, respectively. Marked enrichment of retained austenite can be achieved via the partitioning of carbon from supersaturated martensite (ferrite) into austenite during tempering by limiting microstructural processes that otherwise consume available carbon, such as carbide precipitation.11,76) Failure to sufficiently suppress carbide precipitation can thus lead to lower levels of retained austenite carbon enrichment. Table 4 compares the total amount of carbon in carbides between 4340 and 300-M after tempering at ~360 and ~430°C for 1 s. The chosen tempering conditions correspond to peak retained austenite carbon concentrations in both 4340 and 300-M. As shown in Table 4, the combined amount of carbon in cementite and transition carbides is significantly lower in 300-M compared to 4340 due to the suppression of cementite precipitation. Thus, the observed differences in peak Cγ levels between 300-M and 4340 are likely related to the availability of free carbon that is dictated by the extent of cementite precipitation.
Table 4. Total carbon in carbides for select conditions of 4340 and 300-M.
| Time (s) | Temperature (°C) | Alloy | Transition Carbide Content
(at pct Fe) | Cementite Content
(at pct Fe) |
|---|
| 1 | 366 | 4340 | 2.04 ± 0.54 | 2.69 ± 0.48 |
| 355 | 300-M | 2 ± 0.59 | 1 ± 0.53 |
| 1 | 427 | 4340 | 0 | 5.56 ± 0.41 |
| 434 | 300-M | 1.7 ± 0.59 | 1.2 ± 0.53 |
In addition to difference in peak Cγ levels, 4340 and 300-M also exhibit marked differences in retained austenite carbon enrichment as a function of tempering. Similar Cγ levels are observed during tempering of 4340 for different times and temperatures (Fig. 5), while 300-M exhibits a strong relationship between retained austenite carbon concentration, austenite decomposition, and cementite precipitation, shown more fully in Fig. 13. Retained austenite carbon depletion occurs in conjunction with cementite precipitation and retained austenite decomposition. Thus, retained austenite decomposition, involving the formation of cementite, is thought to drive the observed reduction in Cγ at higher tempering temperatures of 300-M. Retained austenite is progressively depleted in carbon as the carbon is incorporated into precipitating cementite. Others have also observed retained austenite carbon depletion in conjunction with austenite decomposition.77,78,79,80) In contrast, 4340 Cγ does not exhibit a relationship with cementite precipitation and retained austenite decomposition, but remains consistent throughout tempering. Further work is required to understand this behavior, involving direct observation of the retained austenite decomposition behavior.

Carbon enrichment of retained austenite is an important aspect of many steels that are intended to preserve appreciable amounts of austenite in the final microstructure. For example, Q&P processing is specifically designed to enable austenite carbon enrichment during the partitioning step, where increased carbon levels lower the martensite start temperature and stabilize austenite from further martensite transformation during the final quench. However, the role of retained austenite carbon enrichment is different for the Q&T heat treatments explored in the present work since the steels (Q&P vs Q&T) are processed differently and the microstructure and property objectives are different. Here, for a given degree of matrix softening, it has been shown that the decomposition of retained austenite can be limited via rapid tempering. During tempering, retained austenite primarily transforms through thermal decomposition to ferrite and cementite. While increased carbon levels stabilize retained austenite with respect to the γ → α’ transformation, carbon enrichment of retained austenite can also increase the driving force for cementite formation and thus promote thermal decomposition (γ → α + θ). In this manner, retained austenite carbon enrichment during tempering is not thought to play a role in preserving austenite during the rapid tempering treatments explored in the present study. However, austenite carbon content remains relevant in the present microstructures, as retained austenite stability can significantly affect mechanical behavior.9,22,81,82)
5. Conclusions
Earlier investigations indicated an enhancement in strength-toughness properties associated with greater retention of austenite through rapid tempering. The present work explored underlying mechanisms through which retained austenite is preserved via short time tempering, and revealed opportunities for producing unique tempered microstructures. Retained austenite decomposition and cementite precipitation behavior of 4340 and 300-M were explored in rapid and conventional tempering conditions. Due to differences in the controlling diffusional processes associated with tempering stages II and III, rapid tempering enables the production of mixed-microstructures that include tempered martensite and higher levels of retained austenite compared to conventional tempering. Retained austenite decomposition kinetics exhibited C-curve behavior (only) in 4340, where short times and high temperatures suppressed the decomposition of retained austenite, potentially due to a reduction in driving force for the γ → θ + α reaction. Silicon delays the decomposition of retained austenite, resulting in the preservation of retained austenite to higher temperatures. The coupled effects of rapid tempering and increased silicon result in significant retained austenite conservation upon tempering, where appreciable levels of martensite tempering (~490 HV) can be achieved with corresponding retained austenite decomposition levels of only 35 pct (1 s at ~619°C). Significant retained austenite preservation and martensite tempering are simultaneously achievable in 300-M, particularly with rapid tempering, due to the greater suppression of the γ → α + θ reaction compared to α’ → α + θ.
Retained austenite carbon enrichment is similar across tempering time conditions for a given hardness and alloy, yet varies significantly between 4340 (low Si) and 300-M (high Si). In 4340, retained austenite carbon concentration initially increases and then remains relatively constant (~0.6–0.85 wt pct C) with tempering. In contrast, 300-M exhibits initial retained austenite carbon enrichment, followed by much greater carbon depletion at higher tempering temperatures. The depletion of carbon in the retained austenite of 300-M occurs in conjunction with the onset of marked cementite precipitation and retained austenite decomposition, and is thus attributed to the formation of cementite during austenite decomposition. The peak Cγ levels in 4340 and 300-M are ~0.85 and 1.2 wt pct C, respectively, where higher levels of retained austenite enrichment in 300-M result from the suppression of cementite.
Acknowledgements
The authors gratefully acknowledge the financial and technical support of sponsors of the Advanced Steel Processing and Products Research Center (ASPPRC) at the Colorado School of Mines. The authors also thanks Los Alamos National Laboratory (LANL) and TimkenSteel for supplying the 4340 and 300-M steels, respectively.
References
- 1) G. Krauss: Mater. Sci. Eng. A, 273-275 (1999), 40.
- 2) G. Krauss: Steel Res. Int., 87 (2017), 1700038.
- 3) J. G. Speer, F. C. Rizzo Assuncao, D. K. Matlock and D. V. Edmonds: Mater. Res., 8 (2005), 417.
- 4) J. G. Speer, E. De Moor and A. J. Clarke: Mater. Sci. Technol., 31 (2015), 3.
- 5) A. J. Clarke, M. K. Miller, R. D. Field, D. R. Coughlin, P. J. Gibbs, K. D. Clarke, D. J. Alexander, K. A. Powers, P. A. Papin and G. Krauss: Acta Mater., 77 (2014), 17.
- 6) N. H. Van Dijk, A. M. Buut, L. Zhao, J. Sietsma, S. E. Offerman, J. P. Wright and S. van der Zwaag: Acta Mater., 53 (2005), 5439.
- 7) E. Jimenez-Melero, N. H. Van Dijk, L. Zhao, J. Sietsma, S. E. Offerman, J. P. Wright and S. van der Zwaag: Acta Mater., 55 (2007), 6713.
- 8) J. Chiang, B. Lawrence, J. D. Boyd and A. K. Pilkey: Mater. Sci. Eng. A, 528 (2011), 4516.
- 9) J. Chiang, J. D. Boyd and A. K. Pilkey: Mater. Sci. Eng. A, 638 (2015), 132.
- 10) S. Van Der Zwaag, L. Zhao, S. O. Kruijver and J. Sietsma: ISIJ Int., 42 (2002), 1565.
- 11) J. Speer, D. K. Matlock, B. C. De Cooman and J. G. Schroth: Acta Mater., 51 (2003), 2611.
- 12) R. M. Wu, L. Wang and X. J. Jin: Phys. Procedia, 50 (2013), 8. https://doi.org/10.1016/j.phpro.2013.11.003
- 13) X. C. Xiong, B. Chen, M. X. Huang, J. F. Wang and L. Wang: Scr. Mater., 68 (2013), 321.
- 14) D. De Knijf, R. Petrov, C. Föjer and L. A. I. Kestens: Mater. Sci. Eng. A, 615 (2014), 107.
- 15) D. P. Antia, S. G. Fletcher and M. Cohen: Trans. Am. Soc. Met., 32 (1944), 290.
- 16) W. Owen: Trans. Am. Soc. Met., 46 (1954), 812.
- 17) C. S. Roberts, B. L. Averbach and M. Cohen: Trans. Am. Soc. Met., 45 (1953), 576.
- 18) G. R. Speich and W. C. Leslie: Metall. Trans., 3 (1972), 1043.
- 19) G. R. Speich and K. A. Taylor: Martensite, ASM International, Materials Park, OH, (1992), 243.
- 20) C. Wells, W. Batz and R. F. Mehl: Trans. AIME, 188 (1950), 553.
- 21) G. Thomas: Metall. Trans. A, 9 (1978), 439.
- 22) R. M. Horn and R. O. Ritchie: Metall. Trans. A, 9 (1978), 1039.
- 23) H. K. D. H. Bhadeshia and D. V. Edmonds: Metal Sci., 13 (1979), 325.
- 24) M. Sarikaya, A. K. Jhingan and G. Thomas: Metall. Trans. A, 14 (1983), 1121.
- 25) W. M. Garrison, Jr.: JOM, 42 (1990), 20.
- 26) B. Kim, C. Celada, D. San Martin, T. Sourmail and P. E. J. Rivera-Diaz-Del-Castillo: Acta Mater., 61 (2013), 6983.
- 27) G. Miyamoto, J. C. Oh, K. Hono, T. Furuhara and T. Maki: Acta Mater., 55 (2007), 5027.
- 28) V. K. Judge, J. G. Speer, K. D. Clarke, K. O. Findley and A. J. Clarke: Sci. Rep., 8 (2018), 445.
- 29) V. K. Euser, D. L. Williamson, K. D. Clarke, K. O. Findley, J. G. Speer and A. J. Clarke: Metall. Mater. Trans. A, 50 (2019), 3654.
- 30) J. P. Materkowski and G. Krauss: Metall. Trans. A, 10 (1979), 1643.
- 31) H. Kwon and C. H. Kim: Metall. Trans. A, 14 (1983), 1389.
- 32) H. Chandler: Heat Treater’s Guide: Practices and Procedures for Irons and Steels, ASM International, Materials Park, OH, (1995), 347, 700.
- 33) V. K. Euser, A. J. Clarke and J. G. Speer: J. Mater. Eng. Perform., 29 (2020), 4155. http://doi.org/10.1007/s11665-020-04946-z
- 34) V. K. Euser: Ph.D. Thesis, Colorado School of Mines, (2020), https://hdl.handle.net/11124/174150, (accessed 2020-06-01).
- 35) P. Schaaf, S. Wiesen and U. Gonser: Acta Metall. Mater., 40 (1992), 373.
- 36) O. N. C. Uwakweh, J. P. Bauer and J. M. Génin: Metall. Trans. A, 21 (1990), 589.
- 37) K. Laneri, J. Desimoni, G. Zarragoicoechea and A. Fernández-Guillermet: Phys. Rev. B, 66 (2002), 134201.
- 38) D. T. Pierce, D. R. Coughlin, D. L. Williamson, K. D. Clarke, A. J. Clarke, J. G. Speer and E. De Moor: Acta Mater., 90 (2015), 417.
- 39) D. T. Pierce, D. R. Coughlin, D. L. Williamson, J. Kahkonen, A. J. Clarke, K. D. Clarke, J. G. Speer and E. De Moor: Scr. Mater., 121 (2016), 5.
- 40) L. Cheng, A. Bottger, T. de Keijser and E. J. Mittemeijer: Scr. Metall. Mater., 24 (1990), 509.
- 41) D. L. Williamson, K. Nakazawa and G. A. Krauss: Metall. Trans. A, 10 (1979), 1351.
- 42) H. Ino, T. Ito, S. Nasu and U. A. Gonser: Acta Metall., 30 (1982), 9.
- 43) Y. Hirotsu and S. Nagakura: Trans. Jpn. Inst. Met., 15 (1974), 129.
- 44) ASTM E975-13, Standard Practice for X-Ray Determination of Retained Austenite in Steel with Near Random Crystallographic Orientation. https://doi.org/10.1520/E0975-13
- 45) T. Ungár, I. Dragomir, Á. Révész and A. Borbély: J. Appl. Crystallogr., 32 (1999), 992.
- 46) F. HajyAkbary, J. Sietsma, A. J. Böttger and M. J. Santofimia: Mater. Sci. Eng. A, 639 (2015), 208.
- 47) K. W. Andrews: J. Iron Steel Inst., 203 (1965), 721.
- 48) B. Kim, E. Boucard, T. Sourmail, D. San Martin, N. Grey and P. E. J. Rivera-Diaz-del-Castillo: Acta Mater., 68 (2014), 169.
- 49) J. Klemm-Toole, J. Benz, I. Vieira, A. J. Clarke, S. W. Thompson and K. O. Findley: Mater. Sci. Eng. A, 786 (2020), 139419. https://doi.org/10.1016/j.msea.2020.139419
- 50) J. H. Hollomon and L. D. Jaffe: Trans. AIME, 162 (1945), 223.
- 51) E. J. Pavlina and C. J. Van Tyne: J. Mater. Eng. Perform., 17 (2008), 888.
- 52) C. Gomes, A.-L. Kaiser, J.-P. Bas, A. Aissaoui and M. Piette: Rev. Metall., 107 (2010), 293.
- 53) D. Tabor: J. Inst. Met., 79 (1951), 1.
- 54) M. C. Shaw and G. J. Desalvo: Metallogr. Microstruct. Anal., 6 (2012), 310. https://doi.org/10.1007/s13632-012-0047-3
- 55) I. I. Kovenskiy: Phys. Met. Metallogr., 16 (1963), 107.
- 56) L. Cheng, C. M. Brakman, B. M. Korevaar and E. J. Mittemeijer: Metall. Trans. A, 19 (1988), 2415.
- 57) R. Angers and F. Claisse: Can. Metall. Q., 7 (1968), 73.
- 58) R. W. Balluffi, S. M. Allen and W. C. Carter: Kinetics of Materials, John Wiley & Sons, Hoboken, NJ, (2005), 539.
- 59) Y. Tomita: J. Mater. Sci., 24 (1989), 731.
- 60) S. Primig and H. Leitner: Thermochim. Acta, 526 (2011), 111. https://doi.org/10.1016/j.tca.2011.09.001
- 61) M. Jung, S. Lee and Y. Lee: Metall. Mater. Trans. A, 40 (2009), 551. https://doi.org/10.1007/s11661-008-9756-2
- 62) M. Van Rooyen and E. J. Mittemeijer: Scr. Metall., 16 (1982), 1255.
- 63) M. K. Miller, P. A. Beaven and G. D. W. Smith: Metall. Trans. A, 12 (1981), 1197.
- 64) P. V. Morra, A. J. Böttger and E. J. Mittemeijer: J. Therm. Anal. Calorim., 64 (2001), 905.
- 65) T. A. Balliett and G. Krauss: Metall. Trans. A, 7 (1976), 81.
- 66) E. Kozeschnik and H. K. D. H. Bhadeshia: Mater. Sci. Technol., 24 (2008), 343.
- 67) R. P. Smith: J. Am. Chem. Soc., 70 (1948), 2724.
- 68) A. J. Heckler and P. G. Winchell: Trans. Metall. Soc. AIME, 227 (1963), 732.
- 69) S. S. Babu, K. Hono and T. Sakurai: Appl. Surf. Sci., 67 (1993), 321.
- 70) S. S. Babu, K. Hono and T. Sakurai: Metall. Mater. Trans. A, 25 (1994), 499.
- 71) R. C. Thomson and M. K. Miller: Appl. Surf. Sci., 87–88 (1995), 185.
- 72) R. C. Thomson and M. K. Miller: Appl. Surf. Sci., 94–95 (1996), 313.
- 73) R. C. Thomson and M. K. Miller: Acta Mater., 46 (1998), 2203.
- 74) F. S. Buffington, K. Hirano and M. Cohen: Acta Metall., 9 (1961), 434.
- 75) H. Oikawa: Crit. Rev. Technol. Rep., 7 (1983), 77.
- 76) J. G. Speer, D. V. Edmonds, F. C. Rizzo and D. K. Matlock: Curr. Opin. Solid State Mater. Sci., 8 (2004), 219.
- 77) A. S. Podder and H. K. D. H. Bhadeshia: Mater. Sci. Eng. A, 527 (2010), 2121.
- 78) A. S. Podder, I. Lonardelli, A. Molinari and H. Bhadeshia: Proc. R. Soc. A, 467 (2011), 3141. https://doi.org/10.1098/rspa.2011.0212
- 79) T. T. W. Koopmans: M.S. Thesis, TU Delft, (2015), https://pdfs.semanticscholar.org/0968/3d8a7c37ebd3bc1aecbcfaa2f0c5a272062c.pdf, (accessed 2020-05-13).
- 80) B. Avishan, C. Garcia-mateo, S. Yazdani and F. G. Caballero: Mater. Charact., 81 (2013), 105.
- 81) K. Sugimoto, N. Usui, M. Kobayashi and S. Hashimoto: ISIJ Int., 32 (1992), 1311.
- 82) P. J. Gibbs, E. De Moor, M. J. Merwin, B. Clausen, J. G. Speer and D. K. Matlock: Metall. Mater. Trans. A, 42 (2011), 3691.
