Transformations and Microstructures
Behavior of V-Ti Elements in Warm-Rolled Transformation-Induced Plasticity Steel with Medium Manganese Content
2020 Volume 60 Issue 3 Pages 556-563

Details
2020 Volume 60 Issue 3 Pages 556-563
To reveal the law governing V-Ti precipitation behavior in warm-rolled transformation-induced plasticity (TRIP) steel, two steel samples including 0.072V-0.051Ti steel (Bear-V-Ti steel) and 0.001V-0.001Ti steel (Free-V-Ti steel) are designed. Based on a comparative analysis, the former has an excellent combination of mechanical properties including a total elongation (TE) of 37%, ultimate tensile strength (UTS) of 935 MPa, and UTS×TE of 34 GPa·% after annealing at a temperature of 650°C. The superior mechanical properties are attributable to particles that precipitate in a composite form of (V-Ti)C/N at 650°C. These particles can refine the grains and improve the tensile strength of Bear-V-Ti steel. However, it should be noted that the two roles of precipitates in steel are size dependent. For sizes between 10–20 nm, the role mainly entails pinning the dislocation. This accounts for the precipitation strength. As the size increases to 20–60 nm, the role mainly involves pinning of the grain boundary, which leads to fine crystal reinforcement. These results provide useful data for the production of medium manganese steel using the warm-rolled process.
Medium and high Mn transformation-induced plasticity (TRIP) steels are currently of significant interest due to their superior combination of ultimate tensile stress (UTS) and total elongation (TE).1,2,3) In general, steel with sub-micron size grains has very high strength, however, it has limited strain-hardening and relatively low elongation. A lower ductility leads to less energy absorption and a corresponding lower index of passenger safety.4) To improve the properties of automobile steel to achieve superior passenger safety, TRIP steel specimens containing 4–10 Mn (in wt%) that can absorb some impact energy if a martensitic transformation occurs during the deformation process have been recently investigated.2,3) These samples were produced using a simple inter-critical annealing process after cold rolling and they have yield strengths (YS) of over 1000 MPa and a total elongation in excess of 45%.5,6) However, the production of cold-rolling steel with high yield strengths incurs additional costs due to the facilities and consumables required to generate high forming loads.7) Furthermore, elastic spring-back is poor and a stretch ability has been reported for very strong cold-formed steel specimens.7,8,9,10) As such, hot forming and warm forming techniques have recently regained popularity.11) The hot forming has been studied in our previous study.12) Recently, several warm forming studies focused on the dynamic recrystallization (DRX) and dynamic recovery (DRV) of ferrite and austenite during warm deformation process.13,14) The effects of alloys on the mechanical properties were also investigated with an emphasis on the Mn, C and Al content.15,16,17,18,19) Xu et al. studied the precipitation strength of steel samples with different Ti content and concluded that the strength increased as this content was increased.20) Moreover, it was determined that the precipitate of TiN particles pinned on the austenite grain boundary can refine grains21) and that fine grains can significantly enhance the strength and toughness of steel specimens.22,23,24) Batte et al. studied the precipitation behavior of VC and the effect of VC on precipitation strengthening of steel, it was determined that the mechanical properties were sensitive to the volume fraction of VC precipitate.25,26) Zhang studied the effect of VC precipitation on the grain refinement, it was found that vanadium could refine ferrite grains and improve the yield strength and tensile strength of low carbon steel.27) However, the influence of V and Ti on the properties of warm-rolled medium manganese steel is seldom studied.
To explore the behavior of V-Ti elements in medium manganese steel, two steel specimens including 0.072V-0.051Ti steel (Bear-V-Ti steel) and 0.001V-0.001Ti steel (Free-V-Ti steel) were produced. The objective of this study is to elucidate the effect of V-Ti on the mechanical properties and the precipitation behavior of these two steel specimens during the warm rolled process.
The chemical composition of experimental TRIP steel is presented in Table 1. A 55 kg experimental steel cast ingot was manufactured using a vacuum furnace. The ingot was heated at 1200°C for 2 h, hot-forged to rods with a section size of 100×30 mm, and subsequently air-cooled (AC) to room temperature. To adequately promote the solution treatment, the rods were soaked at 1200°C for 3 h and then hot-rolled to a thickness of 3.5 mm after seven passes in the temperature range of 1150–950°C. Finally, the hot-rolled sheets were warm-rolled to a thickness of 1.5 mm at the temperature of 650°C, and subsequently air-cooled (AC) to room temperature.
| steel | C | Mn | Al | V | Ti | P | S | N | O |
|---|---|---|---|---|---|---|---|---|---|
| Free-V-Ti-steel | 0.13 | 6.22 | 1.38 | 0.001 | 0.001 | ≤0.04 | ≤0.04 | 0.004 | 0.0012 |
| Bear-V-Ti-steel | 0.13 | 6.24 | 1.37 | 0.072 | 0.051 | ≤0.04 | ≤0.04 | 0.004 | 0.0013 |
To establish appropriate heat treatment schedules, the critical temperatures Ac1 and Ac3 of the two steel specimens were obtained based on the results of dilatometer experiments, shown by Fig. 1(a). Cylindrical specimens with a diameter of 3 mm and a length of 10 mm were investigated using a Formastor-FII full-automatic thermal dilatometer. Considering the regulation of precipitates with (V-Ti) C/N in austenite and ferrite, the as-warm-rolled sheets were soaked at temperatures of 600°C, 650°C, 700°C, and 750°C for 60 min, and then water-quenched (WQ) to room temperature (Fig. 1(b)). Tensile specimens of dimensions of 12.5 mm width and a gauge length of 35 mm were machined from the heat-treated sheets with the tensile axis parallel to the prior rolling direction. Tensile tests were performed at room temperature using a universal testing machine (SANSCMT5000) at a constant crosshead speed of 3 mm/min. The samples were etched with 25% sodium bisulfite solution. Microstructure examination was performed using a field emission gun scanning electron microscope (Ultra Plus-SEM, Zeiss) and transmission electron microscopy (G20-TEM, FEI) analysis. The grain size was measured by using the mean linear intercept method with help of an image processing software (Image-Pro Plus 6.0). The volume fraction of austenite was determined by X-ray diffraction (X Pertpro-XRD, PANalytical) with Cu Kα radiation using a direct comparison method28) that involved using the integrated intensities of (200)α and (211)α peaks in addition to those of (200)γ, (220)γ and (311)γ. The volume fraction of the austenite VA was calculated using equation as:29)
| (1) |
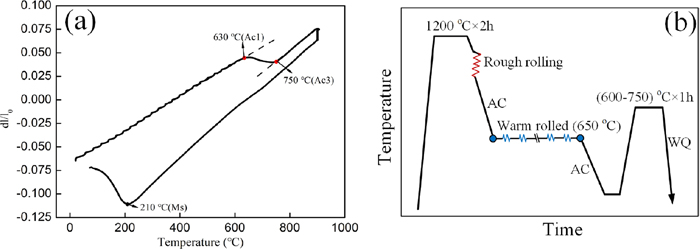
Dilatometric plots for the experimental steel specimens and the heat treatment process used in the present study: (a) dilatometric curve (dl: the ration of length change, lo: initial length); (b) warm rolling process. (Online version in color.)
The equilibrium phase fraction as a function of temperature was obtained from the TCFE7 database in Thermo-Calc. To obtain the various phase fractions between 20% and 70%, four inter-critical annealing temperatures ranging from 600–750°C were chosen. At 650°C, the fraction of austenite was predicted to be approximately 52% at the equilibrium state with cementite completely avoided. In this regard, a model has been proposed by Moor et al.30) To predict the fraction of stabilized austenite to room temperature via C, Mn, and Al partitioning from ferrite into austenite, the Koistinen-Marburger (KM) equation was used as follows:31)
| (2) |
| (3) |

Thermodynamics calculations for the Free-V-Ti steel and Bear-V-Ti steel based on the TCFE7 database by Thermo-Calc: (a) C content in austenite; (b) Mn content in austenite; (c) Al content in austenite; (d) the predicted fraction of retained austenite in Bear-V-Ti steel. (Online version in color.)
Figures 3(a)–3(d) show four groups SEM micrographs for the annealing of Bear-V-Ti steel from 600–750°C. Based on the morphology of these phases in SEM micrographs and the electron diffraction pattern in Fig. 5, the sunken phase and raised phase in Fig. 3 can be identified as α-ferrite (α-Fe) and austenite (A) respectively, and the offwhite phase and irregular coarse phase can be determined as δ-ferrite (δ-Fe) and martensite (M) respectively. For the samples annealed at 600°C and 650°C, the microstructure constituents are δ-ferrite, α-ferrite and austenite. Austenite has two morphologies that include lath-like and equiaxial elements. Equiaxial austenite is the main phase at 650°C, as represented by Figs. 3(a) and 3(b), respectively.

SEM micrographs of warm-rolled Bear-V-Ti steel samples after annealing at different temperatures: (a) 600°C; (b) 650°C; (c) 700°C; (d) 750°C.

TEM micrographs of warm-rolled Bear-V-Ti steel after quenching at different temperatures: (a) 600°C; (b) 650°C; (c) 700°C; (d) 750°C.
As the temperature increased to 700°C, the martensite phase begins to form and the grain size of δ-ferrite, α-ferrite and austenite increased as shown in Fig. 3(c). Beyond 750°C, the microstructure constituents were δ-ferrite and martensite, in which martensite was the main phase. δ-ferrite existed in the trigeminal grain boundary as shown in Fig. 3(d). The fraction of δ-ferrite did not increase, however, the grain size was increased. The original austenite grain size can grow up to 4–10 μm. Similar characteristic morphology of δ-ferrite, α-ferrite, austenite, and martensite phase was observed in Free-V-Ti steel during quenching from 600–750°C, as shown by Figs. 4(a)–4(d). It is evident that the influence of V-Ti on the phase fraction of steel is not readily apparent. To further observe the details of the microstructure and defects in the phases, TEM images are presented in Fig. 5.

SEM micrographs of warm-rolled Free-V-Ti steel samples after annealing at different temperatures: (a) 600°C; (b) 650°C; (c) 700°C; (d) 750°C.
Figure 5 shows the detailed microstructure of ferrite and austenite of Bear-V-Ti steel. It was shown that many stacking faults were found in austenite during annealing at 600°C and 650°C. The stacking faults present different characteristics at different temperatures. At 600°C, there are fewer stacking faults observed in Fig. 5(a). As the temperature increased to 650°C, numerous faults appeared as shown in Fig. 5(b). The dislocation and default stacking are the main phases given that the precipitation particles of V-Ti can pin the dislocation and grain boundary. When the temperature increased to 750°C, it should be noted that the dislocation and dislocation cell were found in the martensite phase. This accounts for the decline in ductility and the increase in the tensile strength. The microstructure was composed of δ-ferrite and martensite, and martensite is the main phase. The grain size gradually increased with temperature from 600°C to 750°C. As the temperature increased from 600–650°C, both the grain size of ferrite and austenite increased from ~0.8 μm to 1.3 μm. When the temperature increased to 700°C, the grain size of austenite was ~1.6 μm, as shown by Fig. 5(c). As the temperature increased to 750°C, the grain size had a fast growing up, the original austenite grain size was ~5.3 μm, as shown by Fig. 5(d). By comparing the grain size of Free-V-Ti steel (~1.7 μm) at 650°C, it is found that the grain size of Bear-V-Ti steel was smaller, which indicated that V-Ti precipitation had an effect on grain growth.
3.3. The Fraction of Retained AusteniteFigures 6(a) and 6(b) shows a comparison of the X-ray diffraction pattern of un-deformed and fracture samples for Free-V-Ti steel and Bear-V-Ti steel at 650°C respectively. It is revealed that the austenite fraction was reduced to a small amount after tensile failure. The volume fraction of austenite in the fractured samples of Free-V-Ti steel and Bear-V-Ti steel were 13% and 11%, respectively. However, for the same condition of the un-fractured samples, the austenite fractions were 43.3% and 48.5%, respectively, as shown in Fig. 6(c). Therefore, the transformation rate of austenite in Free-V-Ti steel and Bear-V-Ti steel are 69.8% and 77% respectively, as shown in Fig. 6(d). Based on this analysis, it can be inferred that the transformation rate of Bear-V-Ti is higher than that of Free-V-Ti, which is well consistent with the predicted results. The concentration of C in retained austenite of Bear V-Ti steel is lower than that of Free V-Ti steel due to the precipitation of (V/Ti)C. As a result, the stability of retained austenite in Bear-V-Ti steel is obviously lower than that in the Free-V-Ti steel. It is generally considered that a lower stability of austenite leads to a smaller fraction of retained austenite after quenching treatment.16) However, it was found in our experiments that the fraction of retained austenite in Bear-V-Ti steel was significantly larger than that in Free-V-Ti steel (Fig. 6(c)) after quenching at 650°C.

Measured austenite fractions of Bear-V-Ti steel and Free-V-Ti steel: (a) XRD patterns of the Bear-V-Ti steel at 650°C; (b) XRD patterns of the Free-V-Ti steel at 650°C; (c) measured austenite fractions; (d) transformation rate of austenite. (Online version in color.)
Due to the large amount of retained austenite in the Bear-V-Ti steel and the suitable stability of the retained austenite, the Bear-V-Ti steel had a large TRIP effect during tensile deformation. This may be attributable to the refined grains of Bear-V-Ti steel during the warm-rolled process. These grains have a wider range of mechanical stability than that of Free-V-Ti steel, so they can transform in a more successive TRIP effect way during deformation. This behavior can result in more sustainable work hardening and the highest combination of ultimate tensile strength (UTS) and total elongation (TE).
3.4. Mechanical PropertiesThe mechanical properties and the effective influence of V-Ti on steel are illustrated in Figs. 7(a)–7(f). The UTS increased continuously from 650°C to 750°C. However, the TE of Bear-V-Ti steel and Free-V-Ti steel decreased with the increase in temperature after achieving peak values of 37.8% at 650°C (Free-V-Ti sample) and 36.8% at 650°C (Bear-V-Ti sample), respectively, as shown in Figs. 7(a) and 7(b), respectively. Considering the comprehensive mechanical properties, the product of UTS×TE reach a maximum of 34 GPa%, which is higher than the 30 GPa% of Free-V-Ti steel, as shown in Fig. 7(c). The yield strength (YS) of Bear-V-Ti steel and Free-V-Ti steel increased with an increase in temperature after attaining a minimum value of 395 MPa upon quenching from 700°C (Bear-V-Ti sample) and 485 MPa upon quenching from 700°C (Free-V-Ti sample) (Fig. 7(d)). For Bear-V-Ti steel, the grain size of austenite increased with an increase in temperature upon quenching from temperatures below 700°C. The yield strength (YS) and austenite grain size follow the Hall-Petch relationship. However, the increase in the YS after quenching from 700°C was because of the high fraction of martensite. Thus, the Bear-V-Ti steel sample quenched from 650°C exhibited the higher yield strength (765 MPa) than Bear-V-Ti steel sample (705 MPa). Compared to Free-V-Ti steel, Bear-V-Ti steel has a significantly higher UTS (935–1440 MPa) than Free-V-Ti steel (805–1500 MPa), but it has a similar TE (26–37%) to Free-V-Ti steel (27–38%). This is due to the behavior of the precipitation particles in Bear-V-Ti steel which will be examined in the following discussion.
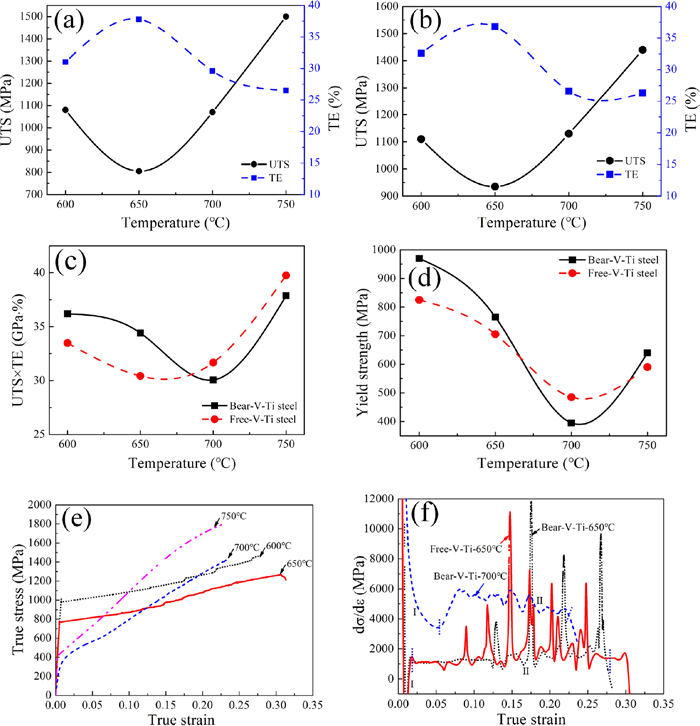
Mechanical properties of warm-rolled samples: (a) UTS and TE of Free-V-Ti steel; (b) UTS and TE of Bear-V-Ti steel; (c) UTS×TE of Free-V-Ti steel; (d) UTS×TE of Bear-V-Ti steel; (e) true strain-stress curves of Bear-V-Ti steel; (f) work hardening rate curves of Bear-V-Ti steel. (Online version in color.)
The flow stress of multiphase steel (σF) can be estimated using the rule of mixtures proposed by Embury and Bouaziz35) as follows:
| (4) |
To characterize the effect of V-Ti on the stability of austenite, work hardening curves (Fig. 7(f)) are used to explain this behavior. In the attempt to quantify this behavior, Eq. (5)36) was used:
| (5) |
In the case of Bear-V-Ti steel quenching at 700°C, the value of fγ0, fγ and ε are 27, 8, 0.27, respectively, the K was 4.5 and the fluctuation of work hardening (WH) curve is exhibited three stages, the first stage (I) relate to deformation of ferrite, the second intermediate stage (II) characterized by an increase in the work hardening rate was attributed to a significant occurrence of the TRIP effect and martensite. Interestingly, a distinct difference in stage (II) of the samples heated at 650°C is that the WH curve characterizes by strong fluctuation. Comparing the curve of Bear-V-Ti steel with that of Free-V-Ti steel, it can be found both these two curves have similar fluctuation zones. However, there is a platform zone in the range of 0.08–0.12 for that of Bear-V-Ti steel. This indicates that the Bear-V-Ti steel does not exhibit a TRIP effect in the lower strain range during the tensile deformation process due to grain refinement. Calculation results with Eq. (5) indicate the K values for curve of Bear-V-Ti steel (fγ0, fγ and ε are 47, 11.8, 0.37, respectively) and that of Free-V-Ti steel (fγ0, fγ and ε are 43, 13, 0.39, respectively) are 3.7 and 3.1, respectively. This implies that a relatively higher TRIP effect and work hardening ability in Bear-V-Ti steel at this temperature. This is directly related to the observed serrations in the true stress-strain plot presented in Fig. 7(e). The serrated behavior is attributed to the discontinuous TRIP effect which involves stress relaxation and transfer during deformation, with consequent enhancement in ductility.
4.2. Precipitation and Yield StrengthThe precipitates of Bear-V-Ti steel are presented in Figs. 8(a)–8(d). It is evident that the precipitation particles with a size between 20–60 nm were pinned on the grain boundary in Fig. 8(a). Moreover, the precipitation particles were also pinned on the sub-grain boundary, as shown in Fig. 8(b). The particles can improve the yield strength (YS) via pinning on the grain boundary and inhibiting grain growth. Besides, the fine precipitation particles with a size between 10–20 nm were pinned on the dislocation as shown in Figs. 8(c) and 8(d). These particles could contribute to a significant increase of the tensile strength in ferrite and austenite by pinning and locking dislocations respectively.

TEM morphologies of precipitates in Bear-V-Ti steel: (a) V-Ti(C/N) precipitates pinning the grain boundary; (b) V-Ti(C/N) precipitates pinning the dislocation; (c) precipitation in the matrix; (d) EDS analysis results of precipitates.
Considering the effect of V-Ti on the stability of austenite, the results are clearly shown by Fig. 7(f). Based on the work hardening curve characteristics, it is evident that Bear-V-Ti steel has a lower work hardening rate, the less TE and discontinuous TRIP effect, but the fraction of austenite is higher than Free-V-Ti steel (shown by Fig. 6(c)). Based on above discussion, it can evidence that TRIP effect is primarily influenced by austenite stability rather than austenite fraction. The presence of fine grains can promote the YS and the tensile strength, but the ductility is less than that of Free-V-Ti steel. Because the V and Ti can be combined with C in retained austenite and form (V-Ti)C precipitate (as shown in Figs. 8(a)–8(c)) and the loss of C in austenite makes the mechanical stability decline, but the combined mechanical properties are superior compared to that of Free-V-Ti steel. Therefore, the conclusion is well validated by the experiments using the Bear-V-Ti and Free V-Ti steel specimens.
The microstructural evolution, mechanical properties, and deformation behavior of Free-V-Ti and Bear-V-Ti steel specimens were studied in detail. The major findings of the study are as follows:
(1) The microstructure of warm-rolled Bear-V-Ti steel with a morphology depicting metastable, multiphase, and multi-size characteristics led to superior strength in Bear-V-Ti steel during annealing at an inter-critical temperature. The addition of V-Ti elements cannot change the phase morphology, however, it can reduce the stability of austenite due to the decrease of C content.
(2) Compared to Free-V-Ti steel, Bear-V-Ti steel exhibited a better combination of mechanical properties that are characterized by an excellent combination of TE of 37%, UTS of 935 MPa and UTS×TE of 34 GPa·%, during the warm-rolled process. Bear-V-Ti steel exhibited superior yield strength and comprehensive mechanical properties due to the precipitation of V-Ti pinning the grain boundary and dislocations.
(3) The precipitate is formed in a composite form of (V/Ti)C/N and the size of the precipitated particles ranged between 10–20 nm. It played a main role in precipitation strength. When the size is between 20–60 nm, the fine-grain strength dominates. The combination of two strengthening effects further improves the overall mechanical properties of the Bear V-Ti steel.
This work was financially supported by the National Natural Science Foundation of China (U1660204, 51774075) and Fundamental Research Funds for Central Universities of China (N182504013).