Abstract
The mechanism of recrystallization texture development of cold-rolled metal and steel largely depends on the material chemical composition, cold-rolling reduction, and annealing treatment conditions. To clarify the mechanism, it is important to identify the locations where recrystallization starts and progresses within cold-rolled materials.
Using laboratory diffraction contrast tomography (LabDCT), three-dimensional (3D) crystal orientation mapping corresponding to different stages of recrystallization has been successfully performed for pure iron sheets that were severely cold-rolled and heated at different temperatures.
In cold-rolled iron with 99.2% reduction, the deformation texture was a strong α-fiber (RD//<110>). During annealing in the temperature range of 773–973 K, recrystallized grains were formed with textural components of {100}, {211}, {111} and {411}, and the α-fiber changed to the {100}<012> component. Recrystallized grains were generated at rather random locations within the sample. The size of recrystallized grains in the center region was 20–30% larger than that in the surface region. These results suggest that the nucleation is driven by the large strain caused by severe rolling. The number of recrystallization sites was larger in the surface region than in the center region and the competition of selective growth among recrystallized grains was more severe in the surface region, resulting in a smaller grain size.
The volume data of the 3D crystal orientation mapping obtained by LabDCT provided crucial information for understanding the recrystallization mechanism including the nucleation and/or selective growth.
1. Introduction
Many metallic materials are initially produced as large castings, which are then further processed in the solid state by forging, rolling and so on, to obtain the final products. This includes thermomechanical processes, such as recovery, recrystallization, and grain growth, which are key elements for controlling the microstructure of the material to obtain the target mechanical properties. In past decades, numerous studies have been conducted on the recrystallization of steels.1,2,3,4,5,6) The recrystallization behavior of cold-rolled steel largely depends on many factors such as the chemical composition of the steel, rolling reduction, and annealing conditions. Cold-rolled steel shows the unique evolution of preferred orientation of grains (texture) during annealing, which has been explained by two mechanisms: oriented nucleation and/or selective grain growth. Various analytical techniques have been utilized to investigate these mechanisms. Three-dimensional (3D) crystal orientation mapping, measuring both the grain shape and crystallographic orientation, is a powerful technique for understanding the recrystallization mechanism, especially regarding the contribution of selective nucleation and/or growth.
The structural heterogeneity of materials is essentially a 3D characteristic, which poses a challenge for microstructure examination on the sectioned sample surface using electron microscopy (EM) techniques such as scanning electron microscopy (SEM), electron backscattered diffraction (EBSD) or electron channeling contrast (ECC) imaging. While the two-dimensional EM characterization can be extended to 3D through destructive serial sectioning, it is only suitable for relatively small sample volumes and its application to samples with a large-scale structural anisotropy as in the current work would be expensive and time-consuming.
With the development of novel X-ray based diffraction-imaging techniques over the past two decades, non-destructive 3D mapping of grain structures is now possible. 3D X-ray crystallographic imaging by diffraction contrast tomography (DCT) was first applied at high-energy synchrotron radiation X-ray facilities. Being able to map crystal grains and their orientation non-destructively in 3D opens the possibility for studying many aspects related to thermomechanical processing and damage mechanisms in polycrystalline materials. Examples of such studies with 3D grain mapping have been reported on grain growth,7,8,9) grain rotation during sintering10) and intergranular crack propagation for stress corrosion cracking,11) etc. The recently developed laboratory diffraction contrast tomography (LabDCT) has allowed the DCT technique to be used on the laboratory X-ray microscope, thus enabling wider accessibility and routine use of the technique for non-destructive and time-evolution experiments.12,13)
To discuss the contribution of oriented nucleation and selective grain growth in recrystallization of metals and steel, it is necessary to observe the heterogeneity of grain shapes and their crystallographic orientation in 3D. In the present study, the 3D grain structure of three severely cold-rolled pure iron samples annealed at different temperatures were characterized using LabDCT. Essential information is revealed about the polycrystalline microstructure, including both the morphology and crystallographic orientation of each grain. Further analysis is presented on the annealing texture, grain size evolution and the anisotropic annealing behavior with respect to the rolling geometry.
2. Experimental
An ingot of pure iron with the chemical composition shown in Table 1 was produced in a vacuum melting furnace. The ingot was annealed at 1473 K for 2 h in Ar gas for homogenization, and forged into a rectangular block with dimensions of 250W × 250L × 300T mm3. The forged sample was annealed at 1473 K for 2 h, and then hot-rolled by 80% with 15 passes into a 50 mm thickness. A block (100W × 200L × 50T mm3) was cut from the ingot and cold-rolled from 50 mm to 0.4 mm thickness, with a reduction of 99.2%. A sample measuring 25W × 25L × 0.4T mm3 was cut from the rolled sheet and annealed in the temperature range of 773–973 K in vacuum atmosphere (about 10−2 Pa) at a heating rate of 10 K/min, and then quenched by means of Ar gas down to room temperature. Optimization of DCT data acquisition required a sample with a low aspect ratio. Accordingly, we mechanically cut samples measuring 0.8W × 0.4L × 0.4T mm3 from the annealed sheet (Fig. 1).
Table 1. Chemical composition of the sample (mass ppm).
| C | P | S | Mn | N | O | Fe |
|---|
| < 10 | < 20 | < 3 | < 30 | 6 | 215 | Bal. |

The LabDCT characterization was conducted on a commercially available ZEISS Xradia 520 Versa X-ray microscope equipped with a LabDCT™ module. Figure 2 schematically illustrates the working principle of LabDCT.14) The instrument uses a polychromatic divergent X-ray beam instead of the parallel monochromatic beam typically used in the synchrotron X-ray DCT technique. An aperture (ca. 750 × 250 μm2) is placed between the source and the sample to constrain the incoming X-ray beam and to illuminate the sample only in the center region of the detector. A beam stop is placed between the sample and the detector blocking the transmitted X-rays to increase the sensitivity of the diffraction measurements. A high-resolution detector, a CCD (charged-coupled device) camera equipped with a scintillator at the front, is placed at the Laue focal plane with an equal distance (ca. 15 mm) between the source sample and sample detector. With this setup, crystal grains fulfilling the Bragg condition focus the divergent X-ray beams into a line in the diffraction pattern.13) The X-ray source power is 90 kV, 89 μA, and it takes about 15 hrs to obtain one DCT volume data.

At the acquisition stage, the first scan collects projections at increments through 360 degrees in the direct beam from which a 3D reconstruction of the absorption signal is created, as in traditional X-ray tomography. Subsequently, the source, sample, and detector are placed in a symmetric Laue geometry (Fig. 2) in which diffraction images are collected. The diffraction patterns are acquired on the outer region of the detector (Fig. 2) for fewer angular steps, which are used for reconstruction of the crystal grain orientations and morphology.
The collected absorption tomography and diffraction data was processed and reconstructed using the GrainMapper3D™ reconstruction software developed by Xnovo Technology ApS.13,14) The crystallographic reconstruction algorithm makes use of a combination of both back and forward projections in order to identify a set of potential candidate grain orientations for a given polycrystal. This is followed by an automated iterative search using a proprietary algorithm for grains with the highest confidence values within the sample volume. All the search results with confidence values below a certain threshold are filtered out. The reconstruction generates a 3D map of the grains in the scanned volume, including both the crystallographic orientation and morphology of the grains.15) In the present study, volumes of interest in the three samples were first defined and each was scanned, acquiring 180 diffraction projections over a 360° rotation.
3. Results and Discussion
3.1. Reconstruction of Data Obtained by LabDCT Measurements
Figure 3 shows examples of Laue diffraction patterns at a single rotation position for the samples. Evidence of the beam stop and the rectangular aperture as well as the illuminated sample volume can be seen at the center part of the projection. In the as-rolled sample, the diffraction signals are diffused and no distinct spots are observed because of the large strain; thus, the data was not processed for further analysis. In the annealed samples, a small amount of strain was introduced during sample preparation, so there are intensity streaks along the radial direction in the projection. For the samples annealed at 773 K and 873 K, a ‘banded’ distribution of diffraction spots can be observed as a result of closely oriented grains. As the sample rotates, a specified number of DCT scan projections is collected through a 360° rotation, and this data could be processed for further analysis, despite the banded distribution of spots.

Figure 4 shows the reconstructed 3D grain maps for the annealed samples. The rendered volumes in the top row are colored based on the orientation of the grains against the ND direction. The sample dimensions with respect to the rolling geometry are indicated in the figure. The rendered volumes shown in the bottom row are colored according to the completeness value, which ranges from 0 to 1 indicating the confidence index of the reconstructed grain. The completeness value is high inside the grain and drops at regions closer to the grain boundary, but the shape and orientation of the grains are fairly well reconstructed with sufficient quality to discuss the recrystallization mechanism.

It can be seen that regions are missing in the reconstructed volume, mostly close to the sample surface but also inside the sample annealed at 773 K. Two factors affect the quality of reconstruction in the present study. One is the strain introduced during sample machining, which has an effect on the diffraction signal of grains closer to the surface. For the sample annealed at 773 K, the grain size is relatively small, so for the same volume of the sample scanned, there is a large number of diffraction spots in one diffraction projection. Overlapping of diffraction spots is another factor affecting the quality of reconstruction by making segmentation of individual spots difficult, but its deteriorating effect can be greatly reduced by illuminating a smaller sample volume. In the reconstructed volumes, there are about 800 grains in the sample annealed at 973 K, 1200 grains in the sample annealed at 873 K and 1400 grains in the sample annealed at 773 K.
3.2. Macroscopic Features of Recrystallized Grain Orientation
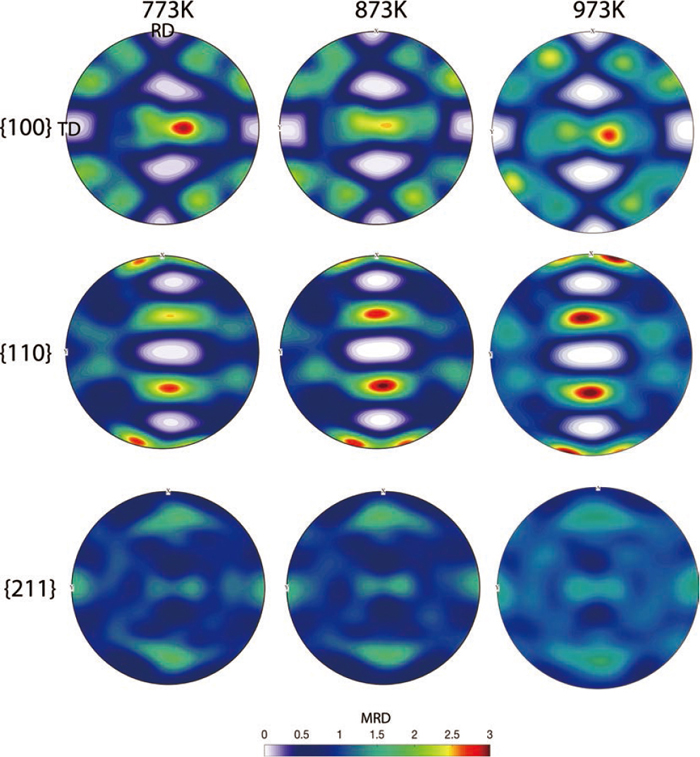
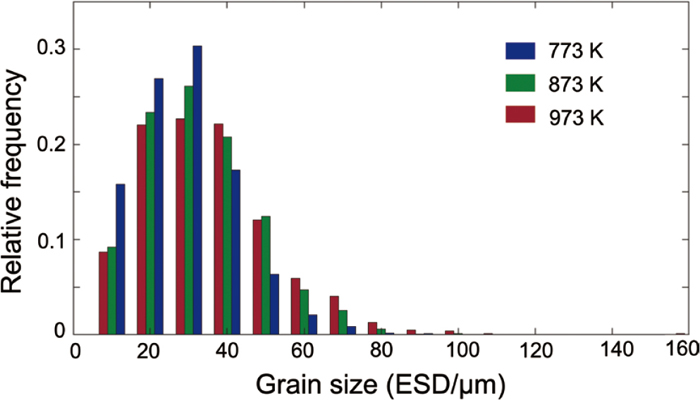
The macroscopic texture of the whole sample, obtained by summation of the crystallographic orientation of all grains, is discussed in order to confirm that the LabDCT measurements and their reconstruction analysis were correctly performed. Figure 4 shows that recrystallization progresses relatively randomly within the samples as the annealing temperature increases. Figure 5 shows a histogram of the grain size (equivalent spherical diameter: ESD) distribution of samples annealed at 773 K, 873 K and 973 K, showing the shift in distribution from smaller to larger ESDs with the increase in annealing temperature. Figure 6 shows the pole figures obtained by summing up all the grains. The pole figures of recrystallized grains were consistent with the reported studies:3,6) formation of textural components of {100}, {211}, {111} and {411} and the α-fiber change to the {100}<012> component during annealing in the temperature range of 773–973 K. This shows that the LabDCT measurements and their analysis in this study were performed reasonably well, even for the challenging samples with an exceedingly large number of grains (as many as 1400) illuminated in the field of view in DCT measurements.
LabDCT measurements successfully provided 3D mapping of the microstructures and crystallographic orientation of the recrystallized samples. To investigate possible differences in the recrystallization behavior among the regions differing in thickness in the ND direction, slices at various distances from the rolling surface along the ND direction were taken from the 3D grain map and analyzed.
Figure 7 shows the RD-TD slices at a 50-μm interval along the ND direction for samples annealed at 773 K, 873 K and 973 K. In the sample annealed at 773 K, recrystallized grains with a size of ~20–100 μm are formed in all regions of the sample, showing that recrystallization progresses rather randomly within the samples as the annealing temperature increases. As the annealing temperature increases from 773 K to 873 K and 973 K, some grains near the {100}<012> direction grow to a size >~100 μm.

The recrystallization progresses rather randomly within the samples and the grains near the {100}<012> direction show relatively faster grain growth. No distinguishing difference in this tendency was observed among the slices annealed at the same temperature, except for the grain size. The mean grain size (ESD) of each slice is shown in Fig. 8. The size of recrystallized grains in the center region is 20–30% larger than that in the surface region. These results suggest that the α-fiber region, which is generally considered difficult to recrystallize, can produce a large number of nucleation sites at rather random locations. The number of recrystallization sites may be more abundant in the surface region than in the center region because of the large strain, and the competition of selective growth among recrystallized grains is more severe in the surface region, resulting in a smaller grain size.

To investigate possible differences in the crystallographic orientation during grain growth among the regions differing in thickness in the ND direction, the volume data of 3D orientation mapping was separated into three sections along the ND direction (Fig. 9). Pole figures of each slab were obtained (Figs. 10, 11 and 12). Figure 10 shows that the {100}<012> component developed even in the sample annealed at 773 K, and no clear difference was found in the texture development in any of the sections (top, center, and bottom) other than the grain size, as shown in Fig. 8. Figures 11 and 12 show the development of the same {100}<012> component in specimens annealed at 873 K and 973 K, and their degree of development is almost the same as that of the sample annealed at 773 K. These results suggest that the recrystallized grains were formed by annealing at 773 K, and that the selective growth of grains near the {100}<012> component follows this when annealed at the higher temperatures of 873 K and 973 K. In other words, selective grain growth is dominant at these temperatures.

Recrystallization behavior of heavily cold-rolled pure iron rolled up to 90.0% and 99.8% and annealed in the temperature range of 400–773 K was investigated by OM, SEM and EBSD.6) The study reported that recrystallization was completed, resulting in near {100} recrystallized grains of 10–20 μm at 773 K and that the recrystallized grains grew to 20–50 μm at 873 K in the 99.8% cold-rolled sample. It was also reported that fine lamellar structures with elongated location cells were observed and that the α-fiber changed to the {100}<012> component, during annealing in the temperature range of 773–973 K.
In that report, however, the heterogeneity of recrystallization was discussed based on the results of EBSD measurements of a specific cross section of the sample. Here, we successfully performed the 3D crystal orientation mapping including the shape of each grain using LabDCT. It was clearly shown that the results in the present study (99.2% cold-rolled sample) are basically consistent with those of the 99.8% cold-rolled sample. Recrystallization was found at rather random locations within the sample annealed at 773 K, resulting in the development of the {100}<012> component. These results showed that recrystallized grains would be able to nucleate from the α-fiber region in the 99.2% cold-rolled sample. It was reported that recrystallization from {100}<011> grains was possible by cold-rolling with a high reduction, because the misorientation in {100}<011> grains increased due to the high cold-rolling reduction.16)
The selective growth of grains near the {100}<012> component follows this when annealed at the higher temperatures of 873 K and 973 K. The size of recrystallized grains in the center region was 20–30% larger than that in the surface region. These results suggest that the number of recrystallization sites is greater in the surface region due to the large strain. Thus, the competition of selective growth among recrystallized grains is more severe in the surface region, resulting in a smaller grain size.
Consequently, it is suggested that the α-fiber region, which is generally considered difficult to recrystallize, can produce a large number of nucleation sites due to high strain energy. Too many nucleation sites, such as in the surface region, may cause impingement or severe competition in the subsequent orientation growth. The grain size is smaller in the surface region than in the center region, whereas no texture change occurs until the completion of recrystallization.
The recrystallization behavior of as-deformed steels has been described by phenomenological models such as the Kolmogorov–Johnson–Mehl–Avrami (KJMA) model.4) To understand the details of the microstructural evolution during heating processes, micro- to mesoscopic approaches have been utilized, such as Monte Carlo simulation3) and phase field methods.17,18,19,20) To validate these models and more fully understand recrystallization, detailed information on the microstructural evolution of as-deformed states and during the heating processes is needed. The present study showed that 3D crystal orientation mapping including the shape of each grain using LabDCT is a powerful approach.
4. Conclusion
The recrystallization behavior and texture evolution of severely cold-rolled pure iron was investigated using LabDCT, which provides 3D grain maps including both grain morphology and orientation information. A large amount of statistics is obtained with as many as 1400 grains illuminated in one region of measurements, providing the statistically necessary information in 3D for analysis of heterogenous annealing behavior.
As a result of nucleation from the α-fiber region, recrystallization was found to progress at 773 K, resulting in the development of the {100}<012> component. Recrystallization was at rather random locations within the whole of the sample. The selective growth of grains followed this, whereas the {100}<012> texture remained, when annealed at higher temperatures of 873 K and 973 K. In all samples, the size of recrystallized grains in the center region was 20–30% larger than that in the surface region. This may be caused by selective growth governed by the size effect as a result of impingement or severe competition among abundant recrystallized grains.
Acknowledgements
We thank KEK and Nippon Steel Co. for their fruitful collaboration.
References
- 1) M. Matsuo: ISIJ Int., 29 (1989), 809.
- 2) F. J. Humphreys and M. Hatherly: Recrystallization and Related Annealing Phenomena, Elsevier, Oxford, (1995), 173.
- 3) R. D. Doherty, D. A. Hughes, F. J. Humphreys, J. J. Jonas, D. J. Jensen, M. E. Kassner, W. E. King, T. R. McNelley, H. J. McQueen and A. D. Rollett: Mater. Sci. Eng. A, 238 (1997), 219.
- 4) R. A. Vandermeer: Acta Mater., 53 (2005), 1449.
- 5) M. Oyarzábal, A. Martínez-de-Guerenu and I. Gutiérrez: Mater. Sci. Eng. A, 485 (2008), 200.
- 6) M. Tomita, T. Inaguma, H. Sakamoto and K. Ushioda: ISIJ Int., 56 (2016), 693.
- 7) W. Ludwig, S. Schmidt, E. M. Lauridsen and H. F. Poulsen: J. Appl. Crystallogr., 41 (2008), 302.
- 8) G. Johnson, A. King, M. G. Honnicke, J. Marrow and W. Ludwig: J. Appl. Crystallogr., 41 (2008), 310.
- 9) W. Ludwig, A. King, P. Reischig, M. Herbig, E. M. Lauridsen, S. Schmidt, H. Proudhon, S. Forest, P. Cloetens, S. R. du Roscoat, J. Y. Buffière, T. J. Marrow and H. F. Poulsen: Mater. Sci. Eng. A, 524 (2009), 69.
- 10) M. Syha, W. Rheinheimer, M. Bäurer, E. M. Lauridsen, W. Ludwig, D. Weygand and P. Gumbsch: Scr. Mater., 66 (2012), 1.
- 11) A. King, G. Johnson, D. Engelberg, W. Ludwig and J. Marrow: Science, 321 (2008), 382.
- 12) P. Reischig, A. King, L. Nervo, N. Vigano, Y. Guilhem, W. J. Palenstijn, K. J. Batenburg, M. Preuss and W. Ludwig: J. Appl. Crystallogr., 46 (2013), 297.
- 13) F. Bachmann, H. Bale, N. Gueninchault, C. Holzner and E. M. Lauridsen: J. Appl. Crystallogr., 52 (2019), 643.
- 14) J. Oddershede, J. Sun, N. Gueninchault, F. Bachmann, H. Bale, C. Holzner and E. Lauridsen: Integr. Mater. Manuf. Innov., 8 (2019), 217.
- 15) C. Holzner, L. Lavery, H. Bale, A. Merkle, S. McDonald, P. Withers, Y. Zhang, D. Juul Jensen, M. Kimura, A. Lyckegaard, P. Reischig and E. M. Lauridsen: Microsc. Today, 24 (2016), 34.
- 16) M. Z. Quadir and B. J. Duggan: Acta Mater., 52 (2004), 4011.
- 17) J. A. Warren, R. Kobayashi, A. E. Lobkovsky and W. C. Carter: Acta Mater., 51 (2003), 6035.
- 18) T. Takaki, Y. Hisakuni, T. Hirouchi, A. Yamanaka and Y. Tomita: Comput. Mater. Sci., 45 (2009), 881.
- 19) M. Militzer and H. Azizi-Alizamini: Solid State Phenom., 172–174 (2011), 1050.
- 20) B. Zhu and M. Militzer: Model. Simul. Mater. Sci. Eng., 20 (2012), 085011.