Abstract
A rotating crucible viscometer previously developed by the authors was improved in order to measure wide-range of viscosity values with high reliability. Two sets of inner cylinder and crucible with different geometries were employed as an attempt to accomplish this objective. The centers of these components were matched with accuracy of ± 0.1 mm by adopting X-Y stage for positioning. Relative error in torque measurement was less than 1.5%, and calibration curves had a good consistency for all experiments. By using the improved viscometer, a typical molten salt, LiF–10 mol% NaF–45 mol% KF (FLiNaK), a high-temperature low viscosity liquid, was measured and the results agreed with the theoretical values estimated from pure substances relations. Viscosity of the SiO2–Na2O–NaF system (CNa2O/CSiO2 = 0.67 in mol%) was obtained by varying concentration range from 0 to 80 mol% NaF. All melts’ composition tested followed Arrhenius-type temperature dependence, and a viscosity relation at 1473 K based on composition was also obtained. Drastic decreases in activation energy for viscous flow were observed at the concentrations of 5 and 80 mol% NaF.
1. Introduction
A flux (e.g. mold flux) and slag (e.g. ESR slag) are indispensable for producing high quality steel since they are used as lubricant and protect agents. A low melt viscosity, which is often achieved by adding fluoride, such as CaF2, is the most important property in the composition’s selection. Some composition examples of mold flux and ESR slag are shown in Table 1.1,2)
Table 1. Composition examples of mold flux and ESR slag.
1,2)| No. | Concentration of component i, Ci (mol%) |
|---|
| SiO2 | CaO | Al2O3 | Na2O | CaF2 | Others |
|---|
| A (Mold flux) | 40.03 | 32.0 | 6.0 | 5.0 | 4.0 | 13.0 |
| B (Mold flux) | 33.0 | 36.0 | 8.0 | 9.0 | 8.0 | 6.0 |
| C (Mold flux) | 24.0 | 32.0 | 7.0 | 10.0 | 20.0 | 7.0 |
| D (Mold flux) | 35.0 | 12.0 | 1.0 | 8.0 (Na2O+K2O) | 44.0 | 24.0 |
| E (ESR slag) | 10.0 | 10.0 | 10.0 | 0.0 | 60.0 | 10.0 |
| F (ESR slag) | 5.0 | 0.0 | 0.0 | 0.0 | 92.0 | 3.0 |
The main components are SiO2 and CaO. CaF2 is also added in a wide range of concentrations. Molten calcium silicate generally shows high viscosity (of the order of several thousand of mPa·s). Viscosity of CaF2, on the other hand, is very low of several mPa·s.3) By adding CaF2 in molten calcium silicate, the viscosity can be controlled by varying CaF2 concentration. The schematic illustration of viscosity range of molten flux and slag as well as suitable viscosity measurement methods are shown in Fig. 1.4,5)
From the figure, it is possible to observe that rotating and oscillating crucible are suitable methods for high viscosity melt and for low viscosity melt respectively, however, an unmeasurable region between these two zones exists. It is expected that measurable range of rotating crucible method is extended in order to reveal accurate composition dependence of viscosity.
As a pioneering research, Shiraishi et al. developed an ultra-wide range viscometer which can be applied to a viscosity range from 1012 to 101 Pa·s.6,7) The viscometer consisted of a combination of indentation, parallel plate, and rotational plate method. The measurable viscosity range is at higher region compared to the region investigated in this study. However, the concept of measurement by a viscometer gives us important suggestion.
As shown in Table 1, the mold flux and ESR slag also contains Na2O. When both CaF2 and Na2O are added, it is estimated that coordination manner changes according to the following reaction:
|
Ca
F
2
+N
a
2
O=2NaF+CaO
| (1) |
|
Δ
G
(1)
∘
=-131 kJ⋅mo
l
-1
at 1 700 K
| (2) 8) |
The reaction on
Eq. (1) is not fully completed, since the connection of O
2− and F
− ions to both Ca
2+ and Na
+ ions depends on melt composition and elements concentration. It is important to obtain reliable viscosity data in simple and controlled system as a first step in order to analyze a complex one.
In this study, therefore, a rotating crucible viscometer previously developed by the authors was improved in order to measure wide-range of viscosity values with high reliability. In order to test the improved viscometer’s capability, LiF–NaF–KF melts’ viscosity was measured and the results were compared with theoretical relations.
2. Experimental
2.1. Experimental Apparatus
The principle of measurement and the experimental apparatus have been described in previous articles.9,10) This section main objective is, therefore, to emphasize important points including differences and improvements.
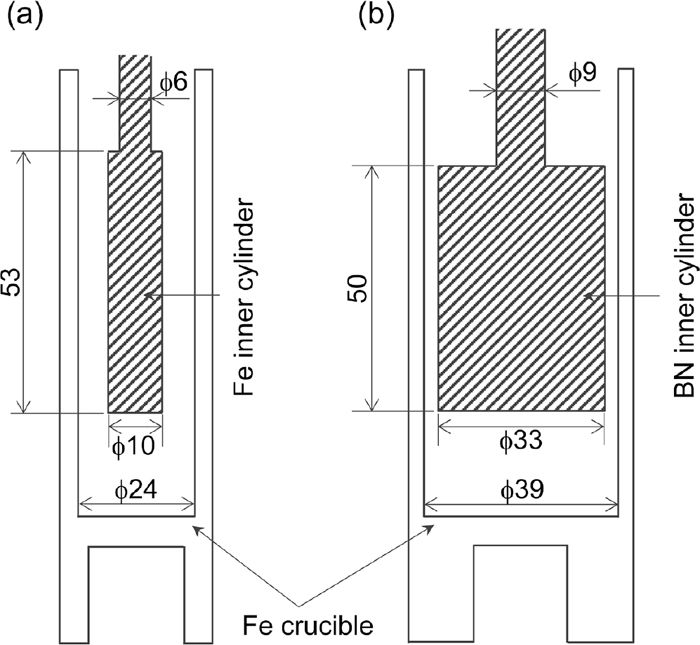
Schematic illustrations of viscometers for room temperature (viscometer A) and high temperature (viscometer B) measurements are shown in Figs. 2 and 3, respectively. Crucible and inner cylinder’s dimensions for high and low viscosity liquids, employed for high temperature measurements, are shown in Fig. 4.
For high viscosity melt, an Fe crucible (99.8% purity) with 24 mm inner diameter and an Fe inner cylinder (99.8% purity) with 10 mm outer diameter were coupled in the equipment. Meanwhile, for low viscosity melt, a crucible, made of the same material, with inner diameter of 39 mm and a BN inner cylinder (99% purity) with outer diameter of 33 mm were used. At room temperature measurement (~20°C), a brass crucible and an Fe inner cylinder with same dimensions both for high and low viscosity were used.
Crucibles were connected to a motor (Brushless DC motor, Oriental Motor Co., Ltd.) through a steel spindle while inner cylinders were suspended by a φ 3 mm diameter SUS 304 or Mo alloy spindle for room and high temperature cases respectively, connected to a torque sensor (MD-201C, Ono Sokki Co., Ltd.). The measurable torque range of the sensor, mounted on an X-Y stage (position resolution: 0.01 mm), is 0.001 to 2 mN·m. The centers of the crucible and the inner cylinder were aligned precisely and the tip of the inner cylinder was placed 20 mm above the bottom of the crucible. The length of shaft of the inner cylinder immersed in the sample melt is approximately 10 mm.
Prior to high temperature measurement, a calibration curve showing the relationship between viscosity and torque, was created by applying silicone oils as the standard liquid (10–4888 mPa·s) at room temperature. The viscosity of liquid is expressed by the following equation.4,5,11)
|
η=
F
4πhω
(
1
r
1
2
-
1
r
2
2
)
| (3) |
where
η is the viscosity,
F is the torque,
h is the face-to-face distance of crucible and inner cylinder,
ω is the relative angular rate and
r1 and
r2 are the radius of inner cylinder and crucible respectively. By transforming
Eq. (3), the following equation is obtained.
|
F
η
=
4πh
r
2
2
r
1
2
r
2
2
-
r
1
2
ω=Kω
| (4) |
where
K is the apparatus constant which depends only on the geometry and spatial distance of crucible and inner cylinder. By changing angular rate from 1.05 to 20.94 rad·s
−1 (10 to 200 rpm), linearity and consistency of calibration curves were verified.
Comparison between previous and present viscometers for low viscosity measurement is summarized in Table 2, where geometric dimensions of apparatus are shown. Overall, size of apparatus was enlarged. Aspect ratio (height of inner cylinder is divided by outer diameter of inner cylinder) was slightly increased. Clearance between crucible and inner cylinder was slightly decreased, but theoretical apparatus constant was significantly increased, which means that sensitivity was significantly increased.
Table 2. Comparison between previous and present viscometers for low viscosity measurement.
| Inner diameter of crucible, di/mm | Outer diameter of inner cylinder, do/mm | Height of inner cylinder, h/mm | Aspect ratio, h/do (−) | Clearance, dc/mm | Theoretical apparatus constant, K/m3 |
|---|
| Previous10) | 18 | 14 | 20 | 1.43 | 2 | 3.1×10⁻⁵ |
| Present | 39 | 33 | 50 | 1.52 | 3 | 6.0×10⁻⁴ |
In the rotating crucible method, the sample melt’s flow should be laminar around the axis of rotation since turbulent flows hinders the precise measurement. A special attention was, therefore, given on keeping the temperature uniformity inside the furnace in order to prevent a convection flow at high temperatures. The furnace consisted of three stacked heating elements made of molybdenum disilicide (MoSi2) was controlled independently. Furthermore, the radiation from the center of furnace was decreased by placing many tungsten plates, which functioned as thermal shields. As a result, an excellent temperature uniformity (±0.4 K around a whole crucible) was achieved.
2.2. Sample Preparation
LiF–NaF–KF (LiF–10 mol% NaF–45 mol% KF; ternary eutectic composition, called as FLiNaK12)) and SiO2–Na2O–NaF salts were used as samples for high temperature measurement. To produce the first salt composition, LiF powder (>99.0%, Kanto Chemical Co., Inc.), NaF powder (>99.0%, Kanto Chemical Co., Inc.), and KF powder (>99.0%, Wako Pure Chemical Industries Co.) were mixed and placed in the Fe crucible.
Meanwhile, sample compositions for SiO2–Na2O–NaF system are summarized in Table 3 and also plotted in a composition triangle shown in Fig. 5.
Table 3. Experimental conditions and results for the viscosity measurement for SiO
2–Na
2O–NaF system.
Exp.
No. | Concentration of component i,
Ci (mol%) a | Basicity,
CNa2O/CSiO2 | Temperature range
measured,
T/K | Viscosity of melts,
log (η/mPa·s) = a + 1000b/T | log (η/mPa·s)
at 1473 K | Activation
energy,
E/ kJ·mol−1 |
|---|
| Na2O | NaF | SiO2 | a | b |
|---|
| A | 40 | 0 | 60 | 0.67 | 1325–1473 | −2.719 | 9.569 | 3.777 | 183 |
| B | 38 | 5.0 | 57 | 0.67 | 1283–1473 | −1.560 | 7.432 | 3.486 | 142 |
| C | 36 | 10 | 54 | 0.67 | 1174–1473 | −1.448 | 7.022 | 3.319 | 135 |
| D | 30 | 25 | 45 | 0.67 | 1173–1473 | −2.757 | 7.107 | 2.068 | 136 |
| E | 20 | 50 | 30 | 0.67 | 1266–1473 | −3.984 | 7.622 | 1.191 | 146 |
| F | 16 | 60 | 24 | 0.67 | 1273–1473 | −3.293 | 6.411 | 1.059 | 123 |
| G | 10 | 75 | 15 | 0.67 | 1319–1473 | −4.036 | 6.728 | 0.531 | 129 |
| H | 8.0 | 80 | 12 | 0.67 | 1323–1473 | −0.849 | 1.932 | 0.463 | 37 |
a: Value of initial composition in sample preparation.

SiO2 powder (>99.5%, Kanto Chemical Co., Inc.), Na2CO3 powder (>99.5%, Kanto Chemical Co., Inc.), and NaF powder (>99.0%, Kanto Chemical Co., Inc.) were the starting chemicals. The mixture of SiO2 and Na2CO3 was melted after CO2 degassing and held, at 1673 K, in an open Pt crucible for 30 to 60 min in order to prepare SiO2–Na2O master slags. The melt was poured on a cold Cu plate to make a cullet. For ternary component samples, the mixture of master slag and NaF was melted and held at 1573 K in the same Pt crucible for 10 min to prepare the SiO2–Na2O–NaF sample. The sample’s mass after the preparation differenced with estimated values by a reasonable value (±0.5%). In this study, basicity B defined by the ratio of CNa2O/CSiO2 in mol% was set to be 0.67 while the concentrations of NaF were 0, 5, 10, 25, 50, 60, 75, and 80 mol%.
2.3. Measurement Procedure
The prepared sample charged in the Fe crucible was placed in an alumina tube of the furnace. After its evacuation, Ar (99.998% purity) was introduced, because loss of fluoride from melting is effectively suppressed by measuring the melt viscosity in the hermitically sealed apparatus under Ar atmosphere.9) The samples were, afterward, heated and melted at 1473 K, and the inner cylinder was immersed in the melts for 30 min. The crucible was then rotated at a suitable rate, from 5.24 to 15.71 rad·s (50 to 150 rpm), and the torque applied to the inner cylinder was recorded for 120 s by periods of 0.5 s, resulting in 240 points, which were averaged. The measurement was also conducted in a cooling step, the sample was reheated when the torque was drastically increased as a consequence of material solidification. The measurement was thereafter conducted in the heating step. This procedure was repeated in order to confirm its reproducibility.
The melt viscosity was determined by the calibration curve. Dimensions of the crucible and the inner cylinder were corrected by using thermal expansion coefficients of Fe (α = 11.7 × 10⁻⁶ K−1) and BN (α = −0.6 × 10⁻⁶ K−1). After the experiment, the inner cylinder was removed from sample melt and the salt slowly solidified in the furnace.
3. Results and Discussion
3.1. Uncertainty of Torque Measurement and Calibration Curves
Uncertainty of torque measurement was checked by using viscometer A (see Fig. 2) at room temperature (20°C). The inner cylinder was set at the geometric center (position x = y = 0 mm), and torque was measured by moving x from 0 to −0.6 and 0.6 mm. The torque applied to the inner cylinder is shown in Fig. 6 with respect to x. By analyzing the figure it is possible to notice that it has increased by bearing off the inner cylinder from center. By standardizing these values with the quantity at the geometric center, relative errors were calculated (13.5% for x =−0.6 mm and 9.7% for x =0.6 mm). To avoid major torque measurement errors, the position of inner cylinder was set within ±0.1 mm in x and y coordinates from the center, which corresponds to a maximum error in torque measurement of l.5% based on Fig. 6.

Theoretical lines as well as calibration curves for high and low viscosity liquids determined by silicone oils are shown in Figs. 7 and 8, respectively. Theoretical line was calculated from sample viscosity (η) and geometric dimensions of inner cylinder and crucible (r1, r2, h). By plugging in r1, r2, h to Eq. (4), theoretical apparatus constant K was determined. By assigning η to Eq. (4), an equation in which F was proportional to ω was obtained (viz. theoretical line). For any liquids, a unique line was obtained because F was divided by η.
On the other hand, calibration curve was obtained from torque measurements. For a liquid sample with η, F was measured by varying ω. An equation was determined by least square method from ω – F/η plots (viz. calibration curve). The slope of calibration curve corresponds to apparatus constant K. K shown in Figs. 7 and 8 are obtained from calibration curves.
A linearity pattern of measured values can be seen for both high and low viscosity, and good agreement with the theoretical values for all standard samples (from 10 to 4880 mPa·s) were obtained. Reasonable consistency of calibration curves by observing the scattering of measured values are proved (in particular, at 10 rad·s−1 (100 rpm), the scattering was smaller than ±1%). Apparatus constants for high and low viscosity calibration curves were 1.99×10⁻⁵ m3 and 6.12×10⁻⁴ m3, respectively.
3.2. Viscosity of LiF–NaF–KF Melt
Estimated (chain line) and measured viscosity of molten LiF–10 mol% NaF– 45 mol% KF (FLiNaK) are depicted in Fig. 9. Literature values13,14,15,16) are also shown. For a simple mixed system, it is known that additive law in logarithmic viscosity is established.17,18) Viscosities of LiF, NaF, and KF are described below.19)
|
LiF: Log (η/mPa⋅s)=-0.736+1.140×1 000/T
| (5) |
|
NaF: Log (η/mPa⋅s)=-0.865+1.327×1 000/T
| (6) |
|
KF: Log (η/mPa⋅s)=-0.971+1.242×1 000/T
| (7) |
where
T indicates absolute temperature (K). Viscosity of the mixed melt is, furthermore, described as follows.
|
Log (
η
M
/mPa⋅s)=
x
LiF
Log (
η
LiF
/mPa⋅s)
+
x
NaF
Log (
η
NaF
/mPa⋅s)+
x
KF
Log (
η
KF
/mPa⋅s)
| (8) |
where
xi indicates mol fraction of component
i. By inserting the mol fraction values of each component, the estimated equation for mixed melt turns to.
|
Log (
η
M
/mPa⋅s)=-0.855+1.205×1 000/T
| (9) |
Analyzing
Fig. 9, it is proven that measured viscosity showed the Arrhenius-type temperature dependence. The regression formula is as follows.
|
Log (η/mPa⋅s)=-0.623+0.968×1 000/T
| (10) |

Although the slopes of lines are slightly different due to data scattering in low viscosity region, good agreement between the curves can be seen. Literature values were higher than the present value. Detailed measurement methods in the previous study are not disclosed, but melt viscosity was measured by using a commercially available Brookfield viscometer.13) The measurement method of Brookfield is classified to rotating inner cylinder method5) which cannot determine several mPa·s of viscosity in general.3) In Brookfield viscometer, a torque given to an inner cylinder is measured by rotating the inner cylinder simultaneously. Since the rotational speed is decreased by viscous resistance, a compensating current is applied to a motor. The compensating current is utilized as a quantity proportional to torque. However, a large current is already applied for driving motor, which causes a large background current. For low viscosity measurement, a small signal superimposed on the large background current has to be detected. Therefore, the measured torque is significantly influenced by the background noise and overestimated for low viscosity liquid. It is considered that literature values were overevaluated due to inadequate measurement method. On the other hand, it is noteworthy that the improved viscometer can measure several mPa·s of viscosity.
3.3. Viscosity of SiO2–Na2O–NaF Melt
Figure 10 shows the viscosity of SiO2–Na2O–NaF melts (0 to 80 mol% NaF, basicity of 0.67). The measurement was carried out following a cooling process (1st process), heating process (2nd process), and a cooling process (3rd process). Results obtained in individual processes are not distinguished. Decrease in sample weight after the experiment was less than 0.9%, a lower value when compared to similar melt system, whose crucible and inner cylinder were made of graphite, which obtained a 2.4% decrease.10) The motive behind this reduction was because Na2O in the melt was reduced by the graphite material and the generated Na and CO evaporated. Since inert crucible and inner cylinder were used, reduction of Na2O was negligible. The slopes and the intercepts of the regression lines obtained when applying the least square method are shown in Table 3. The scattering of the plots is small in any composition, and the viscosity showed a good Arrhenius-type linearity. It is noteworthy that viscosity ranging from several to 104 mPa·s of a wide composition range melt could be determined.

Figure 11 represents the viscosity of SiO2–Na2O–NaF melts at 1473 K calculated from the regression lines as well as Literature values10,19,20,21) versus mol% NaF. The viscosity of NaF was determined by using oscillating crucible method.19) The viscosity determined in the present study monotonically decreased by increasing NaF concentration. The quadric curves shown by Eq. (11) fit all plots shown in the figure.
|
Log (η/mPa⋅s)=3.761-6.27×
10
-2
C
NaF
+2.59×
10
-4
C
NaF
2
(Basicity: 0.67)
| (11) |
This composition dependence is similar to that for SiO
2–CaO–CaF
2 melts.
9)
Figure 12 shows the activation energy of viscous flow of SiO2–Na2O–NaF melts as well as ionic ratio between F− and Si4+ ions, (CF−/CSi4+), on right axis. The activation energy significantly decreased by increasing NaF concentration in 5 mol% NaF at first; that then gradually decreased with further addition of NaF. The activation energy drastically decreased in 80 mol% NaF which is close to the composition at CF−/CSi4+= 6 (78.25 mol% NaF). These results imply that the activation process on viscous flow changes depending on F− concentration.
Sasaki et al. analyzed SiO2–Na2O–NaF glasses by using Raman spectroscopy and molecular dynamic simulation and reported that, in low NaF concentration region, F− coordinated the Na+ but not Si ion, since Si ion is surrounded by oxide ion.22) Namely, F− does not modify the silicate network and acts as a diluter. In Fig. 12, therefore, the 1st decrease in activation energy would reflect the melt structure change.
Ueda et al. analyzed molten SiO2–CaO–CaF2 by applying a hot-filament technique with infrared spectroscopy and indicated that F− is coordinated to Si4+ in high F− concentration composition,23) in which oxyfluoride ion, such as SiOxFyz−, was considered. This complex anion has a large volume but small charge, which results in a small charge density and leads to a decrease in cohesive melt’s force.3) On reflection, the formation of oxyfluoride ion means that network structure of silicate is critically cut off. It is considered, therefore, that the 2nd decrease in activation energy represented on Fig. 12 is related to the disappearance of silicate network structure in the melt.
4. Conclusions
The centers of inner cylinder and crucible were matched within the accuracy of ± 0.1 mm by adopting X-Y stage in the improved rotating crucible viscometer. As a result, a relative error less than 1.5% in torque measurement was obtained. Calibration curves had a good consistency in a wide of viscosity ranges. For the first tested molten LiF–10 mol% NaF– 45 mol% KF, viscosity agreed with estimated values from pure substances. As for the SiO2–Na2O–NaF system (CNa2O/CSiO2 = 0.67 in mol%) at 0 to 80 mol% NaF, viscosity behavior was described by Arrhenius-type temperature dependence. Composition dependence of viscosity at 1473 K could also be modeled and drastic decreases in activation energy for viscous flow were observed at concentrations of 5 and 80 mol% NaF.
Acknowledgement
The authors are grateful to Associate Prof. Souhei Sukenaga of Tohoku University, Associate Prof. Noritaka Saito and Prof. Kunihiko Nakashima of Kyushu University for their valuable comments throughout this project. This work was financially supported by the Grant for fundamental research from the Advanced Research and Education Center for Steel (ARECS) of Tohoku University.
References
- 1) K. Asano: Bull. Jpn. Inst. Met., 19 (1980), 724 (in Japanese).
- 2) K. Ogino: Bull. Jpn. Inst. Met., 18 (1979), 684 (in Japanese).
- 3) O. Takeda, Y. Hoshino, Y. Anbo, K. Yanagase, M. Aono and Y. Sato: Int. J. Thermophys., 36 (2015), 648.
- 4) A. Adachi, Z. Morita and Y. Matsumura: Handbook on Physical Properties of Molten Iron and Molten Slag, ed. by The Iron and Steel Institute of Japan, ISIJ, Tokyo, (1972), 32 (in Japanese).
- 5) K. C. Mills: Slag Atlas, 2nd ed., ed. by Verein Deutsher Eisenhuttenleute, Verlag Stahleisen GmbH, Dusseldorf, (1995), 350.
- 6) Y. Shiraishi, S. Nagasaki and M. Yamashiro: J. Jpn. Inst. Met., 60 (1996), 184 (in Japanese).
- 7) Y. Shiraishi, S. Nagasaki and M. Yamashiro: ISIJ Int., 37 (1997), 383.
- 8) I. Barin: Thermochemical Data of Pure Substances, VCH Verlagsgesellschaft mbH, Weinheim, (1989), 293, 304, 976, 984.
- 9) O. Takeda, T. Okawara and Y. Sato: ISIJ Int., 52 (2012), 1544.
- 10) O. Takeda, T. Ohnishi and Y. Sato: ISIJ Int., 54 (2014), 2045.
- 11) G. I. Taylor: Philos. Trans. R. Soc. A, 223 (1923), 289.
- 12) J. M. Sangster and A. D. Pelton: Special Report to the Phase Equilibria Program, Part D: The 60 Ternary Common-ion Systems Involving (Li, Na, K, Rb, Cs) and (F, Cl, Br, I), American Ceramic Society, Westerville, OH, (1987), 2.
- 13) H. W. Hoffman and J. Lones: Fused Salt Heat Transfer Part II: Forced Convection Heat Transfer in Circular Tubes Containing NaF-KF-LiF Eutectic, Oak Ridge National Laboratory Report ORNL-1977, Oak Ridge National Laboratory, Oak Ridge, TN, (1955), 1.
- 14) I. B. Vriesema: Aspects of Molten Fluorides as Heat Transfer Agents for Power Generation, The Netherlands Report WTHD No. 112, Delft University of Technology, Delft, (1979).
- 15) J. Ambrosek, M. Anderson, K. Sridharan and T. Allen: Nucl. Technol., 165 (2009), 166.
- 16) G. J. Janz and R. P. T. Tomkins: Physical Properties Data Compilations Relevant to Energy Storage: IV Molten Salts: Data on Additional Single and Multi-Component Salt Systems, National Standard Reference Data System, National Bureau of Standards Report NSRDS-NBS 61 Part IV, U.S. Government Printing Office, Washington D.C., (1981), 192.
- 17) Y. Sato, T. Yamazaki, H. Kato, H. Zhu, M. Hoshi and T. Yamamura: Netsu Bussei, 13 (1999), 162.
- 18) Y. Sato, K. Sugisawa, D. Aoki and T. Yamamura: Meas. Sci. Technol., 16 (2005), 363.
- 19) T. Ejima, Y. Sato, S. Yaegashi, T. Kijima, E. Takeuchi and K. Tamai: J. Jpn. Inst. Met., 51 (1987), 328 (in Japanese).
- 20) M. Kawahara, K. Morinaga and T. Yanagase: J. Jpn. Inst. Met., 41 (1977), 1047 (in Japanese).
- 21) D. R. Neuville: Chem. Geol., 229 (2006), 28.
- 22) Y. Sasaki, H. Urata and K. Ishii: ISIJ Int., 43 (2003), 1897.
- 23) S. Ueda, H. Koyo, T. Ikeda, Y. Kariya and M. Maeda: ISIJ Int., 40 (2000), 739.