Abstract
Coke oven gas (COG) injection is believed to improve the quality and yield of sinter in iron ore sintering process. A mathematical model is developed to simulate the sintering process with COG injection, particularly focusing on predicting the quality and yield of sinter. The model is validated by comparing the model predictions with sintering pot test data. Numerical simulations are carried out to investigate the influences of location, quantity and covering area of COG injection on the sintering process. The results show that the location of COG injection has a little influence on its effectiveness on sintering, with that the sinter yield decreases slightly with the delay of COG injection while the mean melt quantity index (MQI) and cooling rate (CR) hardly change. The quantity of COG injection has a great influence on sintering. With a typical COG injection area of 40% and injection location of 60 s after ignition, the sinter yield increases by 33.3%, the mean MQI increases by 9.5% and the mean CR decreases by 37.6% when COG injection is 0.5%. The injection area of COG has some interesting influence on its effectiveness on sintering. Under the condition of 0.5% COG injection from 60 s after ignition, with the increase of injection area, the sinter yield increases prominently first and then decrease significantly, attaining its maximum at 40% of injection area. At the same time, the mean MQI and CR attain their extrema also at 40% of injection area.
1. Introduction
In integrated iron and steel enterprises, the energy consumption of iron making process accounts for about 70% of the total energy consumption, among which the energy consumption of sintering process accounts for about 10%–20% of the total energy consumption of the whole enterprise, which is the second large energy consumption process next to blast furnace.1) At the same time, pollutants such as CO2, SO2 and NOx produced by sintering process has become more and more serious to the environment with the expansion of steel industry. Therefore, reducing solid fuel consumption and reducing emissions of pollutants such as CO2, SO2 and NOx have become an urgent task for steel enterprises.
In previous studies, many attempts have been made to increase sintering production without increasing solid fuel consumption. The hydrogen-enriched gaseous fuel injection technology was developed and applied successfully to sintering machine at Keihin No.1 sinter plant in JFE Steel Corporation. The technology enables to produce high strength sinter without increasing coke ratio by changing the heating/cooling rate in the sintering process.2) Guilherme3) studied the influence of coke oven gas (COG) injection on sintering through numerical simulation. The calculation results showed that, with the injection of COG, the coke consumption decreased and the combustion front speed increased, the content of calcium ferrite in the sinter increased, the sinter reducibility was improved, and the CO2 emission in the flue gas was reduced. Meishan Iron and Steel Cooperation carried out industrial test of COG injection based on heat compensation.4,5) The results showed that COG injection can increase the content of calcium ferrite in sinter and improve the quality of sinter, and it has also a positive effect for energy saving. Cheng6,7,8) studied the substitution of coke fines with charcoal combined with gas fuel injection under laboratory conditions, and the study showed that under the proper proportion of charcoal and gas fuel, the temperature field of the sinter layer can be optimized without reducing the productivity of the sintering, so as to improve the product quality.
Looking at the previous researches, it is found that they focus mainly on gas fuel injection experiments and the effects of energy saving and emission reduction with gaseous fuel injection, while the process mechanism and influence of injection parameters have not been studied in detail, particularly for product quality and production yield. Therefore, in the present work, based on the sintering mechanism with COG injection, numerical simulations are carried out to investigate the influences of COG injection operation parameters, including injection location, quantity and covering area, on the quality and yield of sintering production.
2. Mathematical Model
A schematic view for COG injection in iron ore sintering process is shown in Fig. 1. Low concentration COG (less than 10% of the lean flammable limit) is blown onto the surface and then pumped into the sintering bed with air under the negative pressure of the sintering machine. When the COG reaches the high temperature zone above the combustion layer, the combustion reaction occurs, which can provide a new high temperature zone, slow down the sinter cooling speed, extend the holding time of sinter at high temperature zone, and therefore improves the sintering process.2) The corresponding reduction in the proportion of solid fuel will reduce the maximum temperature in the high temperature zone generated by solid fuel combustion, which is also conducive to improving the reducibility of sinter and reducing the environmental pollution.4)
2.1. Conservation Equations
The model consists of the conservation equations of mass, momentum, heat and chemical species for gas and solid phases, and the rate equations of reactions and phase changes.
2.1.1. Equations for the Gas Phase
(1) Continuity
|
∂(
ε
ρ
g
)
∂τ
+
∂
∂
x
j
(
ε
ρ
g
U
i,g
)
=
S
s
+
S
g
| (1) |
(2) Momentum conservation
|
∂(
ε
ρ
g
U
i,g
)
∂τ
+
∂
∂
x
j
(
ε
ρ
g
U
i,g
U
j,g
)
=
∂
∂
x
j
(
μ
g
∂
U
i,g
∂
x
j
)
-
∂P
∂
x
j
-
F
j
| (2) |
where
Fj is calculated with the following Ergun-Blake-Kozeny equation.
9,10)
|
F
j
=
150
μ
g
(
1-ε
)
2
d
p
2
ε
3
U
i,g
+
1.75
ρ
g
(
1-ε
)
d
p
ε
3
U
i,g
U
j,g
| (3) |
(3) Heat conservation
|
∂(
ε
ρ
g
C
p,g
T
g
)
∂τ
+
∂
∂
x
j
(
ε
ρ
g
C
p,g
U
i,g
T
g
)
=
∂
∂
x
j
(
k
g,eff
∂
T
g
∂
x
j
)
+
Q
g
+
Q
conv
+
H
s
+
Q
s,g
| (4) |
(4) Chemical species conservation
|
∂(
ε
ρ
g
Y
i,g
)
∂τ
+
∂
∂
x
j
(
ε
ρ
g
U
i,g
Y
i,g
)
=
∂
∂
x
j
(
ρ
g
D
i,m
∂
Y
i,g
∂
x
j
)
+
M
i,g
+
M
i,s
| (5) |
(1) Continuity
|
∂(
1-ε
)
ρ
s
∂τ
=-
S
s
| (6) |
(2) Heat conservation
|
∂(
(
1-ε
)
ρ
s
C
p,s
T
s
)
∂τ
=
∂
∂
x
j
(
k
s,eff
∂
T
s
∂
x
j
)
-
Q
conv
+
Q
s,ms
-
H
s
+
Q
s,s
| (7) |
(3) Chemical species
|
∂(
(
1-ε
)
ρ
s
Y
i,s
)
∂τ
=
M
i,s
| (8) |
Sub-models, such as gas-solid chemical reaction rate models, gas homogeneous combustion reaction rate models, NOx reduction/formation models, gas-solid heat transfer model, melting and solidification models and sintering bed structure change model were presented in our previous work.11) The gas-solid reactions include coke combustion,12,13,14,15,16,17) limestone decomposition,18,19) dolomite decomposition,20) hematite reduction and magnetite oxidation.21) To characterize the NOx behavior, four main NO formation/reduction mechanisms,22) i.e., the fuel NO originating from coke particles, thermal NO formation, NO reductions by coke particles and CO are considered.11) The gas homogeneous combustion reactions,21) particularly considering COG combustion, include the reactions of hydrogen, methane and carbon monoxide with oxygen, as shown in Eqs. (9), (10), (11).
|
H
2
+0.5
O
2
=
H
2
O
| (Reaction 1) |
|
R
H
2
=1
0
11
C
H
2
C
O
2
exp(
-4.19857×1
0
5
/R
T
g
)
| (9) |
|
CH
4
+0.5
O
2
=CO+2
H
2
O
| (Reaction 2) |
|
R
C
H
4
=9.2×1
0
6
C
O
2
C
C
H
4
0.5
exp(
-7.99973×1
0
5
/R
T
g
)
| (10) |
|
2CO+
O
2
=2
CO
2
| (Reaction 3) |
|
R
CO
=1.3×
10
8
C
CO
C
O
2
0.5
C
H
2
O
0.5
exp(-1.8169×
10
3
/R
T
g
)
| (11) |
The conservation equations of mass, energy, momentum and species for gas and solid phases were solved by FLUENT software combined with user-defined function (UDF). Variations of mass, energy, flow resistance and species were defined as the respective source terms of conservation equations. The setting of initial condition and boundary condition were realized by macros of FLUENT software. The SIMPLE algorithm was used to solve the conservation equations. All transient terms in the differential equations were discretized by the second-order windward scheme. The numerical convergence was accepted when the error is 10−6 for energy equation and 10−3 for other equations.
2.3.2. Boundary and Initial Conditions
The system of differential equations presented by Eqs. (1), (2), (3), (4), (5), (6), (7), (8) are completed with their initial and boundary conditions listed in Table 1. Ignition was realized by hot coke oven gas combustion flue gas with velocity of 4.0 m/s and temperature of 1400 K from the ignition burner, and the duration of ignition is 90 s. Then air was sucked into the sintering bed layer with the average velocity of 0.43 m/s. The gas inlet and outlet flow rates are determined by the negative pressure specified to wind box, which is determined by the blower.
Table 1. Boundary and initial conditions.
| Parameters | Value | Parameters | Value |
|---|
| Ignition time (s) | 90 | Ignition temperature (K) | 1400 |
| Gas inlet velocity during ignition (m/s) | 4 | Initial bed voidage | 0.4 |
| Gas inlet velocity after ignition (m/s) | 0.43 | Average particle diameter (m) | 0.0030 |
| Negative pressure during ignition (Pa) | −10000 | Coke fines diameter (m) | 0.0016 |
| Negative pressure after ignition (Pa) | −15000 | Limestone diameter (m) | 0.0016 |
| Initial temperature of solid (K) | 300 | Dolomite diameter (m) | 0.0016 |
| Initial temperature of gas (K) | 300 | Iron ore diameter (m) | 0.0032 |
In addition, the heat losses through the sinter pot wall occur at the gas-wall and solid-wall interfaces, through the wall and at the outer surface of sinter pot, which involve heat convection and conduction.23) Heat loss fluxes for the gas and solid phases in sinter pot, Qg-w and Qs-w, are calculated by Eqs. (12) and (13) respectively.
|
Q
g-w
=
T
air
-
T
g
1/
h
g-w
+
δ
w
/
λ
w
+1/
h
air
| (12) |
|
Q
s-w
=
T
air
-
T
s
1/
h
s-w
+
δ
w
/
λ
w
+1/
h
air
| (13) |
3. Model Validation
Won Yang’s experimental data24) were used to validate the mathematical model. Figure 2 shows the schematic illustration of sintering pot, which has a height of 600 mm and an inner diameter of 205 mm. Three R-type thermocouples are inserted along the y-direction of the sintering bed at y=490 mm (the upper layer), y=300 mm (the mid-layer) and y=110 mm (the bottom layer), respectively. In order to improve the permeability of the bed and avoid the damage of the grate at high temperature, a hearth layer of 30 mm thick was placed at the bottom of the bed. The negative pressure of the suction fan is set to −10 kPa during the period of ignition and −15 kPa after ignition. The air inlet velocity, air flow rates, and composition flue gas including O2, CO2, CO, and NOx are measured continuously.

The parameters of the Base case used in the simulation and sinter pot test are listed in Table 1. Table 2 shows the proportions and chemical composition of iron ore and fluxes. The comparison between the simulated and measured bed temperatures and flue gas composition for base case, along with other fixed operating parameters, are shown in Fig. 3. The results show that the simulation results are in good agreement with the experimental data, and the error analysis of the simulation results was presented in a previous study.11)
Table 2. Compositions of sintering mixture (mass%).
| Raw material | Proportion | Chemical composition |
|---|
| TFe | SiO2 | CaO | MgO | Al2O3 | LOI |
|---|
| Iron ore | 83.20 | 61.00 | 4.25 | 0.46 | 0.19 | 1.48 | 1.88 |
| Limestone | 6.60 | 0 | 2.30 | 52.49 | 0.65 | 1.07 | 42.94 |
| Dolomite | 4.07 | 0 | 1.86 | 30.93 | 20.45 | 0.32 | 44.05 |
| Quicklime | 2.34 | 0 | 0 | 87.14 | 0.20 | 0 | 12.36 |
| Coke | 3.80 | 0.60 | 6.27 | 0.52 | 0.11 | 3.84 | 87.99 |
4. Interpretation of Simulation Results
4.1. Temperature Profile and Melt Fraction
Figure 4 shows the temperature distribution in the bed (Base case). After ignition, the coke burns continuously. With the progress of coke combustion, the thickness and maximum temperature of the combustion zone increase gradually. The reason is that the temperature of the air entering the combustion zone increases with the increase of convection heat transfer from solid particles, and the coke combustion rate also increases with the increase of solid temperature. Many studies have shown that the solid temperature distribution has a significant influence on the sinter strength and production yield,25,26,27) so it is of great significance to analyze the characteristics of the temperature profile quantitatively.

The melt fraction fm of the bed reveals the amount of the liquid phase, which is determined by the solid temperature distribution of the bed and calculated with Eq. (14). The distribution of melt fraction fm is shown in Fig. 5. It can be seen from the figure that, with the sintering process progresses, the melt fraction fm increases gradually, and the maximum melt fraction appears in the bottom layer of the sintering bed.
|
f
m
={
1,
T
s
>
T
m2
(
T
s
-
T
m1
)
/(
T
m2
-
T
m1
)
,
T
m1
≤
T
s
≤
T
m2
0,
T
s
<
T
m1
| (14) |
where
Tm1 and
Tm2 are the solidus and liquidus temperatures of melting phase respectively.

Figure 6 shows the evolution of solid temperature with time at bed height of y = 0.30 m, where t1, t2 and tmax are the times when the solid raw material starts melting, solidifies completely and attains the maximum temperature (Tmax) respectively. The horizontal dotted line is the melting start point of Tm1=1373 K, which is the solidus temperature of the raw material. Tm1 and Tm2 are derived from the CaO–Fe2O3 phase diagram.21) Some important indexes can be derived from the figure. The maximum temperature (Tmax) is 1564 K. The residence time of melt zone (the lasting time above solidus temperature) t is 154 s. The cooling time is the time interval between the maximum temperature and the solidus temperature for temperature declining. The melt quantity index (MQI) defined by Eq. (15) can be obtained from the temperature profile and will be used to represent sinter strength later. The cooling rate (CR), which is defined by Eq. (16) and used later to characterize the FeO content in sinter product, can also be obtained from the temperature profile.
|
MQI=
∫
t
1
t
2
(
T
s
-
T
m1
)
dt
| (15) |
|
CR=
T
max
-
T
m1
t
2
-
t
max
| (16) |
A few criterions (e.g. residence time, enclosed area and melt fraction) have been used to estimate the yield of sinter in literature. Cheng6) et al. verified the relationship between sinter yield and enclosed area of temperature profile through sinter pot experiment, indicating that the sinter yield increases with the increase of the enclosed area. The thickness of sinter layer was only 400 mm in their experiment, and thus the effect of over melting on sinter yield was not obvious. Generally, with the increase of sinter layer thickness, the over-melting degree of sinter mixture increases especially at the bottom layer of sinter bed, which will also lead to the decrease of sinter reducibility. Therefore, it is not accurate enough to estimate the sinter yield by the closed area, especially for thick bed sintering. Sinter product is formed by melting the sinter mixture partially, and the melting fraction of sinter mixture determines its quality. Nath25) showed that the sinter quality is best when the melt fraction reaches 0.3. In addition, Zhang28) proposed that the sinter mixture was under-melted when melt fraction was less than 0.2, and over-melted when melt fraction was more than 0.4. Therefore, the sinter with melt fraction between 0.2 and 0.4 was taken as qualified product. This evaluation methodology is considered in the present study.
Figure 7 shows the distribution of melt fraction along the vertical direction of bed for the Base case. It can be seen from the figure that the under-melted sinter is located mainly at the upper layer, and the over-melted sinter is lied at the lower layer of the bed. Taking the bed with melt fraction of 0.20–0.42 as qualified sinter, the calculated sinter yield is 60.0%. In the sintering pot test with the same coke content,26) the sinter yield is 62.0%. The calculated sinter yield is in fairly good agreement with the measured result, and thus the sinter with melt fraction of 0.20–0.42 is taken as qualified product in the present work.
4.3. Melt Quantity vs Sinter Strength and Cooling Rate vs Sinter FeO
Loo29) and Zhang30) studied the relationship between the enclosed area of temperature profile and sinter strength through a series of sintering pot test, showing that the enclosed area is proportional to the sinter strength. In present work, the relationship between MQI and sinter strength is verified by the experimental data from Zhang.30)
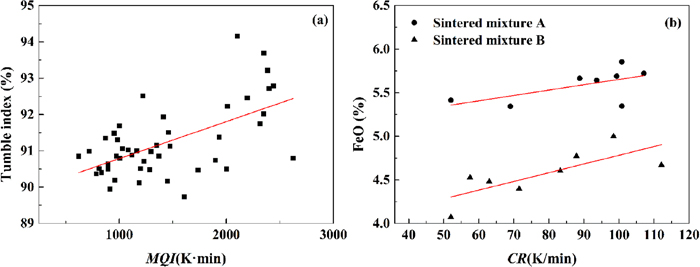
Based on the solid temperature evolution with time at the bed heights of 0.11 m, 0.20 m, 0.30 m, 0.40 m and 0.49 m, the MQI and CR are calculated and shown in Fig. 8. As can be seen from the figure, MQI increases with the decrease of bed height. Since the MQI reflects the heat accumulated in the sinter mixture, lower MQI will lead to faster temperature dropping, and thus resulting in that CR decreases with the decrease of bed height. Therefore, CR is approximately inversely proportional to MQI. The relationship between MQI and sinter strength is shown in Fig. 9(a). It can be seen that the tumbling index is proportional to MQI. The relationship of CR and the FeO content in sinter is shown in Fig. 9(b). It can be observed that FeO increases with the increase of CR. This is because that high CR leads to less FeO oxidation and more residual FeO in the final product.30) Consequently, both CR and MQI are often used together to represent sinter quality.
5. Discussion
Table 3 shows the chemical composition and heat value of COG. The element and proximate analyses of coke are listed in Table 4. Table 5 shows the location, quantity and area of COG injection, as well as the coke ratio of the simulation cases. Some previous papers2,4) shows that the COG burns before arriving at the sintering bed when the COG concentration exceeds the lean flammable limit (4.8 vol.%). Therefore, the COG concentration should be lower than the lean flammable limit. Furthermore, considering that the improvement by COG addition reaches saturation when its concentration is 10% higher than the lean flammable limit, the COG concentration is set as 0.5 vol.% of the suction air, and the initial location of COG injection is set from 60 s after ignition.2,31) The coke ratio is set as 3.8 mass% of the total sintering mixture for the Base case. The equivalent heat method was used for solid fuel substitution by COG,32) i.e. replacing the heat of solid fuel by COG of the same heat.
Table 3. Chemical composition of coke oven gas.
| Compositions | CO2 | CO | H2 | CH4 | C2H2 | C2H6 | C3H8 | O2 | N2 | Heating value/(kJ/Nm3) |
|---|
| COG | 2.4 | 6.4 | 58.2 | 25.2 | 2.8 | 0 | 0 | 0.5 | 4.2 | 18135.4 |
Table 4. Element and proximate analysis of coke fines.
| Elemental analysis (%) | Proximate analysis (%, dry base) |
|---|
| C | H | O | N | S | Volatile | Fixed carbon | Ash | Heating value (kJ/kg) |
|---|
| Coke | 86.04 | 1.34 | 10.85 | 1.55 | 0.21 | 2.99 | 81.69 | 15.32 | 25993.72 |
Table 5. Operational parameters for simulation cases.
| Case No. | Injection location (s) | Injection ratio (vol.%) | Injection area ratio (%) | Coke fines (mass%) |
|---|
| Base case | – | 0 | 0 | 3.80 |
| Case 1 | 60 | 0.3 | 40 | 3.73 |
| Case 2 | 120 | 0.3 | 40 | 3.73 |
| Case 3 | 180 | 0.3 | 40 | 3.73 |
| Case 4 | 60 | 0.4 | 40 | 3.70 |
| Case 5 | 60 | 0.5 | 20 | 3.74 |
| Case 6 | 60 | 0.5 | 40 | 3.68 |
| Case 7 | 60 | 0.5 | 60 | 3.62 |
| Case 8 | 60 | 0.5 | 80 | 3.56 |
Figure 10 shows the influence of COG injection on the thermal map of sintering bed. The left figure shows the combustion positions of COG and coke, and the right one shows the expansion of the high temperature zone. Compared with conventional sintering without COG injection, the injected COG burns in the upper part above the coke combustion position. In this way, the cooling caused by convection heat transfer between the suction air and the raw material layer is inhibited, and the temperature zone favorable for sintering reaction is enlarged particularly upward.
5.2. Influence of COG Injection Location
The synchronous moving of flame front and heat transfer front in sintering bed is beneficial to sintering and thus strongly desirable. The influences of COG injection location on the moving speeds of flame front and heat front are shown in Fig. 11. The moving speeds of flame front and heat front are defined as follows.24)
|
Moving speed of flame front=
Distance between point A and B at 973 K (mm)
Time consumed for propagation (min)
| (17) |
|
Moving speed of heat front=
Distance between point C and D at 373 K (mm)
Time consumed for propagation (min)
| (18) |
where points A and B represent the locations of
y=0.49 and 0.11 m, respectively, 973 K denotes the frontier temperature of combustion; and points C and D represent the locations of
y=0.49 and 0.11 m, respectively, 373 K denotes the frontier temperature of heat transfer.
It can be seen from Fig. 11, compared with no COG injection (Base case), the moving of both flame front and heat front slows down with COG injection and the difference between the two speeds is decreased. With the delay of COG injection location from 60 s to 180 s, the difference between the flame front speed and the heat front speed increases. Therefore, COG injection from 60 s after ignition is the best for the consistence between flame and heat fronts.
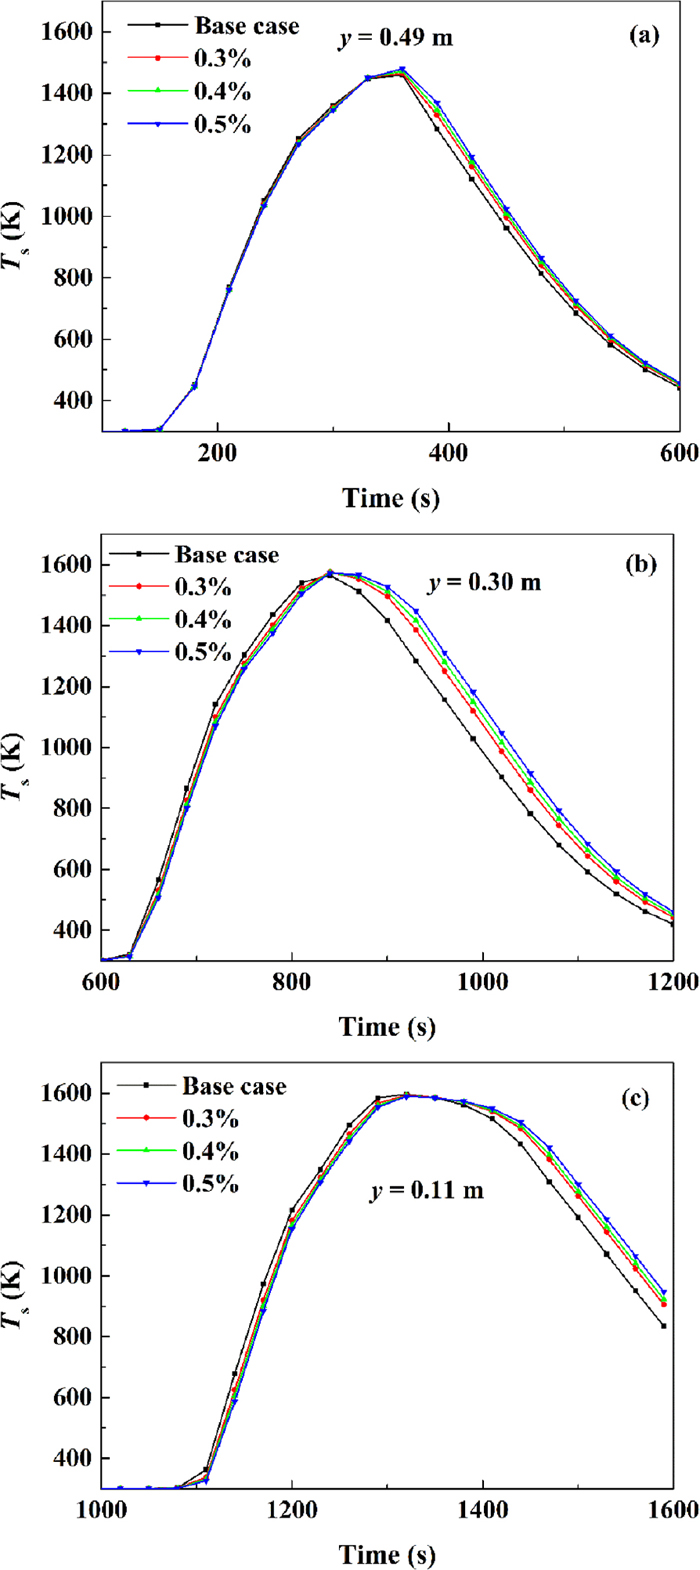
The influence of COG injection location on solid phase temperature evolution at different bed heights is shown in Fig. 12. It can be seen that the maximum temperature of solid materials increases gradually with the decrease of layer height. Compared with the Base case without COG injection, the maximum temperatures of upper layer and mid-layer increase gradually, and that of the bottom layer tends to decrease with COG injection. The melting zone residence times of upper, middle and bottom layer are all extended. With the delay of COG injection, the maximum temperature of upper layer decreases gradually, while those of the middle and bottom layers have little change. The delay of COG injection has little influence on the melting zone residence times of all layers. The temperature profiles are analyzed in more detail next as shown in Table 6.

Table 6. Characteristic parameters from temperature profiles with different COG injection locations.
| Case NO. | Injection location/s | Tmax/K | t/s |
|---|
| y=0.49 m | y=0.30 m | y=0.11 m | y=0.49 m | y=0.30 m | y=0.11 m |
|---|
| Base case | – | 1447 | 1565 | 1597 | 69 | 144 | 220 |
| Case 1 | 60 | 1465 | 1575 | 1593 | 74 | 160 | 232 |
| Case 2 | 120 | 1459 | 1575 | 1593 | 73 | 163 | 233 |
| Case 3 | 180 | 1450 | 1574 | 1594 | 70 | 167 | 234 |
The maximum temperatures of upper, middle and bottom in the Base case are 1447 K, 1565 K and 1579 K respectively. When COG injection is from 60 s after ignition, the maximum temperatures of upper and middle layers are increased by 18 K and 10 K respectively, and that of the lower is decreased by 5 K, indicating that the temperature of the sintering bed gets more uniform. This is simply because of the additional combustion zone of COG just above that of coke combustion. With the delay of COG injection, the maximum temperature decreases in the upper layer, while those of the middle and lower layers have little change. This is due to the fact that the heat contribution of COG combustion to the material layer moves down with the delay of COG injection.
The melting zone residence times of upper, middle and lower layers in the Base case are 69 s, 144 s and 220 s respectively. When COG injection is from 60 s after ignition, the melting zone residence times of the upper, middle and lower layers are increased by 5 s, 16 s and 12 s respectively. With the delay of COG injection, the melting zone residence time of upper layer was gradually shortened, and those of middle and bottom layers were still gradually increased. This is also because of the moving down of COG combustion. It can be seen that the closer the COG injection position to the ignition furnace is, the higher is the maximum temperature of the upper layer and the longer is the residence time of the melting zone, so that the sintering reaction will be more completed, more calcium ferrite will be formed, and thus the sinter quality will be improved.
The melt fraction profiles along bed height for different COG injection locations are shown in Fig. 13, and the data of characteristic parameters derived from the figure are listed in Table 7. As can be seen from the figure, COG injection, as well as the injection location, have some influence on the melting behavior in the sintering bed. Owing to the significant decrease of over-melted bed material as shown in the Table 7, the final production yield is increased from 60% to about 75.7% with COG injection. The location of COG injection has little influence on the production yield.
Table 7. Analysis of melt fraction under different COG injection locations.
| Case NO. | Injection location/s | fmax | fave | Under-melted sinter/% | Over-melted sinter/% | Yield/% |
|---|
| Base case | – | 0.429 | 0.282 | 26.7 | 13.3 | 60.0 |
| Case 1 | 60 | 0.415 | 0.290 | 24.3 | 0 | 75.7 |
| Case 2 | 120 | 0.415 | 0.288 | 24.8 | 0 | 75.2 |
| Case 3 | 180 | 0.415 | 0.285 | 25.5 | 0 | 74.5 |
Table 8 shows the MQI and CR profiles along bed height for various cases. As can be seen in Table 8, MQI increases with the decrease of bed height. In the Base case, MQI of the upper, middle and lower layers are 1635.9, 3997.1 and 5602.2 K·min respectively. When COG injection location is from 60 s after ignition, MQI of the upper, middle and lower layers are increased by 8.0%, 1.7% and 5.3%, respectively, leading to 3.9% increase of the mean MQI, indicating that the sinter strength will increase and return fines will decrease with COG injection. The reason is that, with the delay of COG injection, the melt heat of the upper layer decreases and those of middle and lower layers increase due to the moving down of COG combustion. The variation of COG injection location has only a little influence on melt quantity in the sintering bed.
Table 8.
MQI and
CR profiles for various COG injection locations.
| Case NO. | Injection location/s | MQI/(K·min) | CR/(K/min) |
|---|
| y=0.49 m | y=0.30 m | y=0.11 m | MQIave | y=0.49 m | y=0.30 m | y=0.11 m | CRave |
|---|
| Base case | –– | 1635.9 | 3997.1 | 5602.2 | 3745.0 | 402.0 | 164.4 | 99.6 | 222.0 |
| Case 1 | 60 | 1766.3 | 4000.9 | 5900.9 | 3889.3 | 271.8 | 125.4 | 85.8 | 161.0 |
| Case 2 | 120 | 1742.6 | 4049.8 | 5934.7 | 3909.1 | 276.0 | 130.2 | 87.0 | 164.4 |
| Case 3 | 180 | 1664.2 | 4181.6 | 5958.1 | 3934.6 | 288.6 | 120.6 | 86.4 | 165.2 |
CR decreases with the decrease of bed height. In the Base case, CR of the upper, middle and lower layers are 402.0, 164.4 and 99.6 K/min respectively. When COG injection is from 60 s after ignition, CR of the upper, middle and lower layer are decreased greatly by 32.4%, 23.7% and 13.9% respectively, leading to 27.5% decrease of the mean CR, indicating that the FeO content of sinter product will be lowered and thus its reducibility will be improved greatly. The variation of COG injection location has only a little influence on the cooling behavior in the sintering bed.
5.3. Influence of COG Injection Quantity
The effect of COG injection quantity on the moving speeds of flame front and heat front is shown in Fig. 14, where the COG injection area is 40% and the location is from 60 s after ignition. With increase of COG injection quantity, the moving speed of flame front decrease significantly while that of heat front speed decrease slightly, making the gap between the two front speed narrower ant thus the two fronts more consistent. 0.5% COG injection quantity results in the best consistency among the cases of the present work.
Figure 15 shows the effect of COG injection ratio on solid phase temperature evolution at different bed heights, and the data of characteristic parameters derived from the figure are listed in Table 9. As can be seen from the figure, COG injection ratio has some influence on the temperature evolution in the sintering bed, especially in the cooling period where the bed temperature increases clearly with increasing the quantity of COG injection.
Table 9. Characteristic parameters from temperature profiles of different COG injection ratios.
| Case NO. | Injection ratio/% | Tmax/K | t/s |
|---|
| y=0.49 m | y=0.30 m | y=0.11 m | y=0.49 m | y=0.30 m | y=0.11 m |
|---|
| Base case | 0 | 1447 | 1565 | 1597 | 69 | 144 | 220 |
| Case 1 | 0.3 | 1465 | 1575 | 1593 | 74 | 160 | 232 |
| Case 4 | 0.4 | 1471 | 1575 | 1591 | 76 | 164 | 233 |
| Case 6 | 0.5 | 1480 | 1573 | 1590 | 80 | 167 | 237 |
Table 9 shows that the maximum temperatures of upper, middle and lower layers are 1447 K, 1565 K and 1579 K respectively in the Base case of no COG injection. With the increase of COG injection, the maximum temperature of the upper layer increases monotonically, that of the middle layer increases first and then decreases, and that of the lower layer decreases monotonically, indicating that the bed temperature gets more uniform with the increase of COG injection. With 0.5% of COG injection, the maximum temperatures of upper and middle layers are increased by 33 K and 8 K respectively, while that of the lower layer is decreased by 7 K. The melting zone residence time of upper, middle and lower layers in Base case are 69 s, 144 s and 220 s respectively. With the increase of COG injection, the melting zone residence time of upper, middle and lower layers are all extended. With 0.5% COG injection, the melting zone residence time of upper, middle and lower layers are increased by 11 s, 23 s and 17 s respectively. This is simply because that the additional COG combustion just above the coke combustion extended the high temperature zone. The melting zone residence time is consequently prolonged, indicating that the sintering reaction will be more completed, more calcium ferrite will be formed, and thus the sinter quality will be improved.
The melt fraction profiles of the sinter bed for different COG injection ratios are shown in Fig. 16, and the characteristic parameters derived from the figure are listed in Table 10. As can be seen from the figure, the melt fraction increases considerably with increasing COG injection ratio during the period of COG injection (upper section of the bed), simply due to the heat supply by COG combustion. In turn, the melt fraction decreases during the period of no COG injection (lower section of the bed) due to the reduction of solid fuel addition.
Table 10. Analysis of melt fractions under different COG injection ratios.
| Case NO. | Injection ratio/% | fmax | fave | Under-melted sinter/% | Over-melted sinter/% | Yield/% |
|---|
| Base case | 0 | 0.429 | 0.282 | 26.7 | 13.3 | 60.0 |
| Case 1 | 0.3 | 0.415 | 0.290 | 24.3 | 0 | 75.7 |
| Case 4 | 0.4 | 0.411 | 0.291 | 23.0 | 0 | 77.0 |
| Case 6 | 0.5 | 0.409 | 0.294 | 20.0 | 0 | 80.0 |
Table 10 shows that the maximum melt fraction decreases and the average melt fraction increases with increasing of COG injection ratio. The decrease of maximum melt fraction is resulted from the decrease of coke content in the bed, and the increase of average melt fraction is due to the extension of high temperature zone by additional COG combustion just above coke combustion. When the COG injection ratio in the upper layer increases from 0 to 0.5%, the under-melted sinter is decreased from 26.7% to 20.0%, while the over-melted sinter disappears. The decreases of un-melted and over-melted sinters results in a 33.3% increase of production yield.
The effects of COG injection ratio on CR and MQI are shown in Table 11. As can be seen in Table 11, with 0.5% COG injection ratio, MQI of the upper, middle and lower layers are increased by 24.4%, 5.4% and 7.5% respectively, leading to 9.5% increase of the mean MQI. This is also resulted from the extension of high temperature zone, and particularly the temperature increase in the uppermost layer with COG combustion. The increase of MQI indicates that the overall sinter strength will be increased and return fines will be decreased significantly. With 0.5% COG injection, CR of the upper, middle and lower layers are greatly decreased by 43.0%, 31.8% and 19.3% respectively, leading to 37.6% decrease of the mean CR. Again, this can also be attributed to the extension of high temperature zone. The decrease of CR indicates that the FeO content of sinter product will be lowered and thus its reducibility will be improved greatly.
Table 11. Effect of COG injection ratio on
MQI and
CR.
| Case NO. | Injection ratio/% | MQI/(K·min) | CR/(K/min) |
|---|
| y=0.49 m | y=0.30 m | y=0.11 m | MQIave | y=0.49 m | y=0.30 m | y=0.11 m | CRave |
|---|
| Base case | 0 | 1635.9 | 3997.1 | 5602.2 | 3745.0 | 402.0 | 164.4 | 99.6 | 222.0 |
| Case 1 | 0.3 | 1766.3 | 4000.9 | 5900.9 | 3889.3 | 271.8 | 125.4 | 85.8 | 161.0 |
| Case 4 | 0.4 | 1816.7 | 4105.5 | 5923.7 | 3948.6 | 255.6 | 121.2 | 84.6 | 153.8 |
| Case 6 | 0.5 | 2035.0 | 4213.6 | 6048.9 | 4099.2 | 223.3 | 112.2 | 80.4 | 138.6 |
The effects of COG injection area on flame front and heat front are shown in Fig. 17, where the injection quantity is 0.5% and the injection location is from 60 s after ignition. It can be observed from the figure that, although the magnitude of change is not big, both the flame front speed and heat front speed decrease with the increase of COG injection area. The two fronts attain their best speed consistency when the COG injection area ratio is 80%.

The effect of COG injection area on solid phase temperature evolution at different bed layers is shown in Fig. 18, and the data of characteristic parameters derived from the figure are listed in Table 12. As can be seen from the figure, COG injection area has significant influence on the temperature evolution in the sintering bed, especially in the middle and lower bed in the cooling period. The increase of COG injection area has a similar effect with the delay of injection location. With the extension of injection area, less COG is combusted in the upper layer and more in the middle and lower layers, resulting in the increase of temperature in the middle and lower layers especially in the late sintering period.

Table 12. Characteristic parameters from temperature profiles with different COG injection area ratios.
| Case NO. | Injection area ratio/% | Tmax/K | t/s |
|---|
| y=0.49 m | y=0.30 m | y=0.11 m | y=0.49 m | y=0.30 m | y=0.11 m |
|---|
| Case 5 | 20 | 1486 | 1574 | 1593 | 85 | 151 | 225 |
| Case 6 | 40 | 1480 | 1573 | 1590 | 80 | 167 | 237 |
| Case 7 | 60 | 1473 | 1563 | 1586 | 77 | 184 | 253 |
| Case 8 | 80 | 1466 | 1554 | 1578 | 74 | 178 | 273 |
Table 12 shows that, with the increase of COG injection area, the maximum temperatures in the upper, middle and low layers are all decreased simply due to the COG dilution effect by expanding the injection area. With the increase of COG injection area from 20% to 80%, the melting zone residence time in upper layer is decreased by 11 s, but those of the middle and lower layers are increased by 27 s and 48 s respectively. The decrease of melting zone residence time in the upper layer is due to the COG dilution effect, and its increase in the middle and lower layers can be attributed to the equivalent delay effect of COG injection by extending the injection area.
The melt fraction profiles for different COG injection area ratios are shown in Fig. 19, and the characteristic parameters derived from the figure are listed in Table 13. As can be seen from the Fig. 19, with increasing the COG injection area, the melt fractions in upper and lower layers decrease monotonically, while that in the middle layer first increases and then decreases.
Table 13. Analysis of melt fraction under different COG injection area ratios.
| Case NO. | Injection area ratio/% | fmax | fave | Under-melted sinter/% | Over-melted sinter/% | Yield/% |
|---|
| Case 5 | 20 | 0.415 | 0.295 | 25.8 | 0 | 74.2 |
| Case 6 | 40 | 0.409 | 0.294 | 20.0 | 0 | 80.0 |
| Case 7 | 60 | 0.398 | 0.283 | 23.3 | 0 | 76.7 |
| Case 8 | 80 | 0.384 | 0.270 | 25.5 | 0 | 74.5 |
Table 13 shows that both the maximum and average melt fractions decrease with increasing COG injection area ratio. When COG injection area increases from 20% to 40%, the quantity of under-melted sinter is decreased from 25.8% to 20.0% while the quantity of over-melted sinter keeps 0%, resulting in the increasing of production yield from 74.2% to 80.0%. This may be attributed to the prolongation of high temperature particularly for the upper most layer. When COG injection area increases further from 40% to 80%, the quantity of under-melted sinter is increased from 20.0% to 25.5%, resulting in the decreasing of production yield from 80.0% to 74.5% simply due to the dilution effect of COG combustion. Therefore, the COG injection area of 40% is the optimum considering the sinter production yield.
The effects of COG injection area on MQI and CR are shown in Table 14. As shown in Table 14, when COG injection area increases from 20% to 40%, MQIave increases a little from 4035.5 to 4099.2 K∙min due to the increase of high temperature area. When increasing the injection area ratio further from 40% to 80%, MQIave decreases from 4099.2 to 3666.8 K/min due to the COG dilution effect. The variation behavior of CR with injection area is just contrary to that of MQI simply because that more melt will lead to its slower cooling. In can thus be concluded that excessive increase of COG injection area is not good for either sinter strength or reducibility, as well as for production yield.
Table 14. Effect of COG injection area ratio on
MQI and
CR.
| Case NO. | Injection area ratio/% | MQI/(K·min) | CR/(K/min) |
|---|
| y=0.49 m | y=0.30 m | y=0.11 m | MQIave | y=0.49 m | y=0.30 m | y=0.11 m | CRave |
|---|
| Case 5 | 20 | 2031.3 | 4101.2 | 5974.0 | 4035.5 | 224.9 | 116.1 | 83.9 | 141.6 |
| Case 6 | 40 | 2035.0 | 4213.6 | 6048.9 | 4099.2 | 223.3 | 112.2 | 80.4 | 138.6 |
| Case 7 | 60 | 1910.8 | 4011.8 | 5840.8 | 3921.1 | 233.9 | 123.4 | 90.9 | 149.4 |
| Case 8 | 80 | 1691.8 | 3728.9 | 5579.8 | 3666.8 | 237.1 | 132.8 | 102.2 | 157.4 |
6. Conclusions
(1) Melting fraction fm=0.20–0.42, melt quantity index MQI and cooling rate CR are obtained by analyzing the solid phase temperature curve of sintering material layer and used to represent the yield, strength and reducibility of sinter product.
(2) Simulations were performed for COG injection location of 60 s, 120 s, and 180 s after ignition when COG injection quantity was 0.3% and COG injection area is 40%. With injection location of 60 s after ignition, the production yield is increased by 26.2%, the mean MQI is increased by 3.9% and the mean CR is decreased by 27.5% compared with no COG injection, showing that the sinter yield and quality are improved significantly. The location of COG injection has only a little influence on its effectiveness on sintering, with that the sinter yield decreases slightly with the delay of COG injection while the mean MQI and CR hardly change.
(3) Simulations were performed for COG injection quantity of 0.0%, 0.3%, 0.4% and 0.5% when COG injection area was 40% and injection location is 60 s after ignition. The results show that the yield and sinter strength increase with the increasing the quantity of COG injection. When COG injection increases to 0.5%, the sinter yield increases by 33.3%, the mean MQI increases by 9.5% and the mean CR decreases by 37.6%.
(4) Simulations were performed for COG injection area of 20%, 40%, 60% and 80% when COG injection quantity 0.5% and injection location is 60 s after ignition. The results show that the sinter yield increases prominently first and then decreases significantly with the increase of injection area, attaining its maximum at 40% of injection area. At the same time, the mean MQI increases slightly first and then decreases significantly, while the mean CR decreases slightly first and then increases significantly, both of which attain their extremum also at 40% of injection area. Therefore, excessive injection area is not good for sinter strength and reducibility, as well as for production yield.
Acknowledgment
This work is financially supported by National Science Foundation of China (Grants 51604068, 51574064), China Scholarship Council (CSC No. 201706085021).
Nomenclature
Co2: oxygen mole concentration, mol/m3
CCO: carbon monoxide mole concentration, mol/m3
CH2: hydrogen mole concentration, mol/m3
CCH4: methane mole concentration, mol/m3
CH2O: moisture mole concentration, mol/m3
Cp,g, Cp,s: specific heat capacities of the gas and solid phases, J/(kg K)
Di,m: the diffusion coefficient of ith gaseous species, m2/s
Fj: interaction force in j direction between gas phase and solid phase, N/m3
Hs: carrying enthalpy of gas produced by gas-solid reaction, J/(m3 s)
hg-w: heat transfer coefficient for convection at the gas-to-wall, W/(m2 K)
hs-w: heat transfer coefficient for convection at the solid-to-wall, W/(m2 K)
hair: heat transfer coefficient for convection at the outside pot wall to the environment, W/(m2 K)
Ks,eff: effective thermal conductivity of solid phase, W/(m K)
kg,eff: effective thermal conductivity of gas phase, W/(m K)
Mi,g, Mi,s: mass of i from the homogeneous gas reaction and the gas-solid heterogeneous reaction, kg/(m3 s)
P: phase pressure, Pa
Qs,g: heat of gas-solid heterogeneous reaction into the gas phase, J/(m3 s)
Qs,s: heat of gas-solid heterogeneous reaction into the solid phase, J/(m3 s)
Qs,ms: solidification heat, (J/(m3 s))
Qg: heat of homogeneous combustion reactions in gas phase, J/(m3 s)
Qconv: heat of gas-solid convection, J/(m3 s)
R: gas constant, J/(mol K)
RH2: hydrogen combustion reaction rate, kmol/(m3 s)
RCH4: methane combustion reaction rate, kmol/(m3 s)
RCO: carbon monoxide combustion reaction rate, kmol/(m3 s)
Ss: mass transfer between gas and solid as a result of heterogeneous gas-solid reaction, kg/(m3 s)
Sg: mass transfer of homogeneous gas reaction, kg/(m3 s)
Si: source term of momentum equation, kg/(m2 s2)
Ts, Tg: solid and gas temperatures, K
Tm1, Tm2: solidus and liquidus temperatures of melting phase respectively, K
Tair: environment temperature around the sintering pot, K
Ui,g, Uj,g: superficial velocity, m/s
xj: spatial coordinates, m
Yi,g, Yi,s: mass fraction of ith gaseous species and mass fraction of ith solid species, –
Greeks
ε: sintering bed voidage, –
τ: time, s
μg: dynamic viscosity, Pa s
ρg, ρs: gas and solid densities, kg/m3
δw: thickness of the sintering pot wall, m
λw: thermal conductivity of the sintering pot wall, W/(m K)
References
- 1) W. T. Zhou, J. G. Hu and Y. L. Guo: World Iron Steel., (2011), No. 6, 47 (in Chinese).
- 2) N. Oyama, Y. Iwami, T. Yamamoto, S. Machida, T. Higuchi, H. Sato, M. Sato, K. Takeda, Y. Watanabe, M. Shimizu and K. Nishioka: ISIJ Int., 51 (2011), 913.
- 3) V. S. Guilherme and J. A. d. Castro: Metall. Mater., 65 (2012), 357.
- 4) F. G. Han, L. X. Xu, X. F. Wu, H. P. Li, C. G. Bi, H. M. Long, H. Y. Nie and P. Q. Liu: Sinter. Pelletizing, 41 (2016), 12 (in Chinese).
- 5) H. P. Li, H. Y. Nie, F. G. Han, P. L. Tan, H. Y. Qiu, F. Tian and X. F. Shen: Sinter. Pelletizing, 40 (2015), 1 (in Chinese).
- 6) Z. L. Cheng, J. Yang, L. Zhou, Y. Liu, Z. Guo and Q. Wang: Energy Convers. Manag., 125 (2016), 254.
- 7) Z. L. Cheng, J. Yang, L. Zhou, Y. Liu and Q. Wang: Appl. Therm. Eng., 105 (2016), 894.
- 8) Z. L. Cheng, J. Wang, S. Wei, Z. Guo, J. Yang and Q. Wang: Appl. Energy, 207 (2017), 230.
- 9) S. Ergun: Chem. Eng. Prog., 48 (1952), 89.
- 10) X. H. Zhang, Z. Chen, J. Y. Zhang, P. X. Ding and J. M. Zhou: Appl. Therm. Eng., 54 (2013), 7.
- 11) W. J. Ni, H. F. Li, Y. Y. Zhang and Z. S. Zou: Energies, 12 (2019), 213.
- 12) B. Liu, Y. H. Feng, Z. Y. Jiang and X. X. Zhang: CIESC J., 63 (2012), 1344.
- 13) N. K. Nath and K. Mitra: Mater. Manuf. Process., 20 (2005), 335.
- 14) J. Zhang, X. M. Guo, Y. H. Qi and D. L. Yan: J. Iron Steel Res. Int., 22 (2015), 288.
- 15) K. Ohno, K. Noda, K. Nishioka, T. Maeda and M. Shimizu: ISIJ Int., 53 (2013), 1642.
- 16) K. Ohno, K. Noda, K. Nishioka, T. Maeda and M. Shimizu: ISIJ Int., 53 (2013), 1588.
- 17) H. Zhou, J. P. Zhao, C. E. Loo, B. G. Ellis and K. F. Cen: ISIJ Int., 52 (2012), 1550.
- 18) J. P. Zhao, C. E. Loo and R. D. Dukino: Combust. Flame, 162 (2015), 1019.
- 19) G. Wang, Z. Wen, G. F. Lou, R. F. Dou, X. W. Li, X. L. Liu and F. Y. Su: Int. J. Heat Mass Transf., 97 (2016), 964.
- 20) X. X. Huang, X. H. Fan, X. L. Chen, X. Z. Zhao and M. Gan: Ironmaking Steelmaking, 46 (2019), 649.
- 21) M. Pahlevaninezhad, M. D. Emami and M. Panjepour: Appl. Math. Model., 40 (2016), 8475.
- 22) H. Zhou, Z. Liu, M. Cheng, M. Zhou and R. Liu: Energy Fuel., 29 (2015), 974.
- 23) M. L. Hobbs, P. T. Radulovic and L. D. Smoot: AIChE J., 38 (1992), 681.
- 24) W. Yang, C. Ryu, S. Choi, E. Choi, D. Lee and W. Huh: ISIJ Int., 44 (2004), 492.
- 25) N. K. Nath, A. J. O. Silva and N. Chakraborti: Steel Res., 68 (1997), 285.
- 26) B. Zhang, J. Zhou, M. Li and Y. Li: ISIJ Int., 58 (2018), 17.
- 27) N. K. Nath and K. Mitra: Ironmaking Steelmaking, 31 (2004), 199.
- 28) B. Zhang, J. Zhou and M. Li: Appl. Therm. Eng., 131 (2018), 70.
- 29) C. E. Loo, N. Tame and G. C. Penny: ISIJ Int., 52 (2012), 967.
- 30) Z. Z. Zhang and L. G. Ai: Mathematical Analysis and Simulation of Metallurgical Process, Metallurgical Industry Press, Beijing, (1997), 117 (in Chinese).
- 31) Y. Iwami, T. Yamamoto, T. Higuchi, K. Nushiro, M. Sato and N. Oyama: ISIJ Int., 53 (2013), 1633.
- 32) Z. Z. Cheng, S. Wei, Z. Guo, J. Yang and Q. Wang: J. Clean. Prod., 161 (2017), 1374.