Abstract
In the weld metal the time-temperature-precipitation(TTP) diagram called as TTP curve of sigma phase in duplex stainless steel was investigated to clarify the difference from that in base metal or heat affected zone. Intermetallic phase such as sigma phase is harmful for mechanical properties of duplex stainless steels. The increasing of alloying elements of chromium and molybdenum effective for improving of corrosion resistance promotes the sigma phase precipitation in weldment. The weld metal consists of the different microstructure from the base metal. Because that consists of as solidified microstructure followed by transformation of a part of ferrite to austenite phase during cooling in welding process.
Employing 25%Cr duplex stainless steel weld metal bearing 3% of Mo, 2% of W, 0.3% of N and various level of Ni, the time-temperature-precipitation(TTP) curve of each weld metal was obtained by the microstructure observation test with optical microscope after heated at various temperature. The TTP curve of weld metal is shifted to the direction of longer time comparing with that of the base metal with the almost same chemical composition. The mechanism of that shift was explained from a point of the difference of partitioning of alloying elements such as nickel and chromium between the phases by using the physical model proposed.
1. Introduction
Duplex stainless steels are widely applied to the various structures because they exhibit high cost performance. These steels have the potential to obtain a high corrosion resistance, high strength and high toughness economically because they have lower nickel content in comparison with that in austenitic stainless steels. In later years, super duplex stainless steels improved in terms of corrosion resistance due to the increase in the amount of chromium, molybdenum, tungsten and nitrogen have been developed. The increase in the amount of these elements promotes the harmful intermetallic such as sigma phase. Therefore the prevention of this phase formation was an important subject in the welding, fabrication, and manufacturing process. There are many research works1,2,3,4,5,6,7,8,9) focusing on the precipitation kinetics of the sigma phase, however, in most of the aforementioned studies, the effect of each alloying elements on the growth property has not been systematically explained. For the duplex stainless steels consisting of various chemical compositions it is necessary to determine the growth rate by using experimental method individually. So in some previous works the effects of chromium, molybdenum tungsten and nickel on the growth rate of the sigma phase has already been clarified with a physical model proposed by the authors.10,11) It has been reported that by applying this model the time-temperature-precipitation (TTP) diagram called as TTP curve is described in duplex stainless steels containing various chemical compositions.12,13)
Considering the application of this model to the weldment, that model obtained with the base metal is applicable to the heat affected zone because the transformation of sigma phase initiates from the microstructure of base metal. However, the weld metal of duplex stainless steel has the different microstructure from that in the base metal. The base metal consists of the microstructure of ferrite and austenite phase with almost same fraction of each phase by the solution heat treatment. On the contrary the weld metal consists of microstructure formed by the solidification and transformation during cooling process of weld thermal cycle. Therefore the phase ratio and the partitioning of alloying elements between the phases is different between the base metal and weld metal. While it is well known that in the weld metal the sigma phase precipitation property is different,7,8,9) the mechanism of the difference of precipitation properties or that of the behavior of alloying elements from the base metal has not sufficiently clarified.
In this work the applicability of the model proposed in the previous works by authors to the weld metal was verified and the difference of effects of alloying elements on the time-temperature-precipitation (TTP) diagram (C-curve) between the weld metal and base metal were investigated.
2. Experimental
Generally the weld metal of duplex stainless steel has about 2 to 3% higher Ni content than the base metal to obtain the closer phase ratio to that in the base metal. So the duplex stainless steel weld metals consisting of 25%Cr, 3%Mo, 2%W and 0.3%N with the Ni content varying in 7–9% were used as listed in Table 1. Those steels were melt with a laboratory electric furnace. Those steels were hot rolled to the 12 mm thick plates by the same condition as the previous work.11) The weld metals were produced by using gas tungsten arc welding on those plates. Welding was conducted without filler metal using the gas tungsten arc welding process with the heat input of 3.0 kJ/mm. The weldment was machined to the 10 mm wide, 10 mm thick and 60 mm long specimens with the weld metal in the center. The specimens heated at various constant temperatures ranged from 1073 K to 1273 K during various time followed by quenching with helium gas. After the heat treatment the specimens were evaluated in a term of sigma phase area fraction by the same way reported.11)
Table 1. Chemical compositions of steels tested (mass%).
| C | Si | Mn | P | S | Ni | Cr | Mo | W | N |
|---|
| 0.02 | 0.16 | 0.50 | 0.019 | 0.001 | 7.13 | 25.34 | 3.05 | 2.03 | 0.316 |
| 0.02 | 0.15 | 0.50 | 0.019 | 0.001 | 8.04 | 25.15 | 3.02 | 2.03 | 0.315 |
| 0.02 | 0.16 | 0.50 | 0.019 | 0.001 | 9.08 | 25.30 | 3.01 | 2.03 | 0.320 |
The microstructure of weld metal before heat treatment was evaluated in a term of the distribution of alloying elements by electron probe micro analyser (EPMA) to clarify the partitioning of the alloying elements in each phase of ferrite and austenite.
3. The Effect of Alloying Element on TTP Curve of Weld Metal
3.1. Partitioning of Alloying Elements in Each Phase
Figure 1 shows the partitioning of the alloying elements measured with EPMA in each phase of ferrite and austenite in the weld metal as welded and in the base metal. In the base metal the alloying elements of Cr, Mo and W were enriched in the ferrite phase but Ni was enriched in the austenite phase. On the contrary in the weld metal the partitioning of Cr, Mo, and W occurred rarely comparing with that in the base metal. The partitioning of Ni slightly occurred but that was much less than in the base metal. The weld metal of duplex stainless steel solidified as ferrite phase where the partition coefficients between the liquid and the ferrite phase have high values resulting in the low segregation and the diffusion for equilibrium partitioning during cooling does not occur sufficiently. It is considered that is why the partitioning of those elements rarely occurred in the weld metal. The partition coefficient between the liquid and the ferrite of Ni is relatively lower and the austenite phase forms preferentially at the Ni segregated site, therefore it is assumed that the partitioning of Ni occurred slightly even in the weld metal.

Figure 2 shows the examples of microstructure in weld metal of 25%Cr-7%Ni-3%Mo-2%W-0.3%N and 25%Cr-9%Ni-3%Mo-2%W-0.3%N heated at 1173 K for the durations of 180 s and 600 s. In these micrographs the sigma phase is observed as black phase. The larger fraction of sigma phase was formed for shorter heating time in the weld metal containing Ni of 9% with the comparison of that containing Ni of 7%. The black etched area fraction of sigma phase was measured with the image analyser using the specimens heated at various constant temperature for the various durations. Using those data TTP curves of sigma phase precipitation with the volume fraction of 1% as the criteria were drawn as shown in Figs. 3, 4, 5. In each figure the curves of dotted line mean the result of the base metal consisting of almost same chemical compositions to each weld metal obtained in the previous work.10,12) Each of the TTP curve of the weld metal was shifted to the direction of longer time comparing with that in the base metal consisting of the same chemical compositions to each weld metal. The effect of Ni on the nose time of TTP curve is shown in Fig. 6. While the increase of Ni accelerated the nose time to the shorter direction in the both of the weld metal and base metal, it was clarified that the nose times were longer in the weld metals than that in the base metals in case of the same Ni content.

4. Modeling of TTP Curve of Weld Metal
The growth of the sigma phase in the base metal with the accordance to the following equations based on the traditional nucleation theory14) has been clarified in the previous work.10,11)
|
X=1-exp[
-
(
k
p
⋅t
)
m
]
| (1) |
|
k
p
=
K
00
(
T
eq
/ΔT
)
0.8
D
eff
exp[
-ϕ
(
T
eq
/ΔT
)
2
/(
RT
)
]
| (2) |
|
ϕ=
32π
15
V
2
N
σ
3
/
(
C
p
ΔH
)
2
| (3) |
|
K
00
=
[
16
2
⋅
π
2
15
⋅V
C
0
N
x
ω
0
1/2
σ
2
/
(
C
p
ΔH
)
2
/
r
a
4
]
2/5
| (4) |
|
=
[
2π
2
C
0
N
x
ω
0
1/2
/(
VNσ
r
a
4
)
⋅ϕ
]
2/5
| (5) |
Here the parameter of X is the ratio of the progress of transformation to the equilibrium condition. Nx is number of atoms to determine the growth rate, V is the molar volume, σ is the interface energy between sigma and ferrite phase, Deff is the effective diffusion constant11) of the dominant atom, Δ H is the enthalpy of transformation of intermetallic, Teq is the solvus temperature of the intermetallic phase, Δ T is the degree of undercooling (= Teq−T), and Cp is the concentration of the dominant atom to determine the growth rate in the intermetallic phase and Co is concentration of the dominant atom to determine the growth rate in the steel.
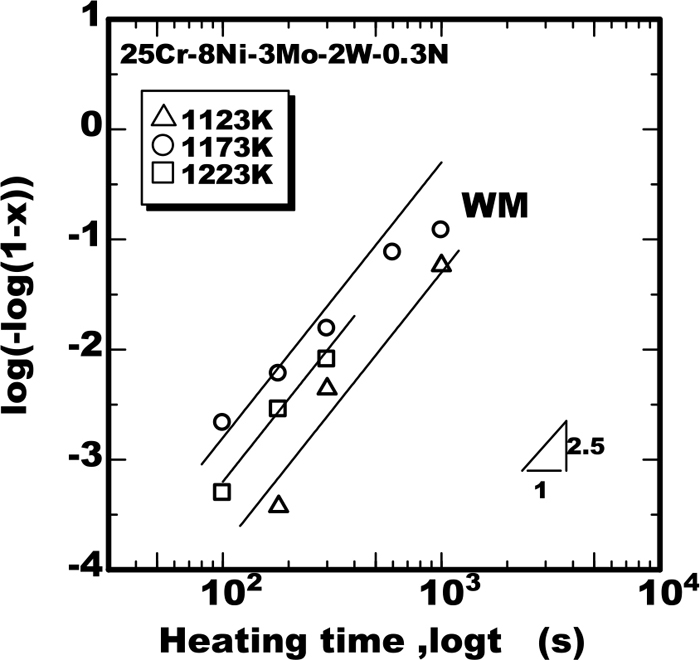
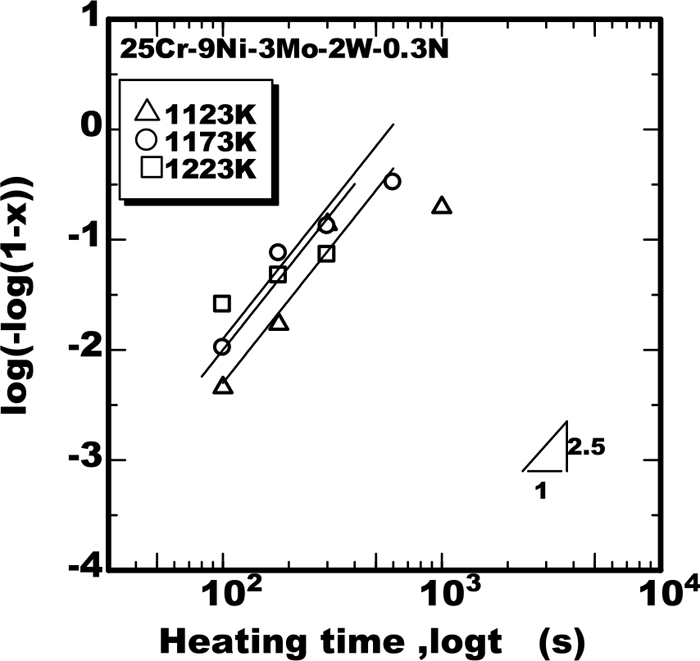
To clarify the applicability of Eq. (1) to the weld metals, the progress of transformation as the form of log(−log(1−X)) were plotted against the heating time as shown in Figs. 7, 8, 9. From the results it was found that the sigma phase grew according to the J-M-A-K Eq. (1) with the value of m as 2.5 in the weld metal. The growth rate constants kp obtained from those results were plotted against the temperature together with the calculated curves as shown Fig. 10. The calculated curves in Fig. 10 are produced applying the parameters shown in Table 2 to Eq. (2) based on the model proposed in the previous work.11) The calculated curves had good fit to the experimental data, from the results the applicability of the model to the weld metal was verified.

Table 2. Values of parameters K
00,
φ for various steels tested in sigma phase precipitation model.
| Chemical composition (%) | Teq
(K) | Weld metal | Base metal |
|---|
| Cr | Ni | Mo | W | N | K00
(s−1) | φ
(J/mol) | K00
(s−1) | φ
(J/mol) |
|---|
| 25 | 7 | 3 | 2 | 0.3 | 1340 | 3.00×10¹¹ | 300 | 2.80×10¹¹ | 200 |
| 25 | 8 | 3 | 2 | 0.3 | 1354 | 3.40×10¹¹ | 320 | 5.60×10¹¹ | 240 |
| 25 | 9 | 3 | 2 | 0.3 | 1370 | 8.50×10¹¹ | 340 | – | – |
5. Discussion
The influence mechanism of the alloying elements on the sigma phase precipitation behavior in the weld metal from a point of view of comparison with that in the base metal was discussed.
First the reason why each of the TTP curve of the weld metal was shifted to the direction of longer time comparing with that of the base metal consisting of the same chemical compositions to each weld metal was discussed. Comparing the values of the parameters of φ and K00 between the weld metal and the base metal, the weld metal had higher value of φ than the base metal in the both cases of 7%Ni and 8%Ni. From a point of view of nucleation theory used as Eq. (2) in this model, the increase in the overcooling of ΔT/Teq reduces the barrier energy against the nucleation of sigma phase in inverse proportion to the square of ΔT/Teq. The value of φ is corresponding to the constant of proportionality and in case of the same overcooling the barrier energy against the nucleation is raised with the increase in the value of φ. It is understood that the higher value of φ in the weld metal resulting in decreasing in the frequency of nucleation is one of the reasons why the TTP curve was shifted to the longer time direction comparing with that of the base metal consisting of the same chemical compositions.
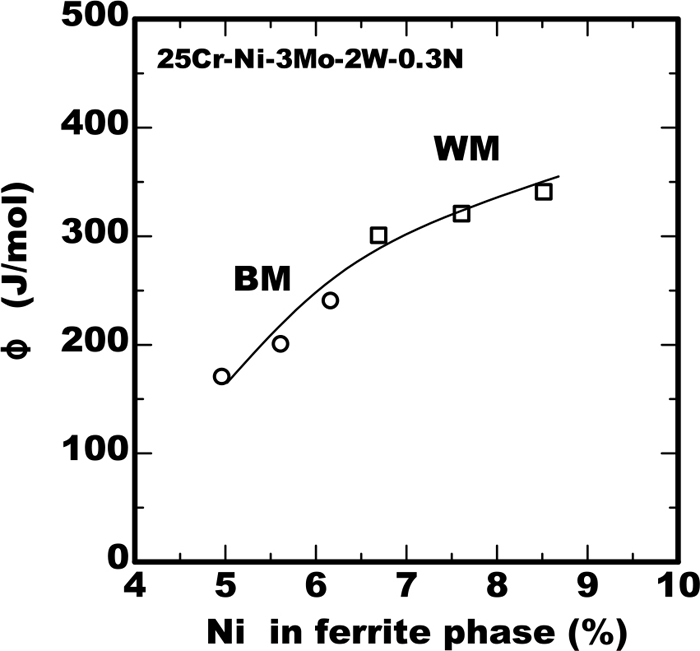
Next the mechanism to be higher value of φ in the weld metal than that in the base metal is discussed. The content of alloying elements in the ferrite phase is dominant for precipitation because the sigma phase precipitation initiates as the transformation of ferrite phase to the austenite and sigma phase. As mentioned above the partitioning of alloying elements is different between the weld metal and base metal. The values of φ were plotted against the Ni content in the ferrite phase as shown in Fig. 11. The value of φ was increased with the increase of Ni content. In case of the same average content of Ni the weld metal has higher Ni content than base metal therefore the value of φ was considered to be higher in the weld metal. However, regarding Cr content on the contrary the content in the weld metal was lower than that in the base metal already shown in Fig. 1. From the finding of the previous work11) the less Cr content reduces the value of φ. Therefore it is necessary to consider the contradictory influence of the both of Ni and Cr content on the value of φ in the ferrite phase. From Eq. (3), the value of φ has inverse proportionality to the square of the transformation enthalpy. The value of the transformation enthalpy was calculated using the following equation by applying the value of φ in Fig. 11 to Eq. (6).
|
C
p
ΔH=
[
32π
15
V
2
N
σ
3
/ϕ
]
1
2
| (6) |
The results were shown in Fig. 12 as the effect of Ni or Cr in the ferrite phase. The vertical axis of CpΔH/[CpΔH]r in the figure is the relative value normalized by [CpΔH]r, which is the value in the base metal of 25%Cr-7%Ni-3%Mo-2%W-0.3%N steel. The effects of Cr content were obtained using the data in the base metal in the previous work.11) The both of Ni and Cr reduced the enthalpy but the effect of Ni on the reduction of the enthalpy was much larger than that of Cr. From this result it is understood the higher value of φ in the weld metal is due to that the effect of higher content of Ni on the enthalpy exceeded that of lower content of Cr.

The value of K00 reflects the nucleation density. The value of K00 increases with the increase of the values of φ, ω0 and C0 from Eq. (5). The dominant alloying element for the nucleation of sigma phase is W and Cr as reported in the previous work.11) The values of ω0 and C0 of W in the ferrite phase of weld metal is lower than that of the base metal. Because less partitioning in the ferrite phase causes lowering the values of C0 and ω0 consisting of the function of the ratio of (C0−Cγ) to (Cn−Cγ), where Cγ and Cn are the W content in the austenite phase and nucleated phase of intermetallic phase respectively. The decreasing of the values of C0 and ω0 has the effect to reduce the value of K00 in the weld metal. On the contrary the increase in the value of φ has the effect to increase the value of K00. The value of K00 is considered as the result of mutual cancelling of those effects. The reason why the difference of the value of K00 between the weld metal and base metal was not remarkable is explained by mutual cancelling of those effects. While the value of K00 increased remarkably in the base metal with the increase of Ni content from 7% to 8% due to raising of the values of φ, ω0 and C0, that increased slightly in the weld metal even in the case of increase of Ni content. That is interpreted due to that the values of ω0 and C0 did not increase because of less partitioning in the ferrite phase in spite of increasing in the partitioning of W in the base metal by reduction of the ferrite phase fraction caused by the increase of Ni.
From the above discussion in the weld metal the relatively delayed mechanism of sigma phase precipitation comparing with the base metal is interpreted by the increase in the coefficient φ for the barrier energy caused by the higher partitioning of Ni in the ferrite phase and decreasing in the nucleation density by the lower partitioning of Cr and W.
From the above discussion the increase of Ni in the ferrite phase is effective for the increase in the coefficient φ for the barrier energy against nucleation so the effect to delay the sigma phase precipitation is expected. However the addition of Ni to duplex stainless steels intensively accelerates the sigma phase precipitation as well known. The acceleration is caused mainly by elevating the solvus temperature Teq of the sigma phase and by increasing the values of ω0 and C0. Even increasing in the values of φ, the raising of the temperature Teq at the same time reduces the barrier energy of φ(Teq⁄(Teq−T))2 from Eq. (2) by the addition of Ni. In case of the change of partitioning of Ni content the solvus temperature of Teq is not elevated, therefore the enrichment of Ni in the ferrite phase is effective for delaying of precipitation as examples of the weld metal.
6. Conclusion
The applicability of the proposed model to the weld metal and the difference of effects of alloying elements on the TTP curve of sigma phase precipitation between the weld metal and base metal were investigated regarding 25%Cr-7/9%Ni-3%Mo-2%W-0.3%N duplex stainless steel.
(1) Each of the TTP curve of the weld metal is shifted to the direction of longer time comparing with that of the base metal consisting of the same chemical compositions.
(2) The applicability of the model proposed for the base metal to the weld metal was clarified with the good fit of calculated results of growth rate to the experimental dada in the weld metal.
(3) The relatively delayed mechanism of sigma phase precipitation in the weld metal comparing with the base metal is interpreted by the higher partitioning of Ni in the ferrite phase and by the lower partitioning of Cr and W as the results of considering the effect on the dominant parameters for precipitation in the proposed model.
References
- 1) P. Ferro and F. Bonollo: Metall. Mater. Trans. A, 43 (2012), 1109.
- 2) H. Sieurin and R. Sandström: Mater. Sci. Eng. A, 444 (2007), 271.
- 3) X. Li, A. P. Miodownik and N. Saunders: Mater. Sci. Technol., 18 (2002), 861.
- 4) J. O. Nilsson, P. Kangas, T. Karlsson and A. Wilson: Metall. Mater. Trans. A, 31 (2000), 35.
- 5) J. W. Elmer, T. A. Palmer and E. D. Specht: Metall. Mater. Trans. A, 38 (2007), 464.
- 6) S. Wessman, L. Karlsson, R. Pettersson and A. Östberg: Weld. World, 56 (2012), No. 11–12, 79.
- 7) K. Nishimoto, K. Saida and O. Katsuyama: Weld. World, 50 (2006), No. 3–4, 13.
- 8) S. Hertzman, T. Huhtala, L. Karlsson, J.-O. Nilsson, M. Nilsson, R. Jargelius-Pettersson and A. Wilson: Mater. Sci. Technol., 13 (1997), 604.
- 9) J. O. Nilsson, T. Huhtala, P. Jonsson, L. Karlsson and A. Wilson: Metall. Mater. Trans. A, 27 (1996), 2196.
- 10) K. Ogawa and T. Osuki: Q. J. Jpn. Weld. Soc., 33 (2015), 55.
- 11) K. Ogawa and T. Osuki: ISIJ Int., 59 (2019), 122.
- 12) K. Ogawa and T. Osuki: Q. J. Jpn. Weld. Soc., 33 (2015), 62.
- 13) K. Ogawa and T. Osuki: ISIJ Int., 59 (2019), 129.
- 14) T. Nishizawa: Thermodynamics of Microstructures, ASM International, Materials Park, OH, (2008), 91.