Steelmaking
Effect of Lime Dissolution Rate in Slag on Hot Metal Dephosphorization
2020 Volume 60 Issue 5 Pages 922-929
Details
2020 Volume 60 Issue 5 Pages 922-929
In order to clarify the effect of the lime (CaO) dissolution rate in slag on hot metal dephosphorization, a 150 kg scale hot metal dephosphorization experiment was carried out. The rate of decrease of free CaO and the dephosphorization rate were measured while varying the ratio of CaO and SiO2, which was defined as basicity.
The dephosphorization rate showed its maximum value at basicity of around 1.0. At basicity higher than 1.0, the dephosphorization rate decreased due to poor dissolution of CaO in the flux.
A thermodynamic calculation revealed that crystallization of 2CaO·SiO2(-3CaO·P2O5) in the liquid slag deteriorated CaO dissolution when basicity was higher than 1.5.
The mass transfer coefficient of CaO in slag was calculated assuming that the interface between the CaO and liquid slag is saturated with CaO. High basicity showed a low mass transfer coefficient.
The apparent slag viscosity was calculated in terms of the solid phase and showed a correlation with the CaO diffusion rate. The CaO diffusion rate in slag decreased with higher values of not only the liquid slag viscosity, but also the solid-liquid coexistent slag viscosity. These results suggest the existence of an optimum basicity for effective CaO dissolution.
In recent years, demand for lower phosphorus steel products has increased, while iron ore quality has deteriorated (trend toward higher phosphorus ore), increasing the importance of high efficiency hot metal dephosphorization. CaO efficiency for dephosphorization is important from the viewpoints of reducing both steelmaking slag generation and production costs. Many studies on increasing dephosphorization efficiency have been reported.1,2,3,4,5,6,7) Ogasawara et al. reported that CaO dissolution was enhanced by increasing FeO generation in the early stage of dephosphorization.1) Tamura et al. reported that CaO dissolution was enhanced by blasting CaO powder from the top lance at the hot spot.2) Other reports have also examined issues such as utilization of a lower melting point agent3,4) and hot recycling of converter slag.5) However, basic knowledge concerning the dissolution behavior of CaO into slag is still insufficient. Matsushima et al.6) evaluated the CaO dissolution rate into slag by rotating CaO processed in a cylindrical shape at 200 to 400 rpm in FeO–CaO–SiO2 slag at 1673 K, and evaluated the CaO dissolution rate by measuring the rate of decrease in the diameter of the cylindrical CaO. However, the slag composition was limited to the lower slag basicity ((%CaO)/(%SiO2)) region between 0.6 and 1.0, which does not represent a practical condition in hot metal dephosphorization treatment. Kitamura et al.7) reported the effect of precipitation and dissolution of the solid phase in slag on the dephosphorization rate by an analysis using a coupled reaction model. However, because they assumed the CaO dissolution rate under the condition of higher slag basicity based on the relationship between the solid phase ratio and the viscosity of the slag, an accurate evaluation of the effect of slag basicity was not possible.
In the present work, 60 kg-scale hot metal dephosphorization experiments were carried out in order to evaluate the effect of the CaO dissolution rate into slag on hot metal dephosphorization. In these experiments, the melting behavior of the undissolved CaO in the dephosphorization agent was investigated, and the relationship with the hot metal dephosphorization rate was evaluated. The factors which affect the dissolution behavior of the dephosphorization agent are the chemical composition, size, and amount of the dephosphorization agent, the hot metal temperature, and the stirring condition of the hot metal. However, it was difficult to evaluate the effect of the agent size, as a small-scale melting furnace was used in these experiments. Therefore, a well-ground agent was evaluated at a constant size in this work. Moreover, top-blowing oxygen should be supplied to the hot metal to simulate the hot metal dephosphorization process, but in this work, the oxygen was supplied by adding iron oxide powder at fixed intervals to avoid splashing of the hot metal and slag, which cannot be assumed as a constant condition. The effect of the slag composition (basicity) on the CaO dissolution rate was evaluated under the conditions of a constant hot metal temperature and bottom-blowing gas flow rate. The solubility of CaO was calculated by Factsage,9,10) and the CaO dissolution rate was analyzed. In addition, the obtained mass transfer rate constant was compared with those in the other reports.
Hot metal dephosphorization experiments were carried out with a 150 kg-scale induction furnace (φ260×500 mmH). A schematic drawing and the experimental conditions are shown in Fig. 1 and Table 1, respectively. First, 60 kg of pure iron was melted in a MgO crucible and adjusted to the predetermined chemistry (3.5 wt%C-0.1 wt%P) and temperature (1623±20 K) with a carbon material (“CarboNet”, LNS, Asahi Industry Corporation) and Fe–P alloy. Burned CaO (Ube Material Industries, −0.1 mm) and SiO2 (Kishida Chemical) were mixed and used as the dephosphorization agent. The aimed slag basicity, C/Saimed, was set by changing proportions of the burned CaO powder and SiO2. 18.7 kg/t of the dephosphorization agent was added from the top at the beginning of the experiment. Iron ore powder (FetO: 95 wt%, SiO2: 3 wt%, total amount: 50 kg/t) was added from the top between the beginning and 35 min at 5 min intervals (8 times). During the experiments, 25–30 NL/min of Ar gas was supplied from a porous plug at the bottom of the MgO crucible. Iron ore was not added between 35 and 60 min. Metal and slag samples were taken during the experiment at 5 min intervals. The metal samples were ground and supplied for wet analysis. The slag samples were cooled in the air, ground, and supplied for wet luminescence analysis. Free CaO in the slag was sampled by extraction separation with ethylene glycol and analyzed by atomic absorption.

Schematic illustration of experimental setup.
| Furnace | 150 kg induction Furnace | |
|---|---|---|
| Crucible | MgO, φ0.25 m | |
| Metal | Weight | 60 (kg) |
| Composition | [%C]=3.5, [%P]=0.1 | |
| Temperature | 1623 (K) | |
| Flux | CaO + SiO2 | 18.7 (kg/t) (added at beginning of experiment) |
| CaO/SiO2 | 0.5, 0.75, 1.0, 1.5, 2.0, 2.5, 3.0, 3.5 | |
| Fe2O3 | 6.25 (kg/t) × 8 (added at 5 min intervals) | |
Figure 2 shows an example of the change of the phosphorus content (wt%) in the hot metal, [%P], with time. The dephosphorization reaction proceeded by addition of iron ore, which is an oxygen source. The dephosphorization rate was fast in the order C/Saimed 1.0, 0.5, 3.5 and 2.0, which does not agree with the thermodynamic order. The change of [%P] during 0 to 20 min was regarded as a roughly first-order reaction. Under higher basicity conditions of more than 2.0, the dephosphorization reaction did not proceed after 25 min, even with iron ore addition.

Changes in [%P] with time.
The relationship between the dephosphorization rate between 0 and 20 min and C/Saimed is shown in Fig. 3. The dephosphorization rate was defined by Eq. (1), and was also calculated for other conditions not shown in Fig. 2.
| (1) |

Dephosphorization rate calculated at each aimed basicity.
Here, [%P]20min is the weight percent of the phosphorus content in the hot metal at 20 min, [%P]initial is the weight percent of the phosphorus content in the hot metal at the beginning of the experiment, and t is time (min).
As shown in Fig. 3, the dephosphorization rate increased with increasing C/Saimed in the range of C/Saimed between 0.5 and 1.0. The maximum dephosphorization rate was obtained when C/Saimed was 1.0, and the dephosphorization rate decreased at higher C/Saimed of more than 1.5. It is considered that the dephophorization rates at the lower C/Saimed of 0.5 and 0.75 were low due to a shortage of CaO. On the other hand, solidified slag was observed under high C/Saimed conditions between 1.5 and 3.5. Under those conditions, the dephosphorization rates were low because the added CaO did not melt, and thus did not function as a dephosphorization agent.
3.2. CaO Melting BehaviorThe change in the slag chemistry corresponding to CaO dissolution is important for evaluating the effect of slag basicity on hot metal dephosphorization behavior. In this work, the transition of undissolved CaO, i.e., free CaO (hereinafter, f-CaO), is the focus of study for evaluating the CaO dissolution at each slag basicity. The solid ratio of CaO is defined as shown in Eq. (2).
| (2) |

Influence of aimed basicity on decrease of f-CaO.
Figure 5 shows the relationship between the aimed and observed slag basicity. Here, the observed slag basicity was calculated from the dissolved CaO content by subtracting (%f-CaO) from (%CaO) and (%SiO2), as shown in Eq. (3).
| (3) |

Comparison between aimed and observed basicity.
Figure 6 shows an example of the change of the iron oxide content (wt%FeO + wt%Fe2O3) in the slag at each level of C/Saimed. The iron oxide content tends to be lower at higher slag basicities. Therefore, the reduction rate of the added iron oxide is considered to be higher at higher slag basicity, since the addition rate of iron oxide is the same under all conditions. (The iron oxide mainly reacts with the carbon in the hot metal as an oxygen source). Although it is conceivable that slag foaming or other second-order effects caused by decarburization might affect CaO dissolution, this point is not considered here due to the complexity of the phenomena. Hence, the CaO dissolution rate was analyzed by using the obtained iron oxide content in the slag.

Changes in (%FeO)+(%Fe2O3) with time.
The relationship between the slag basicity and CaO dissolution rate was evaluated based on the decreasing rate of the obtained f-CaO and the saturated CaO contant calculated by Factsage.9,10) Figure 7 shows a conceptional diagram of CaO dissolution in slag. Solid CaO exists in the liquid bulk slag. At higher slag basicities, the liquid bulk slag coexists with the dicalcium silcate phase (2CS, or with tricalcium phosphate 2CS(-3CP)). The interface between the solid CaO and the liquid bulk slag can be regarded as CaO saturation during CaO dissolution.

Schematic illustration of CaO dissolution.
Matsushima et al.6) reported that the CaO dissolution rate is proportional to the difference between the liquid CaO content ((%CaO)liquid) and the saturated CaO content at the interface of solid CaO ((%CaO)sat.). In their paper, (%CaO)sat. was obtained by using the CaO–SiO2–FetO phase diagram shown in Fig. 8. In Fig. 8, (%CaO)sat. can be obtained by finding the intersection bewteen the lines. In Fig. 8, one line is produced by joining the bulk slag composition (Fig. 8①) and the vertex of CaO, and the other line is the CaO saturated liquidus line (Fig. 8②). In their study, the precipitated solid phase can be ignored since the aimed slag basicities are 0.6 and 1.0. However, in actual hot metal dephosphorization, the solid phase cannot be ignored as the slag basicity is higher than those in their study. Hence, the change of (%CaO)liquid is evaluated by expanding their approach as shown in Eq. (4). Here, the driving force of CaO dissolution (Δ(%CaO)) and (%CaO)liquid are defined by Eqs. (5) and (6), respectively.
| (4) |
| (5) |
| (6) |

Calculation of (%CaO)sat. without 2CS crystallization.

Calculation of (%CaO)sat with 2CS crystallization.
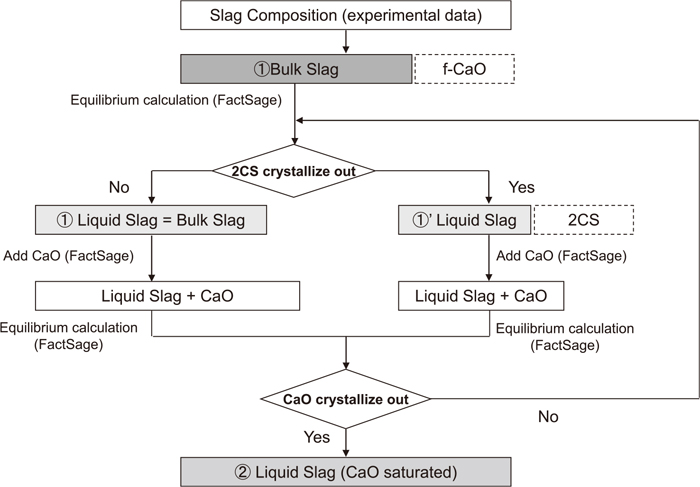
Procedure for calculation of liquid and CaO saturated slag composition.
The relationship between the observed slag basicity and (%CaO)sat. is shown in Fig. 11. (%CaO)sat. is obtained by an equilibrium calculation in a CaO–SiO2–FeO–Fe2O3–Al2O3–P2O5–MgO–MnO system considering 2CS(-3CP) precipitation. The observed slag basicity is calculated by Eq. (3). In Fig. 11, the observed slag basicity changes from lower to higher slag basicity as CaO dissolution progresses with time. The 2CS(-3CP) phase precipitates under the condition that the observed slag basicity is higher than 1.2. The obtained (%CaO)sat. is in the range between 40 and 60%. (%CaO)sat. of the liquid slag tends to be lower with higher observed slag basicity. Moreover, the values of (%CaO)sat. at lower aimed slag basicities between 0.5 and 1.0 are higher than those at higher aimed slag basicities of 2.0 to 3.5. This is caused by the change in the liquid slag composition as the reduction rate of the added iron ore changes. The relationship between the observed slag basicity and Δ(%CaO) is shown in Fig. 12. Here, Δ(%CaO) is calculated by Eq. (5). Δ(%CaO) tends to decrease as the observed slag basicity increases, but stagnates due to 2CS(-3CP) precipitation. This is caused by the difference between the liquidus lines at the higher and the lower CaO side of the 2CS saturation region, as shown in Fig. 9.

Variation of (%CaO)sat. with observed basicity.

Variation of Δ(%CaO) with observed basicity.
Equation (7) is obtained by integrating both sides of Eq. (4).
| (7) |

Relationship between time and value of left side of Eq. (7).
The mass transfer rate of CaO is discussed in order to understand the physical meaning of Kcao. The relationship between Kcao and the mass transfer rate is defined as show in Eq. (8). Here, Vbulk slag (m3) is the total slag volume combining the solid and liquid volumes, and Af-cao (m2) is the sum of the surface area of f-CaO. The mass transfer rate of CaO in the liquid slag, kcao (cm/s), can be ontained by Eq. (9), which is obtained by deforming Eq. (8).
| (8) |
| (9) |
Here, the undissolved CaO is defined as a sphere of uniform size, and the slag volume, Vbulk slah (m3), and the sum of the surface area of f-CaO, Af-cao (m2), are calculated by Eqs. (10) and (15), respectively.
| (10) |
| (11) |
| (12) |
| (13) |
| (14) |
| (15) |
Here, Ws is the total weight of the slag (kg), Wm is the weight of the hot metal (60 kg), ρs is the density of the liquid slag (3460 kg/m3),14) Vf-cao is the volume of f-CaO (m3), Wf-cao is the weight of f-CaO (kg), ρf-cao is the density of f-CaO (3346 kg/m3),12,13) r is the radius of f-CaO (m), and n is the number of free-CaO particles.
An example of a slag sample obtained during the experiment is shown in Fig. 14. The observed f-CaO particles in the slag are larger than 0.1 mm, which is the size of the added CaO. This is attributed to aggregation of CaO particles during the experiments. The size of the aggregated CaO in the slag is not constant. Therefore, the maximum diameter of the added CaO, 0.1 mm is defined as the CaO size, and the radius of CaO, r=5×10⁻⁵ (m) is used in the calculations.

Photograph of f-CaO observed in slag.
The relationship between the aimed slag basicity and kcao is shown in Fig. 15. The data reported by Matsushima et al.6) and Hamano et al.15) are also shown in Fig. 15. The kcao values obtained in this work are smaller than those in their reports.6,15) In the report by Matsushima et al.6) kcao was obtained by the rate of decrease of the radius of a CaO cylinder submerged and rotated in liquid slag, and the rate of decrease, dR/dt (cm/s) was evaluated by Eq. (16).
| (16) |

Mass transfer coefficient of CaO calculated at each aimed basicity.
Here, R is radius of the CaO cylinder (cm). In the present work, the slag is located on hot metal stirred by bottom-blowing gas, so the stirring condition of the slag is weak compared to that in Matsushima et al.6) The obtained kcao values when the slag basicity is around 1.0 are nearly the same as those reported by Matsushima et al.6) In this case, CaO dissolution proceeded to around 100%. Therefore, the obtained data are relatively consistent with the values in the previous reports, even when the added CaO is completely dissolved. In the case of higher slag basicities of more than 1.5, kcao tends to decrease with increasing slag basicity, and kcao was one order smaller than those in the lower slag basicity region smaller than 1.0.
Since differences in the properties of slag correponding to slag basicity are considered to affect kcao, the following discussion focuses on the viscosity of slag.
4.4. Effect of Slag Viscosity on kcaoAs indicated in 4.1, an equilibrium calculation was conducted based on the obtained slag composition excluding the f-CaO and precipitated solid phases at 1623 K. The relationship between the slag viscosity, η0 (Pa·s) at 1623 K calculated by Factsage and kcao categorized by the voluume fraction of the solid phase is shown in Fig. 16. The volume fraction of the solid phase, φ (-), is defined as shown in Eq. (17).
| (17) |

Influence of slag viscosity (liquid) on mass transfer coefficient of CaO.
Here, the contents in Eq. (17) are all weight percent, ρ2cs is the density of 2CS (3300 kg/m3),12,13) and ρ2cs-3cp is the density of 2CS-3CP (3195 kg/m3).12,13) As shown in Fig. 16, kcao decreased slightly with increasing slag viscosity at the same volume fraction. This is attributed to a decreasing diffusion rate of CaO in slag with increasing slag viscosity. On the other hand, kcao is small under the condition of a high volume fraction of solid phase, even when the viscosity of the liquid slag is the same. Therefore, the effect of the solid phase in slag on the slag viscosity will be discussed as follows.
The viscosity of a suspension of a solid and liquid mixture has been widely studied in the field of chemical engineering.16,17) The slag in this work can be assumed as a suspension of a solid and liquid mixture. In the case of dilute suspension (solid ratio <2%), the effect of the solid phase on viscosity can be evaluated by Einstein’s equation, shown here as Eq. (18).
| (18) |
Here, ηr (-) is relative viscosity, and η (Pa·s) is the viscosity of the supension.
In this work, the solid fraction is larger than 2%, and in this case, the slag viscosity can be estimated by the Mori and Ototake17) Eq. (19), which was expanded to the higher solid fraction.
| (19) |
| (20) |
Accordingly, in this work, the viscosity of the solid and liquid phase mixture was evaluated for solid fractions smaller than 52%. The calculation results are shown in Fig. 17. Equation (18) is used in case φ is smaller than 2%, and Eq. (20) is used in case φ is between 2 and 52%. The horizontal axis of Fig. 17 is the mass transfer rate of CaO in slag calculated by Eq. (9). kcao decreased with increasing slag viscosity considering the effect of the solid fraction. kcao decreased remarkably under the condition that the slag viscosity was in the range between 0.05 and 0.25 Pa·s, and shifted to the order of 10−5 cm/s at slag viscosities higher than 0.25 Pa·s.

Influence of slag viscosity (solid-liquid coexistent) on mass transfer coefficient of CaO.
In this work, the CaO dissolution rate is high, but the hot metal dephosphorization rate is low when the slag basicity is smaller than 1.0. On the other hand, the hot metal dephosphorization rate decreased with increasing CaO addition at higher slag basicities larger than 1.0. In this case, in addition to a smaller driving force of CaO dissolution into the liquid slag, Δ(%CaO), the slag viscosity also becomes higher overall due to the presence of solid phases such as f-CaO and 2CS(-3CP), and this higher viscosity prevents both mass transfer of CaO in the liquid slag and CaO dissolution. Therefore, under a condition of higher slag basicity, it is important to control the slag composition to the lower SiO2 and higher FeO region before CaO addition, and strong stirring is effective for CaO dissolution. Moreover, the existence of an optimum slag basicity for obtaining higher CaO efficiency for dephosphorization and increasing the dephosphorization rate was also suggested. Further investigation is needed, including clarification of the oxygen supply by oxygen gas, the change in the melting point by iron oxide addition, and stirring by the decarburization reaction. Futhermore, an investigation of the effect of the size of CaO on its dissolution rate through larger scale experiments is also necessary.
The effect of the CaO dissolution rate on hot metal dephosphorization was investigated in small–scale experiments. The conclusions are as follows,
(1) The dephosphorization rate at 1623 K showed higher values at basicities of 0.5 to 1.0. At basicity higher than 1.0, the dephosphorization rate decreased due to poor CaO dissolution in the flux.
(2) The free CaO (f-CaO: undissolved CaO) content in the slag increased with increasing slag basicity. The saturated CaO content in slag, (%CaO)sat., obtained by a thermodynamic calculation for 2CaO·SiO2(-3CaO·P2O5) precipitation decreased with increasing slag basicity.
(3) The total reaction rate constant of CaO dissolution and the mass transfer coefficient of CaO in slag was calculated from the f-CaO content and (%CaO)sat. obtained by a thermodynamic calculation. The obtained kcao was substantially the same as that in the previous reports at the aimed basicity of around 1.0, which is the condition of a higher liquid fraction.
(4) Higher kcao was obtained by a smaller liquid slag viscosity in the case of a lower solid fraction of slag. In the case of a higher solid fraction of slag, kcao decreased as the solid fraction increased, even at the same liquid slag viscosity. The stirring energy acting on slag is decreased by the solid fraction. These results suggest the existence of an optimum basicity for higher CaO efficiency and an increased dephosphorization rate.
Af-CaO: Sum of surface area of free-CaO (m2)
(%CaO): Total CaO content in slag (wt%)
(%CaO)liquid: CaO content in liquid slag (wt%)
(%CaO)2CS-3CP: CaO content in 2CS-3CP (wt%)
(%CaO)sat.: Saturated CaO content in liquid slag (wt%)
C/Saimed: Aimed basicity (-)
d: Average diameter of suspended particles (m)
f-CaO: Free CaO (undissolved CaO in slag)
(%f-CaO): Free CaO content in slag (wt%)
kCaO: Mass transfer rate (cm/s)
KCaO: Total reaction rate constant (1/min)
n: Number of free CaO particles (N)
[%P]: Phosphorus content in hot metal (wt%)
R: Radius of CaO cylinder (cm)
Sr: Specific surface area of particles in a unit volume (m2)
t: Time (min)
Vbulk_slag: Total slag volume (m3)
Vf-CaO: Free CaO volume (m3)
Vm: Hot metal volume (m3)
Wf-CaO: Free CaO weight (kg)
Wm: Hot metal weight (kg)
Ws: Slag weight (kg)
η: Viscosity of suspension (Pa·s)
η0: Viscosity of liquid slag (Pa·s)
ηr: Relative viscosity (-)
ρ2CS: Density of 2CS phase (kg/m3)
ρ2CS-3CP: Density of 2CS-3CP phase (kg/m3)
ρf-CaO: Density of CaO (kg/m3)
ρs: Density of liquid slag (kg/m3)
φ: Volume fraction of solid phase (-)
φvc: Limit volume concentration (-)