Ironmaking
Effect of Large Amount of Co-injected Gaseous Reducing Agent on Combustibility of Pulverized Coal Analyzed with Non-Contact Measurement
2020 Volume 60 Issue 8 Pages 1662-1668
Details
2020 Volume 60 Issue 8 Pages 1662-1668
Nowadays, reduction of amounts of CO2 from ironmaking process is important from the aspect of prevention of the global warming. COURSE50 is Japanese national project which aims to reduce the amount of CO2 emission from ironmaking process by 30% by 2050. In COURSE50, we try to reduce iron oxide with H2 to decrease amounts of carbon use, by injecting large amount of gas containing H2 and pulverized coal (PC) from tuyere. In that case, PC combustibility can be different from that in general blast furnace condition, due to high co-injected reducing gas ratio. Though a large number of researches about PC combustion around tuyere of blast furnace has been carried out, the effect of large amounts of co-injected reducing gas on PC combustibility was hardly investigated. To evaluate that, we conducted experiments with two experimental furnaces equipped with various non-contact measurement apparatus and found that;
1) The larger amounts of co-injected reducing gas were, the faster O2 and CO2 consumption, and CO and H2 generation in the raceway.
2) The amounts of co-injected reducing gas should be optimized for higher PC combustibility.
3) Co-injected reducing gas activated PC combustion by raising PC temperature, and that resulted in acceleration of PC.
4) Trade-off relationship between rapid heating effect and O2 consumption of co-injected reducing gas could determine the optimum amounts of reducing gas.
Consequently, we elucidated how we could co-inject reducing gas with PC as reducing agents without deteriorating PC combustibility.
In recent years, every industry in the world has been strongly urged to address the issue of global warming. In particular, in our country, where CO2 emissions from the steel industry account for about 14% of the national total, reduction of CO2 emissions is an urgent task.1) Therefore, Japanese steelmakers have launched and been working on a national project called “COURSE50 (CO2 Ultimate Reduction System for Cool Earth 50)”, to reduce CO2 emissions from steel works, especially from ironmaking process.2,3,4) In this project, we have been developing a technology to inject a large amount of gaseous reducing agents (RA) containing hydrogen into a blast furnace from tuyeres as alternative RA to coke, in order to reduce CO2 emissions from the blast furnace by utilizing reduction with hydrogen.3)
Before the oil shock in 1970s, heavy oil was mainly injected as alternative reducing agent into tuyeres of blast furnaces in order to reduce the coke rate. After the oil shock, however, steelmakers replaced the soaring heavy oil with pulverized coal (PC).5) In the case of PC injection (PCI) into blast furnaces, the combustion conditions change in the region near the tuyere called raceway. Therefore, many studies have been conducted to clarify the effects of PCI on blast furnace operations.6)
In addition, preventing unburned char of PC from accumulating in blast furnace is important to keep gas permeability in blast furnaces. Therefore, a lot of studies have also been carried out to enhance PC combustibility. Examples include co-injection of PC with different VM content,7) co-injection of PC and O2,8,9) or gaseous RA.10,11) However, co-injection of large amounts of PC and gaseous RA as attempted in condition of the COURSE50 blast furnace has rarely been studied.
There have also been many reports that try to enhance PC dispersibility with adjusting the number, position, and shape of injection lances, to increase PC combustibility.8,12,13,14) The mechanical parameters related to the PC dispersibility such as velocity have been measured in other fields with using laser measurement.15,16) On the other hand, there are some studies analyzing PC dispersibility with numerical methods8,9) or analysis of photograph of experimental combustion field,13) but there are few studies in which the mechanical parameters of PC particles are actually measured.
From these background, we prepared two furnaces simulating area around tuyere of blast furnaces and conducted two combustion experiments under the conditions of unprecedented high PC rate and high gaseous RA rate, such as 150 kg/tHM in PC rate and 95 Nm3/tHM in gaseous RA rate. Through the first experiment, the effect of the ultra-high gas RA rate condition on PC combustibility was evaluated. In addition, the origin of this effect was analyzed through the second experiment with the other experimental furnace.
Figure 1 shows a schematic diagram of one of the experimental furnaces. The experimental furnace imitated a tuyere of blast furnaces and mainly consists of feeders for coke, PC and gaseous RA, an injection lance, LPG burner and coke packed bed. Hot blast with particular flow rate and temperature was generated in the LPG burner, and blown into the coke packed bed through the tuyere under the experiment. Coke was charged from the feeder placed at the top of the coke packed bed. Then, we injected PC and gaseous RA into the furnace from the lance which was inserted at just upstream side of the tuyere, and evaluated the combustion behavior of injectant and coke.

A schematic diagram of one of the experimental furnaces.
Table 1 shows experimental conditions. We carried out the experiment under four conditions; Case0 without injectant, Case1 with only PC injection, and Case2 and 3 with co-injection of PC and gaseous RA. Contents of blast O2 in Case1, 2 and 3 were determined to maintain the production of iron and theoretical flame temperature (TTF) in operational blast furnace. That in Case0 was set to the same condition as Case1 to clarify the effect of PC injection on reaction in the raceway. We have to mention that TTF in each case did not show the same value in this experiment, because of using LPG burner to generate blast. Apart from hot stove in operational blast furnace, the experimental LPG burner inevitably generates CO2 and H2O, and they lower TTF by endothermic reactions with coke. Contents of CO2 and H2O in the blast were different among 3 cases because the different amounts of LPG were used, so TTF among 3 cases did not show the same value.
| Unit | Case0 | Case1 | Case2 | Case3 | |
|---|---|---|---|---|---|
| Blast volume | Nm3/h | 270 | 270 | 210 | 150 |
| Blast temp. | K | 1273 | 1273 | 1273 | 1273 |
| BlastO2 | % | 27 | 27 | 37 | 49 |
| PC | kg/h | 0 | 35 | 35 | 35 |
| PC carrier (N2) | Nm3/h | 15 | 15 | 15 | 15 |
| Lance gas | – | N2 | N2 | COG | COG + BFG’ |
| Nm3/h | 10 | 10 | 22 | 60 |
Figure 2 shows a cross-sectional view of the lance used for the injection of PC and gaseous RA, and which part of the lance PC and gaseous RA were injected. We used a co-axial triple pipe which PC and N2 as carrier gas were injected from Pipe A and gaseous RA was injected from the gap between Pipe B and C. Coolant N2 was passed through the gap between Pipe A and B, and also through that between Pipe B and C in Case1, in which we didn’t inject gaseous RA. We used different types of the lances in the different cases, to maintain velocity of the gas passed through the lance for preventing the lance from melting down.

A cross-sectional view of the lance used for the injection of PC and gaseous RA.
Size and proximate analysis of coke and PC are given in Table 2. Compositions of the gaseous RAs are given in Table 3. We used a mixed gas imitating coke oven gas (COG) in Case2, and a mixed gas imitating a mixture of a reformed blast furnace gas (BFG’) and COG in Case3 as the gaseous RAs. The BFG’ means blast furnace gas which CO2 was removed.
| Unit | Coke | PC | |
|---|---|---|---|
| Size | – | 15–25 mm | −74 μm 80% |
| Fixed Carbon | wt% | 87.3 | 80.6 |
| Volatile matter | wt% | 0.7 | 11.4 |
| Ash | wt% | 12.0 | 8.0 |
| Unit | COG | COG + BFG’ | |
|---|---|---|---|
| CH4 | vol% | 37 | 14 |
| CO | vol% | 12 | 33 |
| H2 | vol% | 48 | 26 |
| N2 | vol% | 3 | 27 |
We measured coke consumption rate, temperature and gas distribution inside the furnace with following methods. We measured coke consumption rate by measuring the coke charging rate with keeping charged level of the packed cokes in the furnace constant. It was because of difficulty in measuring weight of cokes inside the furnace directly. We used a sounding device installed on the top of the coke packed bed to measure the level. Through the same experimental condition, we kept the level of the packed cokes. We measured the distribution of temperature and gas composition in the furnace with inserting a sonde into the furnace. The sonde was inserted from the hole on the opposite side of the tuyere, and the distribution of temperature and gas composition in the furnace along with the distance from the tuyere tip was measured.
2.2. Results and DiscussionsFigure 3 shows the effect of co-injection on temperature and gas distribution along with the distance from the tuyere tip in the packed bed. The position with the highest CO2 concentration is called as the combustion focus.11,17) The distance from the tuyere tip to the combustion focus was 200 mm in Case1, while it was 150 mm in Case2 and 3. The distance became shorter due to the co-injection of gaseous RA. As in the previous study,17) these results were caused by the acceleration of O2 consumption due to the increase in the amount of RA injected from tuyeres. In Case3, the amount of injected gaseous RA was so large that O2 had been already consumed before it reached in the raceway. TTF in each case is also shown in Fig. 3. TTF was calculated by considering balance between input heat and sensible heat of bosh gas at TTF. The input heat consisted of combustion heat of cokes and injected RA, and the sensible heat of blast, injectants and cokes. Temperature of cokes entering into the raceway (Tcoke) was premised as shown below, according to Ramm’s assumption.18)
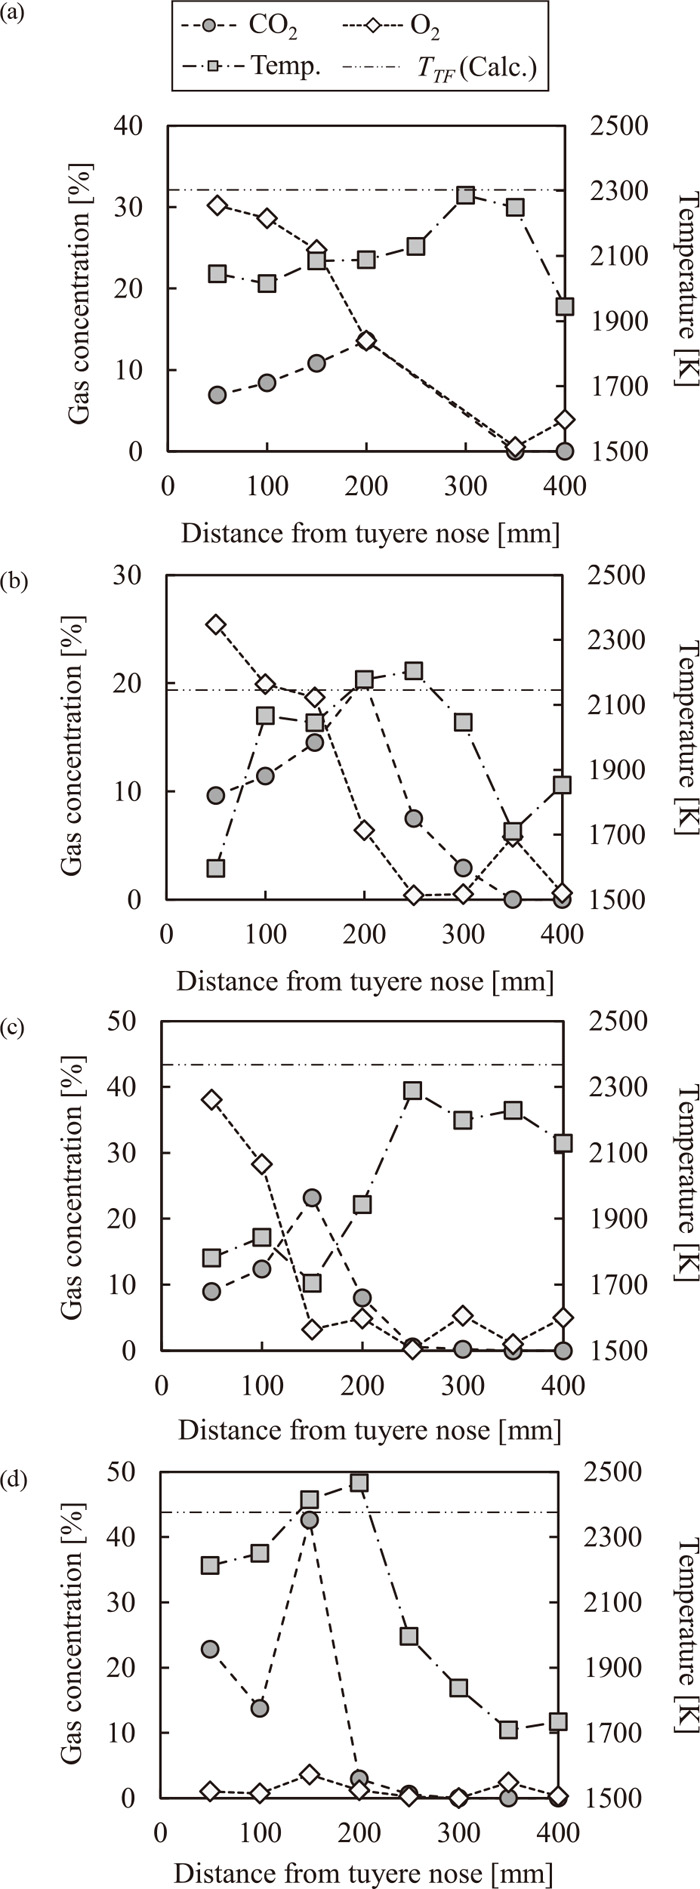
(a)–(d) Effect of co-injection on temperature and gas distribution along with the distance from the tuyere tip in the packed bed, (a) Case0, (b) Case1, (c) Case2, (d) Case3.
Next, we calculated PC combustibility (ηPC) in each case to examine the effect of co-injection on ηPC. Figure 4 shows a schematic diagram of the calculation method for ηPC. We measured the difference in coke consumption between condition with and without injection of RA in each case. We defined the difference as coke consumption, and converted the coke consumption into the carbon equivalent reduction amount Call from the carbon content of coke. Then we calculated reduction of coke consumption by gaseous RA, Cgas, by assuming that all gaseous RA reacted with O2 before coke. We calculated the amount of reduction in coke consumption by PC, CPC, by subtracting Cgas from Call. We defined the ratio of CPC to the carbon equivalent of injected PC, MPC, as ηPC. The calculation of ηPC is summarized as following Eq. (1).
| (1) |

A schematic diagram of the calculation method for ηPC.
Figure 5 shows ηPC in each case. ηPC in Case2 was higher than that in Case1, in which only pulverized coal was injected. From this result, We found that ηPC was improved by the injection of gaseous RA. However, ηPC reached the maximum in Case2 and it decreased in Case3, comparing to not only in Case2 but also in Case1. This result suggested that the optimum composition and amount of gaseous RA to maximize ηPC would exist. Characteristics of PC can also affect the optimum condition for injection of gaseous RA. We assume that PC with smaller volatile matter content will need more help of gaseous injection, because of its low combustibility.7) To determine the optimum condition for each coal, further investigation is needed.

ηPC in each case.
Figure 6 shows a schematic diagram of the other experimental furnace. The furnace has cylindrical shape and is composed of equipment for supplying PC and gaseous RA, injection lances, an LPG burner, and a blow pipe. Hot blast was generated in the LPG burner. PC and gaseous RA were injected into the hot blast from the lances installed downstream of the LPG burner and burned in the blow pipe. The furnace has three windows both on the top and side of the blow pipe. The top windows are for the laser injection used for the velocity measurement described later. The side windows are for observation of in-furnace phenomenon.

A schematic diagram of the other experimental furnace.
Table 4 shows the experimental conditions. We conducted the experiment in three cases. Conditions in Case4, 5 and 6 were respectively based on those in Case1, 2 and 3 mentioned in previous chapter. Only pulverized coal was injected in Case4. On the other hand, gaseous RA was co-injected with PC in Case5 and 6.
| Unit | Case4 | Case5 | Case6 | |
|---|---|---|---|---|
| Blast volume | Nm3/h | 270 | 210 | 150 |
| Blast temp. | K | 1473 | 1473 | 1473 |
| Blast O2 | % | 27 | 34 | 49 |
| PC | kg/h | 35 | 35 | 35 |
| PC carrier (N2) | Nm3/h | 15 | 15 | 15 |
| Lance gas | – | N2 | COG | COG + BFG’ |
| Nm3/h | 10 | 22 | 60 |
We used the same lances for injection of PC and gaseous RA. We also injected the same way in Chapter 2, as shown in Fig. 2. The characteristics of PC and gaseous RA used in the experiments are also the same as those in Chapter 2 and are shown in Tables 2, 3.
In each cases, we measured velocity of PC particles by particle image velocimetry (PIV), and temperature of PC particles by bicolor radiation thermometer. Figure 7 shows an schematic diagram of PIV measurement. Instruments for PIV was composed of laser and hi-speed camera. We injected a laser which wavelength was 532 nm from the top windows into the blow pipe, and the laser scattered by PC particles was photographed by the hi-speed camera. In order to observe the cross-section of PC particles flow, we injected the sheet-shaped laser so as to pass through the center axis of the blow pipe. We equipped hi-speed camera with a filter that only transmitted 532 nm light in order to prevent radiant light of refractory in the blow pipe from entering into the camera. In this way, we were able to take images of PC particles without the effect of the radiation. We calculate the velocity of PC particle with the change with time of the position of PC particles by analyzing the series of images of PC particles. We defined temperature of PC particles as the average temperature of those measured for 30 seconds, in order to remove the effect of fluctuation of PC flow on temperature of PC particles.

A schematic diagram of PIV measurement.
Figure 8 shows an example of the measurement results of velocity of PC particles by PIV. Thus, PIV measurements provide a two-dimensional distribution of velocities of PC particles. As shown in Fig. 6, the experimental furnace has a structure in which the flow path is narrowed at the tuyeres inside the furnace. It means that velocity of the blast in the furnace was locally increased at the tuyere. Further, since each case had different blast volume, the velocity of the blast varied depending on the case, and the velocity of PC particles also changed accordingly.

An example of the measurement results of velocity of PC particles by PIV.
Therefore, we corrected the measurement results of velocity of PC particles by PIV with considering the effect of the increase in blast velocity at the tuyere and the difference in blast volume in each case on the velocities of PC particles. We defined the relative velocity as the PC particles velocity divided by the blast velocity, and used the relative velocity to evaluate the combustion behavior of PC. We calculated the blast velocity by dividing the blast volume by the jet cross-sectional area, which was assumed to be a circle with diameter r. We calculated r by using the distance from the lance tip, d, and the spreading angle of PC flow, θ, as shown in Eq. (2).
| (2) |

A schematic diagram of the calculation method for θ.
Figure 10 shows the effect of the injection of PC and gaseous RA on the spreading angle θ at 200 mm from the lance tips. θ increased in Case5 and 6 in comparison with Case4. This result suggested that the dispersibility of PC in the vicinity of lances was improved by the co-injection of the gaseous RA. This phenomena was caused by the rapid increase of gas temperature due to the early combustion of the gaseous RA. The gas volume was increased by increase of gas temperature, and the radial component of the velocity of PC particles accelerated. Figure 11 shows the change of θ with respect to the distance from the lance tips in each case. At a position of 400 mm from the lance tip, θ decreased to less than half of that at a position of 200 mm, and became almost 0 at a position of 600 mm. This result indicates that the jet diameter r almost reached the diameter of the blow pipe, 100 mm, at a position 400 mm from the lance tips. Taking this result into account, we used θ at 200 mm from the lance tips to calculate the relative velocity of PC particles in each case.

Effect of the injection of PC and gaseous RA on the spreading angle θ at 200 mm from the lance tips.

Change of θ with respect to the distance from the lance tips in each case.
Figure 12 shows the effect of the co-injection of gaseous RA on the relative velocities of PC particles. The relative velocities were higher than 1.0 in all cases. This result suggested the acceleration of gases and particles by combustion of the co-injected gaseous RA. In addition, the particle decelerated in the area from 400 to 600 mm from the lance tips in Case4, while those in Case5 and 6 accelerated. It was considered that the particle velocity increased due to expansion of the gas volume with gas generation and temperature increase. Therefore, this result suggests the activation of combustion reaction with the co-injection of gaseous RA. We presumed that the reason why the relative velocity in Case6 was higher than that in Case5 was that the ratio of amount of the gaseous RA to the blast volume was larger in Case6 than that in Case5. The decrease in the particle velocity in Case4 will be caused by the decrease in the gas volume in the furnace. It can be because the heat loss by coolant of furnace and purged N2 was larger than the heat generated by the combustion reaction of PC.

Effect of the co-injection of gaseous RA on the relative velocities of PC particles.
Figure 13 shows the effect of the co-injection of gaseous RA on the temperature of PC. The PC particle temperature in Case4 was kept below 1000°C, while those in Case5 and 6 rose to around 2000°C. This was because the gaseous RA was blown into the blast, burned ahead of PC, and heated PC in Case5 and 6. In comparison with Case5 and Case6, the PC particle temperature in Case6 was almost the same as that in Case5, although the amount of co-injected gaseous RA was larger in Case6 than in Case5.

Effect of the co-injection of gaseous RA on the temperature of PC.
From the results described in the previous section, we found that co-injection of a unprecedentedly large amount of gaseous RA under COURSE50 conditions has two key effects on PC combustion behavior: improvement of the dispersibility of PC particles and rapid heatiing. It has been reported in the study that improvement of PC dispersibility enhances PC combustibility.13) There have been many studies that reads that acceleration of heating of PC particles improves PC combustibility.10,11)
On the other hand, it is also true that O2 required for combustion of PC is consumed in the combustion of the gaseous RA by co-injection of the gaseous RA. If O2 consumption become excessive due to the co-injection of a large amount of gaseous RA, combustion of PC may be inhibited.
Then, we evaluated the effect of composition and flow rate of co-injected gaseous RA on PC combustibility. Figure 14 shows the effect of oxygen consumption of gaseous RA on PC combustibility in Case1–3. Under the condition with appropriate amount of co-injected gaseous RA, the amount of O2 consumption by the gaseous RA is small and PC combustibility will be improved by PC heating effect due to combustion of the gaseous RA. However, as shown in Fig. 13, the heating effect of gas co-injection on PC saturated as the co-injection amount increases. On the other hand, O2 concentration around PC will decrease since the O2 consumption by increase of gaseous RA, and then PC combustibility will drop. From all results above, we concluded that the optimum rate of co-injected gaseous RA should existed. The quantitative evaluation of the optimum amount of gaseous RA will be studied in the future.

Effect of oxygen consumption of gaseous RA on ηPC.
In this study, we evaluated the effect of gaseous RA co-injection in the COURSE50 blast furnace on PC combustion behavior through the experiment under the condition of unprecedentedly high PC and gaseous RA rate. We also studied the cause of this effect through the experiment in the superficial combustion furnace. As a result, we found the followings.
(1) The combustion focus approached the tuyere as the co-injection amount of the gaseous RA increased. There will be the optimum value of the amount of co-injected gaseous RA to maximize PC combustibility.
(2) The combustion reaction was activated by increasing the amount of gaseous RA co-injection from the viewpoint of motion and temperature of PC particles. The increase in temperature of PC particles was saturated at the particular amount of co-injected gaseous RA.
(3) The effect of increasing the combustibility by rapid heating and dispersion of PC particles, and the effect of decreasing the combustibility by consumption of O2 accompanying the combustion of the co-injected gaseous RA were in a trade-off relationship. This relationship should determine the optimum value of the co-injection amount of gaseous RA to maximize PC combustibility.
This study has been carried out as the national contract research project named ‘‘CO2 Ultimate Reduction System for Cool Earth 50 ‘COURSE50’’’ by the New Energy and Industrial Technology Development Organization (NEDO). The authors are grateful to NEDO for their assistance.