Ironmaking
Structural Analysis of Primary Coal Tar by FD-MS
2020 Volume 60 Issue 9 Pages 1892-1901
Details
2020 Volume 60 Issue 9 Pages 1892-1901
Understanding chemical structure of primary coal tar is substantially important to promote advanced application and utilization of coal where chemical reaction plays a key role. Mass spectrometry allows us to characterize complex mixture like coal tar pitch, coal extractions, and heavy oil. In the present study, two kinds of primary coal tar A and B were prepared from different types of coal A (bituminous coal) and B (subbituminous coal). The main components such as Hexane Soluble (HS) and Hexane Insoluble-Toluene Soluble (HI-TS) fractions obtained by extraction of each tar were measured by Field Desorption Mass Spectrometry (FD-MS) to determine their constituent chemical structures. The 1H NMR spectra of HS and HI-TS were measured to confirm the reliability of proportion of hydrogen types that have been determined by FD-MS. As a result, both of the proportions in HS fractions were found to be almost consistent, while those in HI-TS fractions show a difference because of their more complex chemical components than HS fractions. Based on the combined analysis of FD-MS and NMR, we concluded that the HS in primary coal tar A mainly consists of polycyclic aromatic hydrocarbons (PAHs) and aliphatic structures including aromatic carbons, while the HS in primary coal tar B mainly consists of aliphatic structures. These results suggest that determining chemical structures and their ratios only from FD-MS spectra is useful to concretely clarify difference between some types of primary coal tar.
Coal tar is a by-product of the coking process and has a wide variety of applications such as a raw material1) for carbon electrodes and a binder2) for improving the expansibility of coal. Furthermore, high value-added carbon fibers have also been made from coal tar.3) Since the property of these materials and the performance of binders are considered to be affected by the chemical structure of coal tar, obtaining the chemical structure of coal tar is important to enhance the utilization of coal tar. In addition, as seen from the bituminous coal model of Shinn4) and the pyrolysis model of Solomon,5) coal tar is a part of the molecular structure of coal. Structural analysis of coal tar, therefore, is an important piece of research leading to the structural elucidation6) of coal. Iino et al.7) reported solvents that dissolve nearly 78% of coal at room temperature. With the acceleration of this type of research, Hama et al.8) analyzed detail structures of pyrolysis products of solvent-extracted components of coals with different values of elemental and proximate analysis values. As described above, analyzing chemical structure of complex organic materials, such as coal tar and other coal extracts, petroleum-based heavy oils, shale oil, and other natural asphaltenes has been widely performed. Especially, the analytical methods of Brown and Ladner9) and of van Krevelen and Chermin10) are still basic methods of chemical structure analysis. More improved protocols11,12) can be used to determine the mean chemical structure of coal tar from elemental analysis values, 1H nuclear magnetic resonance (NMR) spectra, and mean molecular weights. Although the above natural asphaltenes, heterogeneous multicomponent mixtures, show large distribution of molecular weight, the mean molecular weight is still used to determine their mean chemical structure. There is, therefore, no guarantee that components with the determined chemical structure occur in the samples.
Mass spectrometry can be applied to samples of such multicomponent mixtures as natural asphaltenes to determine the mass number of their individual components. It is thus a promising method for analyzing the chemical structure of heavy oil and other multicomponent mixture samples.13) Since mass spectra are derived from compounds with different mass numbers, they provide very important information to identify the structure of multicomponent mixtures. Among mass spectrometric methods, the field desorption (FD) method14) is an ionization method considered to be effective for multicomponent mixtures. The FD method makes it more difficult for molecular fragmentation to occur than the electron impact (EI) method and is free from the effect of matrix on ionization efficiency unlike the matrix-assisted laser desorption ionization (MALDI) method. The FD method is thus considered to be effective for the ionization of mixture samples. With the FD method, a sample is coated onto a metal emitter with carbon micro needles attached to the surface. When voltage is applied to the emitter surface activated by the micro needles, a very high voltage gradient develops and deprives the sample of electrons. The resultant cations emanate from the emitter. Since the generated ions have no surplus energy, fragmentation is unlikely to occur15,16) This soft ionization is characteristic of the FD method. In most cases, molecular ions M+ can be obtained.
Taka et al.17,18) analyzed coal tar by field desorption-mass spectrometry (FD-MS). They estimated the structure of the entire sample by focusing on the mass number differences of obtained mass spectra and showed that the structure agreed with that estimated by conventional mean structure analysis. The number of components that should be considered to reflect the overall mean structure in the peaks of obtained mass spectra still remains unstudied. However, in recent years, mass spectrometers have dramatically improved in mass resolution and have presented the possibility of determining the chemical structure of hitherto unobservable components.
Considering the above mentioned background, in this study, we analyzed the structure of coal tars by FD-MS. The coal tars used in this study were obtained with secondary pyrolysis reactions suppressed in a test carbonization furnace. The obtained coal tars are parts of the coal structures and are considered to reflect the molecular structure of the coals if their secondary pyrolysis reactions are suppressed. The chemical structure of the raw material coals is expected to be reflected in the chemical structure of primary coal tars before the secondary pyrolysis reactions. We used the coal tars produced from two types of coals with different elemental and proximate analysis values as primary coal tar samples, and studied the chemical structure differences of the primary coal tar samples by analyzing the mass spectra obtained by FD-MS. We furthermore measured the liquid state 1H NMR spectra of extracts to verify the validity of the analytical method of FD-MS spectra.
Table 1 shows the elemental analysis, proximate analysis and carbon aromaticity value fa (ratio of aromatic carbons to total carbons) of the bituminous and the subbituminous coals used as raw material coals. (The bituminous and the subbituminous coal are hereinafter referred to as coal A and B, respectively.). These coals were prepared to achieve a moisture content of 6% and a particle size of 3 mm or less. The test furnace used to produce the primary coal tars is schematically illustrated in Fig. 1. The carbonization furnace was preheated to 500°C, charged with 2.0 kg of coal, and purged with argon gas flowing at a rate of 1.0 L/min. The coal packing density was about 0.76 g/cm3. The coal charged into the 500°C carbonization furnace is presumed to have been rapidly heated from room temperature to 500°C. The coal was then heated to 1000°C at 3°C/min and held at the temperature. A heater was installed in the upper part (about φ150 mm) of the coal packing column to prevent the generated primary coal tar from being cooled as it passed through the guide tube. To prevent the formed primary coal tar from being subjected to secondary pyrolysis, the temperature of the top heater was maintained at 350°C from the start to the end of the reaction. These primary coal tars were collected in four collection bottles connected in series and filled with cooling water. After the end of carbonization, the primary coal tar was separated by specific gravity from the cooling water and recovered. Although some primary coal tar deposited on the guide tube and connecting tubes, only the primary coal tar collected with the four collection bottles was used for the FD-MS and 1H NMR analysis.
| Coal | Ultimate Analysis (d. a. f. mass%) | VM | Ash | fa | ||||
|---|---|---|---|---|---|---|---|---|
| C | H | N | Odir | S | ||||
| A | 87.7 | 4.9 | 1.9 | 4.9 | 0.6 | 23.5 | 9.5 | 0.80 |
| B | 69.3 | 4.9 | 1.0 | 24.6 | 0.2 | 48.4 | 2.9 | 0.61 |
d. a. f.: dry ash free base

Schematic explanation for preparation of primary coal tar. (Online version in color.)
Primary coal tars produced from coal A and B are hereinafter referred to as tar A and B, respectively. As shown in Fig. 2, tar A and B were each fractionated with three solvents (hexane, toluene and tetrahydrofuran (THF)) into hexane soluble (HS), hexane insoluble-toluene soluble (HI-TS), toluene insoluble-THF soluble (TI-THFS), and THF insoluble (THFI) fractions. The operating method is described below.

Flow of solvent fractionation. (Online version in color.)
Solvent Fractionation Conditions and Operating Procedure
1. Four centrifuge tubes were each filled with a 2.0 g sample and then with 50 ml hexane. The centrifuge tubes were ultrasonically vibrated and centrifuged at 19650 G for 30 min at 10°C. The supernatant solution was filtered. The solvents were removed from the recovered extracts. The filtration residue was recovered and put in each centrifuge tube containing the extraction residue. The centrifuge tubes were again filled with 50 ml of hexane, and ultrasonically vibrated and centrifuged as described above.
2. 50 ml of toluene were added to the hexane-insoluble fraction after the hexane extraction in each centrifuge tube. The same extraction procedure was repeated.
3. 50 ml of THF were added to the toluene-insoluble fraction after the toluene extraction in each centrifuge tube. The same extraction procedure was repeated.
4. The solvents were removed from the obtained extracts. These fractions were evaporated to dry and weighed to calculate their proportions.
The above-mentioned operations were all performed at room temperature to avoid the some structural changes of the samples during the operations.
2.3. FD-MS Measurement of Primary Coal Tar ExtractsThe FD-MS measurement was performed with a JEOL JMS-T100GCV mass spectrometer with a mass resolution of 8500 or more. Using a Carbotec emitter, a 25.6 mA/min electric field was generated to ionize the sample coated onto the emitter. The voltage of the detector was set at 2200 V with the measurement mass range set at 50 to 1600 m/z. The drift was corrected with the mass number 252.09396 of C20H16. These extractions were dissolved in THF at 1 mg/ml. The resultant solutions were used as the measurement samples.
2.4. Liquid State 1H NMR Measurement of Primary Coal Tar ExtractsLiquid state 1H NMR spectra were measured with a JEOL ECA 400 NMR spectrometer at a static magnetic field intensity of 9.4 T. The 100 mg extract was totally dissolved in 0.7 μl of deuterated chloroform solvent. The 90° pulse width was set at 11.6 μs with the pulse repetition time of 10 s. Tetramethylsilane (TMS) was used as the chemical shift reference. The obtained 1H NMR spectra were classified based on the following chemical shifts:19)
Ha: 9.0–6.0 ppm, Hα: 4.0–2.0 ppm, Hβ: 2.0–1.05 ppm, Hγ: 1.05–0.5 ppm
The obtained tar A and B weighed 108 and 166 g, respectively. This means that the yield of tar A and B was 5.4% and 8.3%, respectively. We found that the yield of tar changed with the type of raw material coal in this way. The higher volatile matter content of coal B is considered to have increased the yield of tar B.
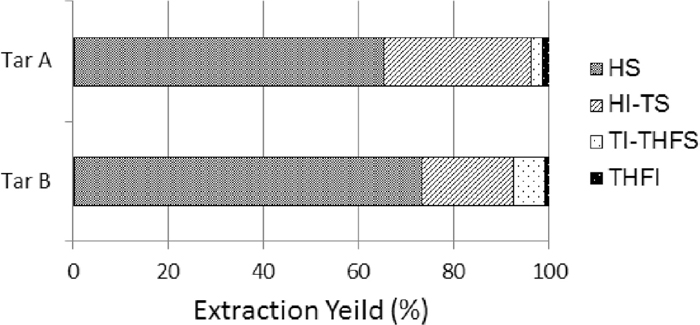
Figure 3 shows the proportions of the solvent fractions of tar A and B. Tar A and B were dissolved at 98.4% and 99.0%, respectively, in THF. When the proportions of the fractions are compared, the proportion of the hexane soluble (HS) fraction is the highest, followed by that of the hexane insoluble-toluene soluble (HI-TS) fraction. The sum proportions of the HS and HI-TS fractions accounted for more than 90% of all the fractions for both tar A and B. Table 2 shows the elemental analysis values of the HS and HI-TS fractions or main fractions of tar A and B. The carbon ratio of the HS fraction was 88.9% and 85.8% for tar A and B as compared with the 87.7% and 69.3% carbon ratios of coal A and B, respectively. The oxygen ratios of the HS fractions of tar A and B consequently decreased. This is considered as a result of the increase in the carbon ratio with the decrease in the oxygen ratio of each HS fraction. This tendency was especially remarkable with tar B prepared from coal B with a higher oxygen ratio. The carbon ratio of the HI-TS fraction of tar A was similar to that of coal A, but that of tar B was 79.5% and higher than the 69.3% carbon ratio of coal B. The oxygen ratio of the HI-TS fractions of tar A and B was lower than that of coal A and B. As with the HS fraction, the decrease in the oxygen ratio of the HI-TS fraction is considered to have increased its carbon ratio. The oxygen ratio of the HS and HI-TS fractions of both tar A and B was lower than that of coal A and B. This suggests that part of the oxygen contained in coal A and B was discharged as gas in the carbonization process. We found that the oxygen remaining in tar A and B was mostly concentrated in the heavy components.
Fractionation ratio of primary coal tar A and B.
| Sample | Ultimate Analysis (d. a. f. mass%) | ||||
|---|---|---|---|---|---|
| C | H | N | Odir | S | |
| A HS | 88.9 | 6.5 | 0.8 | 3.1 | 0.6 |
| A HI-TS | 87.3 | 5.3 | 1.9 | 5.3 | 0.6 |
| B HS | 85.8 | 8.7 | 0.4 | 5.4 | 0.1 |
| B HI-TS | 79.5 | 5.7 | 1.2 | 13.9 | 0.2 |
When the solvent fractions of tar A and B were compared, the proportion of the HS fraction of tar B was higher than that of tar A. This suggests that tar B contains many aliphatic components easily soluble in hexane.
3.2. Identification of Chemical Structure of Fraction Components of Primary Coal TarsThe FD-MS spectra of the HS fractions of tar A and B are shown in Fig. 4. The FD-MS spectra of the HI-TS fractions of tar A and B are shown in Fig. 5. We determined the molecular formulas from exact mass numbers and molecular structures from the unsaturation number as calculated by the following Eq. (1) from the molecular formulas:
| (1) |

FD-MS spectra of (A) HS fraction in primary coal tar A and (B) HS fraction in primary coal tar B.

FD-MS spectra of (A) HI-TS fraction in primary coal tar A and (B) HI-TS fraction in primary coal tar B.
To determine the one specific molecular structure, we set the following assumptions. We employed the assumption (c) according to Reference 20 and the assumptions (e), (f) and (h) according to Reference 21. We did not consider structural isomers and decided on one molecular structure for one mass number (one spectrum).
Assumptions Made for Determining Chemical Structures
(a) Ring structures are all composed of six-membered rings (benzene rings or naphthenic rings).
(b) Only one side chain is bonded to a condensed ring.
(c) Aliphatic side chains have no branches.
(d) Aliphatic side chains are bonded to aromatic rings.
(e) Nitrogen elements exist as pyridine types or 1,2-substituted amine types.
(f) Oxygen elements exist as phenol types or alcohol types.
(g) Since its abundance ratio is low according to the element analysis results, sulfur is not included in the any chemical structures.
(h) Neither aliphatic double nor triple bonds exist. Therefore, double bonds in Eq. (1) are assumed to be all derived from aromatic rings and the number of triple bonds is assumed to be 0.
(i) The structure (cata type or peri type) of condensed rings is the same as the condensed ring structure of a molecule with a close mass number and a high abundance ratio. However, the position of aromatic ring carbons to which the aliphatic side chains is bonded and the position of functional groups of hetero elements are arbitrary. Examples of methods for determining structural formulas are described below.
3.2.1. Example 1: Mass Number = 306.141It is premised that the molecular structure of C23H16 with the exact mass number 292.125, close to the exact mass number 306.141, is already determined as shown in Fig. 6(A). From the exact mass number 306.141, the molecular formula can be identified as C24H18 with the formula mass 306.14085. From the unsaturation number 16 and from the molecular structure of C23H16 (292.125) shown in Fig. 7(A), the exact mass number 306.141 can be considered in two ways as shown in Figs. 6(a) and 6(b). From the abovementioned assumption (b), the exact mass number 306.141 is determined as shown in Fig. 6(a).

Examples of molecular structures, (a) and (b) with exact mass of C24H18 (306.141) built from the structure (A) with exact mass of C23H16 (292.125).

Examples of molecular structures, (a), and (b) with exact mass of C24H22 (310.172) built from the structure (A) with exact mass of C24H18 (306.141).
It is premised that the molecular structure of C24H18 with the exact mass number 306.141, close to the exact mass number 310.172, is already determined as shown in Fig. 7(A). From the exact mass number 310.172, the molecular formula can be identified as C24H22 (formula mass = 310.17215). From the unsaturation number 14 and from the molecular structure of C24H18 (306.141) shown in Fig. 7(A), the exact mass number 310.172 can be considered in two ways as shown in Figs. 7(a) and 7(b). From the abovementioned assumption (d), the exact mass number 310.172 is determined as shown in Fig. 7(a).
When we determined the structural formulas described above, we thought that the structure of the starting material might be that of benzo[a]phenanthrene with the chemical formula C18H12 and the mass number 228.094 and of 3, 4-benzopyrene with the chemical formula C20H12 and the mass number 252.094.
To determine the molecular structure of compounds with a high abundance ratio, we defined the ratio x of the intensity Ix of an arbitrary mass spectrum to the sum intensity I0 of all mass spectra by the following Eq. (2). Here, the sum intensity of all mass spectra indicates the number of all ions counted.
| (2) |
When the mass spectra with the intensity x>0.5 were selected, their number was 41 and 37 for tar A and B, respectively. The ratio of the sum intensity of these mass spectra to that of all mass spectra was 36% for both tar A and B. The molecular structures of the HS fraction components in tar A and B are shown in Tables 3 and 4, respectively. Of the 41 components of the HS fraction of tar A, 39 were components containing polycyclic aromatic hydrocarbons (PAHs) and accounted for the majority of the HS fraction components. Of the PAH containing components, 31 had side chains or naphthenic rings bonded to PAHs. The side chains are considered to be short and the number of carbons comprising the side chains is considered to be 1 or 2. The number of carbons comprising the naphthenic rings is approximately 2 to 4. These carbons were calculated to constitute one naphthenic ring.
;%0A%09%09%09newWindow.document.open();%0A%09%09%09newWindow.document.write('<img src=%22./Graphics/60_1892_tbl_3.jpg%22>');%0A%09%09%09newWindow.document.close();%0A%09%09)
|
;%0A%09%09%09newWindow.document.open();%0A%09%09%09newWindow.document.write('<img src=%22./Graphics/60_1892_tbl_4.jpg%22>');%0A%09%09%09newWindow.document.close();%0A%09%09)
|
Of the 37 HS fraction components of tar B, on the other hand, 35 were composed only of aliphatic hydrocarbons and accounted for the majority of the HS fraction components. From the unsaturation number derived from their molecular formulas, it was inferred that the 35 HS fraction components were aliphatic chain components each containing only one naphthenic ring (composed of six carbons) and components composed only of chain aliphatic. The side chain length of the 37 HS fraction components was longer than that of the aliphatic side chain components present in the HS fraction of tar A. The number of carbons constituting the side chains was calculated to be a maximum of 33. The HS fraction of tar A produced from coal A with higher aromaticity fa is mainly composed of PAHs and the HS fraction of tar B produced from coal B with lower aromaticity fa is mainly composed of aliphatic hydrocarbons. It is implied that the differences in the molecular structures of the HS fractions between tar A and B arose from the differences in the properties between coals A and B. Almost no PAHs were detected in the HS fraction of tar B, probably because the number of rings in PAHs present in coal B was small (1 to 2 rings).7) That is, if the number of rings of PAHs in the raw material coal is 1 to 2, PAHs of the primary coal tar should exist as benzene, naphthalene, etc. However, as the pressure when the sample is ionized in the FD-MS measurement is less than 2.0 × 10⁻³ Pa, it is conceivable that highly sublimable benzene and naphthalene cannot be detected in the FD-MS measurement. Particularly, in this experiment, we started the FD-MS measurement after we confirmed that the pressure dropped below 2.0 × 10⁻³ Pa. Under this analyzing condition, benzene with a vapor pressure of 10 kPa and anthracene with a vapor pressure of about 0.08 Pa are considered to be completely undetectable.
When the mass spectra with an intensity x>0.5 were selected for the HI-TS fractions of tar A and B, the total number of mass spectra that satisfy the conditions of Eq. (1) was 46 and 28 for tar A and B, respectively. The ratio of the total intensity of these mass spectra to that of all mass spectra was 10.0% and 5.4% for tar A and B, respectively. The reason that these ratio were smaller than for the HS fractions is probably because the HI-TS fractions of tar A and B were composed of more components than the HS fractions. Next, we analyzed the mass spectra with high relative intensity to satisfy this condition. As a result, we found that the HI-TS fraction of tar A was mainly composed of polycyclic aromatic hydrocarbons with 4 to 8 rings and with side chains, each with a maximum of two carbons, bonded and of nitrogen-containing polycyclic aromatic hydrocarbons. The HI-TS fraction of tar B was mainly composed of straight-chain aliphatic hydrocarbons containing oxygen functional groups and of cyclic aliphatic hydrocarbons. Like the HS fractions of tar A and B, these results are considered to reflect the differences in the properties of coal A and B. Furthermore, as evident from the elemental analysis values shown in Table 2, the FD-MS analysis clarified that components containing oxygen functional groups were concentrated in the HI-TS fraction of tar B.
3.3 Verification of Quantitativity of FD-MSLiquid state 1H NMR spectra of the HS fractions of tar A and B are shown in Figs. 8 and 9, respectively. The hydrogen structures of the 1H NMR spectra were classified by chemical shifts into 4 types: Ha (1H bonded to aromatic carbon), Hα (1H bonded to aliphatic carbon next to aromatic carbon), Hβ (1H bonded to aliphatic carbon other than Hα and Hγ), and Hγ (1H bonded to aromatic terminal carbon situated 3rd or more aromatic carbons away). Their abundance ratios are shown in Table 5.

1H NMR spectrum of HS fraction in primary coal tar A. (Online version in color.)

1H NMR spectrum of HS fraction in primary coal tar B.
| Sample | Classification and proportions 1H chemical structures | |||
|---|---|---|---|---|
| Ha (12.0–6.0 ppm) | Hα (5.0–2.0 ppm) | Hβ (2.0–1.05 ppm) | Hγ (1.05–0.5 ppm) | |
| A HS | 0.58 | 0.17 | 0.24 | 0.02 |
| B HS | 0.12 | 0.24 | 0.49 | 0.15 |
We identified the chemical formulas from the mass spectra, specified one molecular structure based on the above assumptions (a) to (i), and quantified its abundance. We then classified the hydric structures in the molecules identified from the mass spectrum into the 4 types Ha, Hα, Hβ and Hγ, and quantified their abundance. When making these calculations, however, we considered only those molecules that satisfied the conditions x>0.2, x>0.3, x>0.4 and x>0.5 in Eq. (2), respectively, classified the hydric structure into the 4 types, and quantified their abundance.
Of the HS fraction of tar A, the number of mass spectra corresponding to x>0.2, x>0.3, x>0.4 and x>0.5 was 145, 100, 61 and 41, respectively. Table 6 shows the abundance ratios of the hydric structures in the HS fraction of tar A calculated from the 1H NMR spectra and FD-MS mass spectra. When x>0.5, the abundance ratios of the hydric structures Ha, Hα, Hβ and Hγ calculated from the FD-MS mass spectra differed greatly from those measured from the 1H NMR spectra. As the x value became smaller, however, the abundance ratios of the hydric structures calculated from the FD-MS mass spectra got closer to those measured from the 1H NMR spectra. The reason may be ascribed to the increase in the proportion of molecules to be analyzed among all the molecules in the entire sample. Especially when x>0.2, the experimental and calculated values almost agreed with each other. This suggests that the hydric structures estimated from the FD-MS mass spectra indicate the mean hydric structures of the respective samples. The comparison of experimental and calculated elemental analysis values are shown in Table 7. As the x value became smaller, the calculated elemental analysis values got closer to the experimental elemental analysis values, while the experimental carbon and oxygen ratios differed from the calculated carbon and oxygen ratios. Figure 4(A) shows that compounds with lower FD-MS mass spectrum intensity have greater mass numbers. According to the report of Ashida et al.,22) heavier components tended to have large amount of oxygen ratio. This tendency suggests the possibility that oxygen was concentrated in compounds not counted when x>0.2 and with greater mass numbers. Given this possibility, it may be considered that even when x>0.2, the proportion of the calculated oxygen element was smaller than the experimental one and hence that the calculated proportion of carbon atoms was larger than the experimental value under this influence. That is, when x>0.2, the oxygenic structures estimated from the FD-MS mass spectra are not considered to represent the mean oxygenic structures of the respective samples. However, the abundance ratio of oxygen and the morphology of oxygenic functional groups do not affect the structures of aromatic and aliphatic carbons in the compounds. When x>0.2, therefore, the FD-MS mass spectra is found to have quantitivity when determining whether carbon framework structures of the compounds are aromatic or aliphatic hydrocarbons.
| x | Ha | Hα | Hβ | Hγ | |
|---|---|---|---|---|---|
| Experiment (NMR) | – | 0.58 | 0.17 | 0.23 | 0.02 |
| Calculation (FD-MS) | 0.2 | 0.58 | 0.18 | 0.22 | 0.02 |
| 0.3 | 0.63 | 0.18 | 0.18 | 0.02 | |
| 0.4 | 0.66 | 0.17 | 0.16 | 0.01 | |
| 0.5 | 0.72 | 0.17 | 0.11 | 0.00 |
| x | Ultimate Analysis (d. a. f. mass%) | |||||
|---|---|---|---|---|---|---|
| C | H | N | O | S | ||
| Experiment | – | 88.9 | 6.5 | 0.8 | 3.1 | 0.6 |
| Calculation (FD-MS) | 0.2 | 91.2 | 6.9 | 1.0 | 0.9 | 0.0 |
| 0.3 | 91.8 | 6.6 | 0.8 | 0.9 | 0.0 | |
| 0.4 | 92.6 | 6.4 | 0.4 | 0.6 | 0.0 | |
| 0.5 | 93.5 | 5.9 | 0.3 | 0.4 | 0.0 | |
The HS fraction of tar B was analyzed by the same methods. Table 8 shows the abundance ratios of the hydric structures in the HS fraction of tar B as calculated from the 1H NMR spectra and the FD-MS mass spectra. As the x value became smaller, the abundance ratios of the hydric structures estimated from the FD-MS mass spectra were found to approach those measured from the 1H NMR spectra. The Ha value measured by the NMR method agreed well with that calculated from the FD-MS mass spectra, however, the measured proportions of hydrogen bonded to aliphatic carbon (Hα, Hβ and Hγ) did not agree with those calculated. The proportions of Hα and Hγ obtained by calculation using the FD-MS spectra were smaller than those obtained by analyzing 1H NMR spectra. On the other hand, the proportions of Hβ showed the reverse tendency. This may be because the molecular structure we estimated only from the mass number under the assumption (b) “Only one side chain is bonded to a condensed ring”. For the estimation of molecular structure from mass spectra, estimated molecular structure differs from the actual molecular structure. If multiple side chains are bonded to an aromatic ring, the hydrogen Hα to bond to α carbon and the terminal methyl group hydrogen Hγ should be more than that evaluated under the assumption (b). This study found that the FD-MS calculated values do not differ from the NMR measured values when the average side chain length is short as in the case of the HS fraction of tar A, but greatly differ from the NMR measured values when the mean side chain length is long as in the case of the HS fraction of tar B.
| x | Ha | Hα | Hβ | Hγ | |
|---|---|---|---|---|---|
| Experiment (NMR) | – | 0.12 | 0.24 | 0.49 | 0.15 |
| Calculation (FD-MS) | 0.2 | 0.12 | 0.11 | 0.73 | 0.05 |
| 0.3 | 0.09 | 0.09 | 0.77 | 0.05 | |
| 0.4 | 0.05 | 0.07 | 0.83 | 0.06 | |
| 0.5 | 0.01 | 0.07 | 0.86 | 0.06 |
We classified the molecules comprising the HS fraction into molecules (PAHs) composed only of aromatic hydrocarbons, molecules (PAHs + Ali) composed of aliphatic side chains bonded to aromatic hydrocarbons and molecules (Ali) composed only of aliphatic chains. We then calculated the abundance ratios of these 3 types. The results are shown in Fig. 10. PAHs and PAHs + Ali accounted for more than 80% of the components of the HS fraction of tar A. In other words, the HS fraction of tar A is mainly composed of aromatic compounds. On the other hand, aliphatic hydrocarbons (Ali) and PAHs accounted for more than 70% and about 2% of the HS fraction of tar B, respectively. In this way, tar A produced from coal A with a high fa value was found to be rich in aromatic carbons and tar B produced with coal B with a low fa value was found to be rich in aliphatic carbons. Therefore, it was found that the differences in chemical structure between tar A and B were caused from the differences in chemical structure between coals A and B.

Classification of chemical structures contained HS fractions for primary coal tar A and B.
The HI-TS fractions of tar A and B were similarly analyzed and the FD-MS calculated abundance ratios of Ha, Hα, Hβ and Hγ were compared with the 1H NMR measured abundance ratios of Ha, Hα, Hβ and Hγ, respectively. The results are shown in Tables 9 and 10. Even when x>0, the HI-TS fractions of tar A and B showed great differences between the FD-MS calculated abundance ratios and the NMR measured abundance ratios. When x>0.2, the number of analyzed mass spectra is 180 and 135 for the HI-TS fractions of tar A and B, respectively. These numbers are equal to or more than those for the HS fractions of tar A and B. Since the ratio of the total intensity of the mass spectra that satisfy the condition x>0.2 to the total intensity of all mass spectra is 0.40 and 0.26 for tar A and B, respectively, these sets of data are not considered to reflect the average molecular structure information of the samples. Furthermore, since the HI-TS fraction of tar B is considered to contain especially many oxygen functional groups according to the analytical results discussed above, their ionization efficiency greatly differs from that of polycyclic aromatic hydrocarbons composed only of carbon and hydrogen and from that of aliphatic hydrocarbons. It is considered that the intensity of mass spectra is not necessarily proportional to the abundance ratios of constituent molecules.
| x | Ha | Hα | Hβ | Hγ | |
|---|---|---|---|---|---|
| Experiment (NMR) | – | 0.50 | 0.35 | 0.14 | 0.02 |
| Calculation (FD-MS) | 0.2 | 0.67 | 0.23 | 0.09 | 0.01 |
| 0.3 | 0.70 | 0.22 | 0.07 | 0.01 | |
| 0.4 | 0.72 | 0.21 | 0.06 | 0.01 | |
| 0.5 | 0.74 | 0.20 | 0.05 | 0.02 |
| x | Ha | Hα | Hβ | Hγ | |
|---|---|---|---|---|---|
| Experiment (NMR) | – | 0.26 | 0.34 | 0.35 | 0.05 |
| Calculation (FD-MS) | 0.2 | 0.53 | 0.18 | 0.25 | 0.04 |
| 0.3 | 0.47 | 0.18 | 0.30 | 0.04 | |
| 0.4 | 0.42 | 0.16 | 0.37 | 0.05 | |
| 0.5 | 0.35 | 0.12 | 0.47 | 0.06 |
It is difficult to quantitatively interpret FD-MS and NMR from the abovementioned analysis results of the HI-TS fractions of tar A and B. From these analysis results of the HS fractions of tar A and B that account for more than 60% of the fractions of tar A and B, it was clarified that tar A produced from coal A with a high fa value is rich in aromatic carbons and tar B produced with coal B with a low fa value is rich in aliphatic carbons. Therefore, it was found that the differences in chemical structure between tar A and B were caused from the differences in chemical structure between coals A and B.
We produced primary coal tars A and B from 2 kinds of coals A and B with different elemental analysis values and performed FD-MS and liquid state 1H NMR spectrum measurements on the HS and HI-TS fractions of tar A and B. We assigned the exact mass numbers obtained from the FD-MS mass spectra to the chemical structures under certain assumptions and calculated the abundance ratios of the chemical structures from the mass spectrum intensities. As a result, PAHs and PAH + Ali are the main components of the HS fraction of tar A, and that Ali are the main components of the HS fraction of tar B. The hydric structure ratio of the HS fraction of tar A quantified from peaks with a mass spectrum intensity of 0.2% or more of the total mass spectrum intensity almost agreed with that obtained from the 1H NMR spectra. On the other hand, when the mean aliphatic side chain length is long as in the case of the HS fraction of tar B, it was clarified that the hydric structures calculated from the FD-MS mass spectra differed from the hydric structures measured by 1H NMR and that the FD-MS tar structure analysis method described here has room for improving the assumptions made regarding the number and length of aliphatic side chains. Further, under the same assumptions as made for the HS fractions, the molecular structure of the HI-TS fraction components with many constituent molecules does not reflect the average information of the samples. Since molecules containing oxygen functional groups differ in ionization efficiency from molecules composed only of hydrocarbons, it was suggested that the mass spectrum intensity of components with a high oxygen ratio is not necessarily proportional to the abundance ratio of constituent components.
As discussed above, from the analysis of FD-MS mass spectra and 1H NMR spectra, we clarified that the properties of raw material coals affect the molecular structures of primary coal tars. We also clarified that especially with measurement samples with short aliphatic side chain length and low oxygen ratio, the FD-MS mass spectrum intensity is proportional to the abundance ratio of constituent molecules.