Abstract
We have constructed an automatic in situ observation system for monitoring the behavior of small fatigue cracks at the microstructural level that, when used in conjunction with a digital-image correlation (DIC) technique, permits the continuous and automatic tracking and recording of microscopic deformation behavior. To verify the effectiveness of this system, we applied it to the evaluation of small fatigue cracks in heat-treated low-carbon steel. The results confirmed that our system can be used in the automatic tracking and recording of the initiation and early growth behavior of microstructurally small fatigue cracks. By the use of DIC analysis, we also succeeded in visualizing the opening-and-closing behavior of small fatigue cracks as well as the behavior of microscopic microstructural deformations, such as inhomogeneous strain concentrations, that caused the fatigue cracks. Although the early-stage growth of fatigue cracks propagates faster than that of long cracks, it is consistent with long-crack data if the effective stress intensity factor range ΔKeff which calculated by crack opening stress measured by DIC is used.
1. Introduction
As microscopic fatigue cracks initiate and grow, they result in metal fatigue, causing fracture of components. Microscopic fatigue cracks normally initiate along slip bands within crystal grains1) and they propagate through crack-tip slip deformations.2,3) Therefore, fatigue properties are affected by microstructural factors pertaining to slip deformation, such as grain boundaries. In addition small fatigue cracks, which are generally equal in size to several crystal grains, are considered to be particularly sensitive to microstructure.
Since small fatigue cracks are influenced by inhomogeneous microstructures or unique mechanical conditions, they present different behaviors from those of macroscopic fatigue cracks, which are usually determined by linear elastic fracture mechanics.4,5,6) Small fatigue cracks are generally classified as microstructurally small cracks or mechanically small cracks.4) Microstructurally small fatigue cracks generally propagate discontinuously by repetitive growth and are stopped by the effect of grain boundaries.6) Therefore fatigue prediction models that consider interactions between dislocations and grain boundaries have been proposed for the evaluation of microstructurally small fatigue cracks.7,8) In addition, some researchers have recently developed methods that utilize the crystal plasticity finite-element method.9,10) On the other hand, methods based on the continuum mechanics theory are more effective for the evaluation of mechanically small cracks. The effectiveness of elastic–plastic fracture mechanics in calculating the crack-opening stress by using the Dugdale model has been reported.11,12,13,14)
Nevertheless, it is still difficult to achieve a quantitative evaluation of the relationship between small fatigue-crack behavior and microstructure. This is partly because the difficulties involved in observing small fatigue cracks have limited the availability of relevant data. Because it is impossible to predict where a fatigue crack will initiate, it is difficult to observe its initiation behavior under high magnification at a particular location. Consequently, a replication method is often used for observation purposes.6,15) In this method, the features of the entire surface of the sample are copied at regular intervals during the fatigue test onto a series of plastic films that are subsequently examined with a microscope. Because observations by the replica method require considerable amounts of time and effort, the amount of experimental data pertaining to small fatigue cracks is limited. In the replica method, it is also difficult to observe microscopic deformation behavior, which is considered to be an important factor in the initiation and propagation of fatigue cracks. For these reasons, to elucidate the initiation and growth behaviors of small fatigue cracks, there is a need for a new observation method, for example, an automatic microscopy system that would readily permit the collection of data for such cracks. Moreover, the digital-image correlation (DIC) technique appears to be effective in capturing details of microscopic deformations.16,17,18,19,20,21)
We therefore developed and built an automatic system for in situ observation to monitor the initiation and growth of small fatigue cracks. In this system, a digital microscope equipped with an automatic focusing system captures a series of panoramic images during the fatigue test. This automated system has been combined with the DIC technique to permit the automatic and continuous capture of the behavior of small deformations related to small microstructural fatigue cracks. Here, we demonstrate its effectiveness through the results of observations of the initiation and growth behavior of small fatigue cracks in heat-treated low-carbon steel.
2. Experimental Procedure
2.1. Automatic In Situ Observation System
Figure 1(a) is a schematic representation of the observation system that we developed. The system consists of a fatigue-testing machine, a digital microscope, a motorized three-axis stage, and a programmable logic controller (PLC) to control these devices. Figure 1(b) is a flowchart showing an example of an observation sequence. During the continual capture of panoramic images, the fatigue test is suspended at regular intervals while a series of panoramic images of the surface of the specimen are automatically captured. Each time an image is acquired, automatic focusing is performed and the stage is moved. This method is designed to permit the monitoring and recording of the initiation of a fatigue crack, wherever it occurs on the specimen, as a microscopic image with high magnification. It is also possible to capture panoramic images continuously during a loading or unloading process.
2.2. Materials, Specimens, and Methods
A heat-treated low-carbon steel (0.15C–1.5Mn–0.5Cr) was used in this study. A square bar (12 × 13 × 120 mm) was heat-treated by cooling from 1400 to 1000°C at 50°C/s and then from 1000 to 250°C at 1°C/s. The mechanical properties of the heat treated specimen are listed in Table 1.
Table 1. Mechanical properties.
| Yield strength (MPa) | Tensile strength (MPa) | Elongation (%) | Reduction of area (%) | Vickers hardness |
|---|
| 430 | 611 | 49 | 66 | 196 |
Figure 2 is a micrograph showing the microstructure of the sample after heat treatment. It consisted primarily of a bainite structure with grain-boundary ferrites, and the prior austenite grain size was measured to be approximately 500 μm.
Figure 3 shows the configuration of the specimen: it had a dumbbell shape with a 2-mm-thick flat-plate section that was subjected to the test. Before observation, the surface of the specimen was mirror finished by buffing, and etching with nital (HNO3 + ethanol). To prevent fatigue cracking on the rear surface, the rear surface of the specimen was polished with emery paper in the axial direction. Since polishing applies a compressive residual stress to the rear surface of the specimen, the fatigue life of the rear surface was expected to be longer than that of the front.

A fatigue test was conducted by using a servo hydraulic-type fatigue-testing machine at a stress ratio of −1 and a frequency of 20 Hz, with axial-load control. DIC analysis was conducted by using commercially available analytical software (Vic-2D; Correlated Solutions) with eight-bit images of 1600 × 1200 pixels (0.44 μm/pixel) captured by using a digital microscope (VHX5000; Keyence, Osaka). Conditions for DIC analysis were set at 35 pixels for the subset size, and 7 pixels for the step size (distance between the centers of the subsets). Since DIC analysis is usually influenced by the distance between the microscope and the object, automatic focusing was used to maintain a constant distance between the observation surface and microscope during each capture.
Because various factors, such as the analysis parameters, the characteristics of the camera, random pattern conditions, luminance, and digital noise, can contribute to uncertainty in DIC analyses, we conducted DIC analyses on several images captured under strain-free conditions to determine the workable surface resolution ahead of the main test. Under the conditions for image capture and analysis, a maximal inhomogeneous strain of around 2 × 10⁻³ was observed as noise in this study.
3. Experimental Results and Analysis
3.1. Initiation Behavior of Small Fatigue Cracks
Figure 4 shows the initiation of a small fatigue crack that was observed through the automatic microscope during a fatigue test conducted at a stress amplitude of 260 MPa. Figure 4(a) is a panoramic micrograph of the entire test area of 2 × 1 mm. Figure 4(b) shows a set of magnified images of the crack-initiation site marked by the white rectangle in Fig. 4(a). It can be seen that a fatigue crack initiated in the slip bands which concentrated in the grain-boundary ferrite [shown as a dotted line in Fig. 4(b)]. However, from the microscopic images alone, it is difficult to distinguish between the slip band and a fatigue crack or to evaluate the microscopic deformation behavior.

Figure 4(c) shows a set of DIC results for the vertical strain distributions corresponding to Fig. 4(b). In this analysis, the strain distribution was analyzed for microscopic images obtained at a compressive loading of −180 MPa (the reference image) and at a tensile loading of +180 MPa (the analyzed image) for each fatigue cycle. In Fig. 4(c) i), during the first loading cycle, areas experiencing relatively high strain can be observed on the lower side of the grain-boundary ferrite. These strains might be the inhomogeneous strain distributions that led to the initiation of the fatigue crack.
Whereas Fig. 4(c) ii) does not clearly show any strain concentrations, in Fig. 4(c) iii), concentrated strains can be clearly seen around the fatigue crack. DIC analysis usually computes strain on the basis of the displacement gradient of the curved surface, obtained by approximating the displacement of the center points of several subsets by using the least-squares method.22) Therefore, if a crack opens on the observation surface, the crack-opening displacement should appear as a strain at the center of the subsets that vertically sandwich the crack movement. In Fig. 4(c) iii), a crack opening due to loading was detected as a strain. Here, the difference between the length of the black area observed on the surface in Fig. 4(b) ii) and that in Fig. 4(b) iii) was approximately 50 μm. When the amount of crack opening was calculated by linear fracture mechanics on the assumption that the crack was semicircular, the increase in the opening amount was only about 40%, even for a crack that grew by 50 μm. However, the difference in the strain generated around the black area was more than three-fold that observed in Figs. 4(c) ii) and 4(c) iii). The crack was hardly open in Fig. 4(b) ii), indicating that the black area represents irregularities due to slippage or to a very shallow crack if an actual crack was present. On the other hand, Fig. 4(b) iii) shows a crack that has clearly opened. The crack might have become deeper as it grew, clearly opening between Figs. 4(b) ii) and 4(b) iii), but the mechanism by which it grew could not be determined from the observations made in this study.
Because the minimum size of a crack that is detectable by DIC surface resolution varies according to the observation conditions and the opening displacement relative to the load stress, it cannot be precisely determined. However, under the observation conditions in this study, a semicircular crack measuring several tens of micrometers was detectable. (A digital microscope with higher magnification could have been used, but this would have required a longer test time.) Because we often refer to a crack in terms of the grain size when we discuss the initiation lifetime of fatigue cracks,7) DIC is assumed to be effective in evaluating fatigue-crack initiation for a range of structural materials.
In Fig. 4, the crack initiated in the grain-boundary ferrite, possibly because the ferrite section was softer. To be able to identify differences between the grain-boundary ferrite where the crack initiated and other grain-boundary ferrites, it is necessary to conduct a detailed evaluation of the ferrite thickness, the influence of plastic constraints due to adjacent crystal grains, and differences in Schmid’s factor by using such methods as crystal orientation and finite-element analysis.
As such, the use of DIC analysis might permit the visualization of strain concentrations that are related to crack initiation, thereby permitting cracks to be distinguished from slip bands. This would also be expected to lead to quantification of fatigue-crack-initiation criteria, which have previously been defined only in vague terms.
3.2. Growth Behaviors of Small Fatigue Cracks
Figure 5 shows the growth curve for a small fatigue crack. The crack length was measured from the captured panoramic images. The lower section of Fig. 6 shows the relationship between fatigue-crack growth rate and the microstructure; the growth rates of both tips of the crack are plotted in relation to their respective positions. The upper section of the graph shows an image of a fatigue crack on the same scale; this shows the relationship between the growth rate of the crack and the microstructure. In Fig. 6, the crack growth rate shows repeated discontinuous accelerations and decelerations, and crack-growth arrests can be seen at the crack tip, especially on the left-hand side. We have therefore shown that discontinuous changes in the crack growth rate due to the influence of the microstructure can be successfully captured. As the prior austenite grain boundary is shown by white lines in Fig. 6, the relationship between crack growth arrests and the prior austenite grain boundary observed on the surface is unclear. We therefore believe that the crack growth was influenced by microstructural features inside the specimen.

One of the most important factors in evaluating the growth of a fatigue crack is its opening–closing behavior.23) In general, the growth rate of macroscopic fatigue cracks is controlled by the effective stress intensity factor ΔKeff, as shown in Eq. (1) below:
|
Δ
K
eff
=
K
max
-
K
op
=A(
σ
max
-
σ
op
)
πa
| (1) |
Here,
Kmax is the maximum stress intensity factor,
Kop is the crack-opening stress intensity factor,
σmax is the maximum stress,
σop is the crack-opening stress,
A is a geometric correction factor, and
a is the crack length. It is therefore important to measure the crack-opening stress and, for macroscopic fatigue cracks, these measurements can be taken relatively easily with a strain gauge. However, the determination of the crack-opening stress for small fatigue cracks is extremely difficult, and thus actual measurement data are scarce.
13,24,25) The newly developed system in this study enables us to measure the crack-opening stress, even for small fatigue cracks.
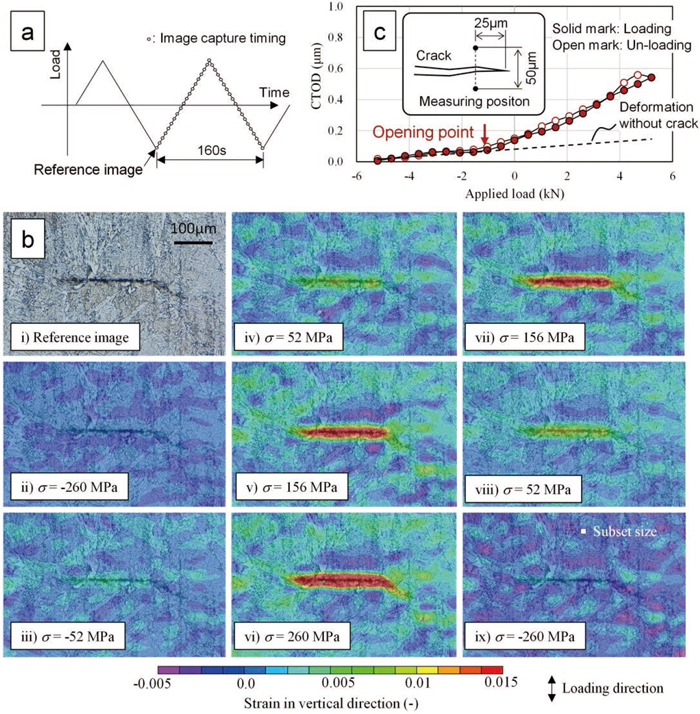
Figure 7 shows the crack opening–closing behaviors as visualized by DIC analysis. The example of crack opening-closing animation is shown in the MoviesS1(Supporting information). The crack in this figure is the same as that shown in Fig. 4. As shown in Fig. 7(a), 40 microscopic images were successfully recorded from the minimum to the maximum load, and these were used for the DIC analysis; the image taken with the minimum load was used as a reference image. Figure 7(b) shows changes in strain distribution during the loading process [Figs. 7(b) ii) to 7(b) vi)] and the unloading process [Figs. 7(b) vi) to 7(b) ix)]. Strain distributions attributable to crack opening were observed around the fatigue crack [Fig. 7(b)]. Strain changes due to the opening and closing of the crack were visualized [Fig. 7(b)] while the loading was gradually increased and decreased, respectively. Figure 7(c) shows the relationship between the applied load and the crack-tip opening displacement (CTOD), permitting the opening point of the small crack to be clearly located. The CTOD was measured at 25 μm behind the crack tip from the DIC analysis. The dotted line in Fig. 7(c), represents the amount of deformation without cracks from an elastic calculation. The red arrow in Fig. 7(c) marks the point at which the CTOD deviates from the dotted line showing the deformation without cracks, which was thus clearly identified as the crack-opening point.
Rabbolini et al.18) and Carroll et al.17) have demonstrated the effectiveness of DIC analysis in evaluating the opening–closing behaviors of relatively long fatigue cracks that initiate and grow from an artificial defect. However, there are no known previous reports on the visualization of the opening–closing behaviors of naturally initiated small fatigue cracks. The system that we developed in this study was successful in visualizing the opening–closing behaviors of small microstructural fatigue cracks.
Next, we evaluated the rate of crack growth by using the measured crack-opening stress. Figure 8 shows the relationship between the crack length and the crack-opening stress as measured by DIC. While the fatigue crack was small, it tended to open under compressive stress, with the opening stress increacing asymptotically to zero load as the crack propagated. Figure 9 shows the fatigue-crack growth rate as evaluated according to fracture-mechanics parameters. Figure 9(a) shows the relationship between the stress intensity factor range (ΔK), and the fatigue-crack growth rate. The former is the value at the deepest point of the crack, and is calculated from Eq. (2):
|
ΔK=
K
max
=A
σ
max
πa
| (2) |
Because this was an axial-load fatigue test, the crack depth
a was assumed to be half the crack length,
l. The dotted lines in the figure represent the growth-rate characteristics of a typical long crack (corresponding to the relationship Δ
Keff – d
a/d
N). The results of our study confirm the general view that the growth rate of small fatigue cracks is greater than that of macroscopic cracks while the crack is short. As the crack grows, its growth rate drops briefly drops and then increases to resemble the characteristics of a long crack.
Figure 9(b) shows the relationship between the range of the effective stress intensity factor, Δ
Keff, and the fatigue-crack growth rate. The crack-opening stress value obtained from the DIC analysis shown in
Fig. 8 was used for the crack-opening stress value in
Eq. (1) to calculate Δ
Keff. In
Fig. 9(b), the accelerated rate of crack growth in the section where the crack was short disappeared and became consistent with the characteristics of a long crack. On the other hand, the deceleration of the growth rate did not disappear, even when the crack-opening stress was taken into consideration.


It is known that the acceleration of the growth rate of small fatigue cracks is influenced by two factors: large-scale yielding and crack opening and closing. In the former case, the conditions for linear fracture mechanics are not satisfied for many small fatigue cracks. Previous studies have demonstrated that the acceleration of the growth rate can be explained by using elastic–plastic fracture mechanics parameters, such as the cyclic J-integral range.11,14) In the latter case, although the quantity of actual measurement data is small, there are several reports that the acceleration of the fatigue-crack growth rate is influenced by crack opening and closing.24,26) For example, Tokaji et al. reported that a small fatigue crack opened under compressive stress, in agreement with the results of the present study.24) Similar phenomenon is generally known to occur when cyclic macroscopic plastic deformation occurs under high stress.13,18,27) This has also been reproduced by means of nonlinear finite-element analysis.28) It is a behavior attributable to the mechanical balance between plastic strain fields near to and distant from the crack. If we assume that a crack occurs on a relatively soft surface, a small fatigue crack in its early initiation stage might show similar tendencies to those of a fatigue crack under high stress. Under the test conditions used in the present study, the repeated J-integral range was equal to the stress intensity factor, since the relationship between the repeated stress and strain was completely within the linear range. The acceleration of the growth rate of the small fatigue crack shown in Fig. 9 was therefore attributable to the influence of crack opening–closing behavior, and it disappeared because the measured opening stress was used. Meanwhile, the deceleration of the crack-growth rate was probably due to the influence of inhomogeneous microstructures, such as crystal orientations and grain boundaries. Our newly developed system allowed us to eliminate the influences of crack opening–closing behavior, and thus to extract the influences of microstructures alone. The system is expected to shed light on, and to permit modelling of, the influences of microstructures, crack opening–closing behaviors, and large-scale yielding, because it will generate more data on small fatigue cracks.
As discussed above, the automated in situ observation system developed in this study was able to capture the initiation and growth behaviors of small fatigue cracks without manual intervention. When used in combination with DIC analysis, the system also successfully permitted the visualization and evaluation of microscopic deformation behaviors, such as inhomogeneous strain concentrations that might initiate fatigue cracks, and the evaluation of the opening–closing behavior of fatigue cracks. Fatigue data of this type is crucial in understanding the relationship between small fatigue cracks and microstructures. The system developed in this study has been proven to be effective in evaluating these types of crack.
4. Conclusions
In this study, we evaluated the effectiveness of our newly developed automatic in situ observation system for the analysis of the behavior of small fatigue cracks. To confirm the value of the developed automatic system, we conducted a fatigue test to study the initiation and growth of a small fatigue crack on a heat-treated low-carbon steel. From the results, the following conclusion can be drawn.
(1) Automatic and continuous capture of panoramic images by the system enabled us to observe the initiation and early growth behaviors of small fatigue cracks in a continuous manner.
(2) By DIC analysis of the automatically captured microscopic images, we succeeded in visualizing both inhomogeneous strain concentrations likely to cause fatigue cracks and microscopic deformations such as the opening–closing behaviors of small fatigue cracks.
(3) We also succeeded in measuring the opening stresses of small fatigue cracks by evaluating crack-opening displacements through DIC analysis of the crack opening–closing behaviors.
(4) From an evaluation of the effective stress intensity factor range made by using the crack-opening stress measured by DIC analysis, we found that the acceleration tendency of small fatigue cracks disappeared and became consistent with the growth characteristics of long cracks. Meanwhile, the deceleration of the crack-growth rate did not disappear, indicating that the influences of the microstructure, such as grain-boundary resistivity, had been successfully identified.
(5) On the basis of above results, we verified that our newly developed system can readily capture the initiation and growth behaviors of small fatigue cracks as well microscopic deformations and crack opening-and-closing data, which are essential items of information for understanding the influences of microstructure on the growth of small fatigue cracks.
Acknowledgement
This work was supported by the Council for Science, Technology and Innovation (CSTI), the Cross-Ministerial Strategic Innovation Promotion Program (SIP), “Structural Materials for Innovation” (Funding agency: JST). Material preparation and heat treatment was supported by Professor Tadashi Kasuya of Tokyo University.
References
- 1) K. Katagiri, A. Omura, K. Koyanagi, J. Awatani, T. Shiraishi and H. Kaneshiro: Metall. Trans. A, 8 (1977), 1769. https://doi.org/10.1007/BF02646881
- 2) P. Neumann: Acta Metall., 22 (1974), 1155. https://doi.org/10.1016/0001-6160(74)90071-6
- 3) R. M. N. Pelloux: Eng. Fract. Mech., 1 (1970), 697. https://doi.org/10.1016/0013-7944(70)90008-1
- 4) R. O. Ritchie and J. Lankford: Mater. Sci. Eng., 84 (1986), 11. https://doi.org/10.1016/0025-5416(86)90217-X
- 5) J. Lankford: Fatigue Fract. Eng. Mater. Struct., 8 (1985), 161. https://doi.org/10.1111/j.1460-2695.1985.tb01201.x
- 6) K. Tokaji, T. Ogawa, Y. Harada and Z. Ando: Fatigue Fract. Eng. Mater. Struct., 9 (1986), 1. https://doi.org/10.1111/j.1460-2695.1986.tb01207.x
- 7) K. Tanaka and T. Mura: J. Appl. Mech., 48 (1981), 97. https://doi.org/10.1115/1.3157599
- 8) K. Tanaka, Y. Akiniwa, Y. Nakai and R. P. Wei: Eng. Fract. Mech., 24 (1986), 803. https://doi.org/10.1016/0013-7944(86)90266-3
- 9) F. P. E. Dunne, A. J. Wilkinson and R. Allen: Int. J. Plast., 23 (2007), 273. https://doi.org/10.1016/j.ijplas.2006.07.001
- 10) F. Briffod, T. Shiraiwa and M. Enoki: Mater. Trans., 57 (2016), 1741. https://doi.org/10.2320/matertrans.M2016216
- 11) M. H. El Haddad, N. E. Dowling, T. H. Topper and K. N. Smith: Int. J. Fract., 16 (1980), 15. https://doi.org/10.1007/BF00042383
- 12) J. C. Newman, Jr.: Int. J. Fract., 24 (1984), R131. https://doi.org/10.1007/BF00020751
- 13) M. Vormwald and T. Seeger: Fatigue Fract. Eng. Mater. Struct., 14 (1991), 205. https://doi.org/10.1111/j.1460-2695.1991.tb00654.x
- 14) K. Tanaka, T. Hoshide and O. Maekawa: Eng. Fract. Mech., 16 (1982), 207. https://doi.org/10.1016/0013-7944(82)90150-3
- 15) J. Lankford: Eng. Fract. Mech., 9 (1977), 617. https://doi.org/10.1016/0013-7944(77)90074-1
- 16) F. Di Gioacchino and J. Quinta da Fonseca: Exp. Mech., 53 (2013), 743. https://doi.org/10.1007/s11340-012-9685-2
- 17) J. Carroll, C. Efstathiou, J. Lambros, H. Sehitoglu, B. Hauber, S. Spottswood and R. Chona: Eng. Fract. Mech., 76 (2009), 2384. https://doi.org/10.1016/j.engfracmech.2009.08.002
- 18) S. Rabbolini, S. Beretta, S. Foletti and M. E. Cristea: Eng. Fract. Mech., 148 (2015), 441. https://doi.org/10.1016/j.engfracmech.2015.07.070
- 19) T. Kaneko, M. Koyama, T. Fujisawa and K. Tsuzaki: ISIJ Int., 56 (2016), 2037. https://doi.org/10.2355/isijinternational.ISIJINT-2016-272
- 20) N. Kamikawa, M. Hirohashi, Y. Sato, E. Chandiran, G. Miyamoto and T. Furuhara: ISIJ Int., 55 (2015), 1781. https://doi.org/10.2355/isijinternational.ISIJINT-2015-106
- 21) N. Nakada, K.-i. Ikeda, H. Shuto, T. Yokoi, T. Tsuchiyama, S. Hata, H. Nakashima and S. Takaki: ISIJ Int., 56 (2016), 2077. https://doi.org/10.2355/isijinternational.ISIJINT-2016-310
- 22) H. Schreier, J.-J. Orteu and M. A. Sutton: Image Correlation for Shape, Motion and Deformation Measurements: Basic Concepts, Theory and Applications, Springer, New York, (2009), 280.
- 23) W. Elber: Eng. Fract. Mech., 2 (1970), 37. https://doi.org/10.1016/0013-7944(70)90028-7
- 24) K. Tokaji, T. Ogawa and T. Aoki: Fatigue Fract. Eng. Mater. Struct., 13 (1990), 31. https://doi.org/10.1111/j.1460-2695.1990.tb00574.x
- 25) M. Kinefuchi, Y. Akiniwa and K. Tanaka: Trans. Jpn. Soc. Mech. Eng., A, 56 (1990), 251 (in Japanese). http://doi.org/10.1299/kikaia.56.251
- 26) K. Tanaka and Y. Nakai: Fatigue Fract. Eng. Mater. Struct., 6 (1983), 315. http://doi.org/10.1111/j.1460-2695.1983.tb00347.x
- 27) M. Jono and A. Sugeta: JSME Int. J., Ser. A, 38 (1995), 355. https://doi.org/10.1299/jsmea1993.38.3_355
- 28) S. Kubo, T. Yafuso, M. Nohara, T. Ishimaru and K. Ohji: JSME Int. J., Ser. I, 32 (1989), 237. http://doi.org/10.1299/jsmea1988.32.2_237


