Abstract
To obtain the flow stress in duplex stainless steel, a duplex flow model is proposed that applies a rule of mixtures with the relationship between the volume fractions of austenite and ferrite. The model includes the saturated stress ratio λ and the volume fractions of austenite and ferrite at various temperatures. It considers the mechanical deformation and microstructural evolution with dynamic recrystallization (DRX) and dynamic recovery (DRV) of the two phases during hot working. To confirm the validity of the proposed model and new inverse analysis method, hot compression experiments were performed at deformation temperatures of 1050, 1150, and 1250°C and strain rates of 0.1, 1, and 10 s−1 with SUS329J4L, which is an austenite-ferrite duplex stainless steel. According to the flow curves, the softening rate from the peak stress was steeper with decreasing temperature from 1250 to 1050°C, corresponding to estimated austenite volume fractions from 33% (1250°C) to 61% (1050°C). Microstructural heterogeneity between DRX in the austenite and DRV in the ferrite was observed at deformation temperatures from 1050 to 1250°C, confirming that a clearly different restoration mechanism occurred in the two phases.
1. Introduction
Material flow stress is one of the most important properties in hot working. The flow stress is generally obtained by compression experiments; however, the experimental results may include the effects of internal-external heat transfer, friction, and heat generation caused by deformation during hot working, which must be compensated for in advance to determine the flow stress. Therefore, attempts have been made to describe isothermal flow stress by performing inverse analysis coupled with thermomechanical computer aided engineering (CAE). Kusiak et al.1) applied inverse analysis to evaluate the material parameters using the flow stress equation, and Yanagida et al.2) proposed an inverse analysis method for a bulk metal undergoing dynamic recrystallization.
From the material viewpoint, duplex stainless steels have excellent mechanical strength and corrosion resistance owing to their high Cr and Ni contents, with both austenite and ferrite phases coexisting in their microstructure, making them suitable for marine and petrochemical industrial applications, particularly those involving chlorides.3) To improve the production efficiency and quality of duplex stainless steel, accurate flow stress, one of the most important parameters in the fabrication process, is required. However, determination of the flow stress in duplex stainless steel is complex because the two principal phases coexist and behave dissimilarly during hot working, where they exhibit heterogeneous metallurgical and microstructural kinetic behaviors. This heterogeneity makes it difficult to determine the flow stress from the interaction between the work hardening and the softening in the two phases. At low strains, the FCC austenite and the BCC ferrite undergo strain hardening, and with gradually increasing strain and temperature, two restoration processes will occur complexly as a combinations of dynamic recovery (DRV) and dynamic recrystallization (DRX).
Owing to the higher stacking fault energy (SFE), restoration processes with DRV are found dominantly in the ferrite, whereas DRX is crucial and it accelerates the flow stress softening in the austenite because of its lower SFE. Cizek and Wynne4) reported the mechanism of ferrite softening in a duplex stainless steel, which was dominated by DRV in ferrite. Cizek5) reported that discontinuous dynamic recrystallization (dDRX), strain induced boundary migration (SIBM), and large-scale sub-grain coalescence were main roles to decrease flow stress of the austenite in 12Cr-10Ni-3Mo duplex stainless steel. Emami et al.6) investigated the behaviors of the austenite and ferrite phases in SAF2205 duplex stainless steel and reported that dissimilar behaviors occurred owing to the SFE. Kumar et al.7) reported that DRV is the prominent restoration process in ferrite with low values of the Zener-Hollomon parameters, whereas DRX is the prominent process in austenite with high values of the parameters.
To obtain duplex flow behavior, the methods based on the rule of phase mixtures have been applied to the deformation of a two–phase alloy in the plastic regime. Tomota et al.8) calculated the flow stress of Fe–Cr–Ni alloys from the results of tensile deformation tests. The tests were carried out on specimens with various volume fractions of alpha ferrite from 0 to 100%, and the effects of quenching and aging heat treatments were discussed. Jiang et al.9) reported work hardening theory and a dislocation pile–up model based on the rule of mixtures for the calculation of flow stress, and the microstructural parameters were determined for a dual–phase steel of ferrite and martensite. Spigarelli et al.10) investigated the high–temperature workability of 2205 duplex stainless steel by using the rule of mixtures to calculate the dependence of the peak flow stress on the strain rate and temperature. Momeni et al.11) investigated the effect of the chemical composition on the flow behaviors of brass alloys and they compared their experimental results and their values predicted by the rule of mixtures. Li et al.12) investigated the hot flow behaviors of 2205 duplex stainless steel and a low–carbon steel bimetal composite and compared the results of an FE simulation with those obtained by their proposed constitutive model and the rule of mixtures.
Although these previous studies were successful, they did not fully consider the uncontrollable effects caused by the experiments and microstructural evolution when a larger strain is applied, at which saturated and steady–state stress occurs with equilibrium among work hardening, dynamic recovery, and dynamic recrystallization. Moreover, these effects occur in different manners in the austenite and ferrite of duplex stainless steel. Thus, the features of this study are summarized as follows.
1) A new duplex flow stress model was proposed in the constitutive form, which explains the separate work hardening and softening behaviors of the austenite and ferrite. The rule of mixtures was applied to represent the behaviors using the parameters of constitutive functions by compensating for stress partitioning with various volume fractions of phases and various temperatures.
2) Hot compression tests and microstructural observations were performed to verify the model, assuming that dissimilar behaviors occur in the austenite and ferrite phases during hot working.
3) The relationship between the stresses of austenite and ferrite was defined, and the ratio (λ) between the stresses was derived by simulation and mathematical methods for various chemical compositions.
4) Inverse analysis was performed to obtain the flow stress in duplex stainless steel using the proposed constitutive flow stress model, which was coupled with thermomechanical CAE as a countermeasure against uncontrollable experimental effects of the internal–external heat transfer, friction, and heat generation arising from the deformation of the specimen under hot working.
2. Experimental Procedure
Commercial grade SUS329J4L austenite–ferrite duplex stainless steel was obtained in the form of extruded rods of 8 mm diameter. This super duplex grade has both high corrosion resistance and excellent mechanical strength. The chemical composition is presented in Table 1. Test specimens with a height of 12 mm were cut from the rods.
Table 1. Chemical composition of SUS329J4L steel (wt.%).
| Fe | Cr | Ni | Mo | Mn | Si | Co | C | N | P |
|---|
| 64.01 | 24.79 | 6.84 | 2.83 | 0.69 | 0.5 | 0.16 | 0.015 | 0.14 | 0.024 |
The THERMECMASTOR Z, high–speed compression–testing machine, was used in the tests. Compression tests were performed to obtain load–reduction data at different temperatures, strains, and strain rates. Figure 1 shows the test conditions and the thermomechanical time–temperature profile employed in the compression test. The specimens were heated by induction coils and the temperature was controlled by a PID (proportional–integral–derivative) controller through the feedback signal from an R–type thermocouple welded to the specimen. Mica sheets were placed between the dies and specimen to reduce both the friction and heat transfer to the dies. Nitrogen gas was used as an inert atmosphere to prevent the oxidation of the specimen at elevated temperatures. The specimen was heated at a constant rate of 10°C s−1 up to the target temperature then held at this temperature for 3 min to homogenize the temperature distribution. After that, the specimens were compressed up to a reduction ratio of 75% at temperatures of 1050, 1150, and 1250°C and strain rates of 0.1, 1, and 10 s−1. After compression, the specimen was water–quenched to freeze the microstructure. For each experimental condition, two identical experiments were performed to ensure the reproducibility of the experimental results.

To investigate the microstructures of the tested specimens, they were cut in half along their compression axis before and after the hot compression tests. The surface of the cut specimens was polished using 0.04 µm OP–U nondrying colloidal silica suspensions. The microstructures of the samples were examined by electron backscattering diffraction (EBSD) using a field–emission scanning electron microscope (FE–SEM, JEOL 7100F) operated at 13 kV that was equipped with a TSL orientation microscopy (TSL OIM) system.
Figure 2 shows the initial microstructure of the as–received SUS329J4L with an average grain size of 9.5 μm. The average volume fractions of austenite and ferrite at four different locations were 47.2% and 52.8%, respectively. EBSD inspections were carried out over an area of 150 × 150 μm2 and the step size was 0.25 μm. The softer ferrite phase flowed around the harder austenite phase, and the two phases interfaced with each other, forming a γ/δ grain boundary, which has a lower interface energy than the grain boundaries of γ/γ and δ/δ as demonstrated by Reick et al.13) The two phases were aligned in the extrusion direction by deformation and the orientation of grains in the austenite was more varied than that of grains in the ferrite as shown in Figs. 2(a) and 2(b).
3. Inverse Analysis Coupled with Thermomechanical CAE to Obtain Flow Stresses
The flow stress cannot be determined directly from the experimental data obtained from the hot compression test because the specimens are affected by several factors such as internal–external heat transfer, friction, and heat generation originating from the deformation of the specimen under hot working. An uneven heat distribution of the specimen will occur because of not only the deviation in the magnetic flux density of the induction coils and the geometrical characteristics of the specimen and coils but also the heat dissipation during plastic deformation. Moreover, heat transfer from the specimen to the dies and air is inevitable, which mainly occurs near the contact areas of the specimen, mica, and dies as shown in Fig. 3(a). Thus, the temperature distribution inside the specimen must be considered to calculate the flow stress using the experimental data obtained from the hot compression test. Moreover, the strain distribution, as shown in Fig. 3(b), must also be calculated, which is continuously changing with the reduction ratio at all node positions. Consequently, inverse analysis is required to accurately determine the flow stress, which is carried out together with the thermomechanical CAE including high–frequency induction heating. For the inverse analysis of duplex stainless steel, the heterogeneous combination of dissimilar flow stresses of austenite (γ) and ferrite (δ) is required to express the different material deformation behaviors and microstructural evolutions of DRX and DRV during the deformation. The mesh system shown in Fig. 3 was used for thermomechanical CAE. CAE analysis was repeated until the final stroke of compression. The thermomechanical algorithms used in the CAE were the modification of the Fortran code previously used by Yanagida et al.2) The model proposed in this research was applied to calculate the stress of each node at each compression step up to a reduction ratio of 75% in increments of 1%.

The deformation behavior of two–ductile–phase alloys is heterogeneous. It is affected by the chemical composition, microstructural morphology, phase configuration, and interactions between phases as demonstrated by Ankem et al.14) Under applied strain, the relatively hard austenite is subjected to more stress and the ferrite is subjected to more strain. The heterogeneity in the two phases before and after the compression is illustrated in Fig. 4.

Figures 4(a) and 4(b), respectively, shows the initial equiaxed grains subjected to the compressive force in the direction of the arrows and the shapes of compressed grains. Recrystallization more occurs in the austenite region because dynamic recrystallization is likely to occur in austenite, which has a lower SFE. In the ferrite, the accumulated dislocations are softened by restoration through DRV and continuous dynamic recrystallization (cDRX) according to a previous study by Cizek and Wynne.4) When the strain exceeds a critical value, the austenite is softened effectively by DRX at grain interfaces γ/γ and γ/δ, which act as preferential sites for discontinuous DRX nuclei as demonstrated by Reick et al.13)
The rate of work hardening relative to softening changes with the strain. In the ferrite, softening takes place in the process in which the annihilation of dislocations and rearrangement occur together as reported by Gao et al.15) According to Balancin et al.,16) this leads to the formation of a complex network of subgrain boundaries and cDRX. Therefore, the saturated work hardening in an equilibrium state leads to a plateau of flow stress, as shown by the red dashed line in Fig. 5(a), owing to the balance between dislocation generation and annihilation as reported by Kocks.17) Of course in few cases, DRX and austenite reversion have been observed in the ferrite as reported by Cheng et al.18)

On the other hand, in the austenite, DRX is prominent owing to its lower SFE, which is activated by nucleation around γ/γ and γ/δ grain boundaries. After the critical strain is reached, DRX leads to the softening of flow stress and generates a peak stress as reported by Poliak and Jonas.19) When the strain is further increased, the deformation reaches the equilibrium stage where the work hardening and softening are balanced, where the stress partitioning ratio converges to a constant value,20) as shown by the green dashed line in Fig. 5(a).
These different softening mechanisms produce the three types of flow stress shown in Fig. 5(a). After DRV softening starts, ∂σ/∂ε decreases and usually approaches zero, as shown in Fig. 5(b), and finally, ∂σ/∂ε saturates to zero with balanced hardening and softening by DRV. This type of flow stress in DRV follows the red dashed line in Fig. 5(a). On the other hand, the green dashed line in Fig. 5(a) shows that DRX softening is more dominant. In DRX, ∂σ/∂ε is less than zero and also the flow stress converges to the steady–state stress, as shown in Fig. 5(c).
3.2. Constitutive Flow Stress Equations for the Duplex Stainless Steel
In general, a constitutive equation of flow stress is given as a function of strain, strain rate, and temperature as Eqs. (1) and (2), where m, A, and T0 are the strain, temperature sensitivity, and reference temperature, respectively. Considering the flow stresses in an alloy undergoing work hardening, DRV, and DRX, the flow stress model can be written as Eq. (3) because it expresses the important physical events of critical strain (εc), peak strain (εp), and steady–state stress (F3). Thus, it is suitable for describing the flow stress of most alloys undergoing dynamic recrystallization.2)
|
σ
¯
=
σ
¯
(C,
ε
¯
,
ε
¯
˙
, T)
| (1) |
|
σ
¯
*
=
σ
¯
ε
¯
˙
m
exp(
A
T
)
exp(
A
T
0
)
| (2) |
|
σ
¯
={
F
1
ε
¯
n
(
ε
¯
<
ε
¯
c
)
F
2
exp[
a
(
ε
¯
-
ε
¯
p
)
2
]+
F
3
(
ε
¯
≥
ε
¯
c
)
| (3) |
However, it is difficult to apply Eq. (3) to the saturated type of stress with DRV with hardly any DRX occurring in the ferrite phase of duplex stainless steel, where it saturates without a peak stress. Thus, a new expression for the flow stress should be introduced by using an additional model to express the saturated stress (σsat) of the ferrite phase (δ). To derive this expression for DRV, it is necessary to consider the relationship between work hardening and dislocation density, expressed in Eq. (4), where ρ and a are the dislocation density and material constant, respectively, because the tendency of dynamic recovery during hot working is dependent on the changes in dislocation density.
Also, the change in dislocation density with respect to the time
t can be assumed to be proportional to the dislocation density as expressed by
27)
where
bD is the rate of dynamic recovery and
a is material constant. Since the dislocation density (
ρ) is dependent on the strain and time,
Eq. (6) can be derived.
21)
|
dρ=
∂ρ
∂
ε
¯
d
ε
¯
+
∂ρ
∂t
dt
| (6) |
The solution of
Eqs. (5) and
(6) can be expressed by the strain and strain rates, as shown in
Eq. (7). Finally, applying
Eqs. (7) to
(4) yields
Eq. (8) with the boundary condition when
ε is 0 or ∞, the corresponding stress
σ is 0 or
σδ,sat, respectively.
|
ρ=
c
b
D
ε
¯
˙
[
1-exp(
-
b
D
t
)
]+
ρ
0
exp(
-
b
D
t
)
| (7) |
|
σ
¯
=a
{
c
b
D
ε
¯
˙
[
1-exp(
-
b
D
ε
¯
˙
ε
¯
)
]+
ρ
0
exp(
-
b
D
ε
¯
˙
ε
¯
)
}
1
2
| (8) |
The dynamic recovery model for the ferrite phase of duplex stainless steel is obtained by
Eq. (9), where
ρ0 is initial dislocation density and
c is material constant.
σδ,sat can be obtained by
(
c/
b
D
×
ε
¯
˙
)
1
2
from the calculation with the boundary condition.
Equation (9) can be utilized for DRV-type flow stress because it includes saturated stress (
σδ,sat).
Equations (3) and
(9) can be used to combine the stresses of austenite and ferrite to determine the flow stress of duplex stainless steel.
|
σ
¯
=
σ
¯
δ,sat
{
1-exp(
-
b
D
ε
¯
˙
ε
¯
)
}
1
2
| (9) |
The constitutive equation of an austenitic metal undergoing DRX can easily be defined by Eq. (3) and that of a ferrtic metal undergoing DRV can be defined by Eq. (9). Thus, the constitutive equation for the combination of the two phases in the duplex stainless steel is introduced by considering the stress partitioning ratio between Eqs. (3) and (9). Each flow stress of the austenite and the ferrite cannot be determined separately because we can measure one axial stress of a material that is a mixture of two phases by the hot compression test. Thus, λ was introduced to determine the stress relationship between the two phases, as given by Eq. (10).
|
σ
¯
γ,sat
=λ
σ
¯
δ,sat
| (10) |
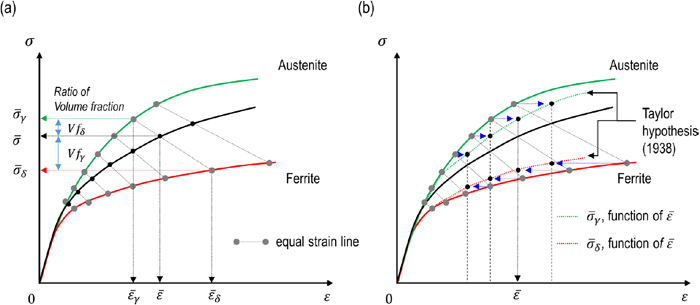
In this paper, we defined λ as the ratio between the saturated stresses σγ,sat and σδ,sat in the balanced regime of work hardening and softening by dynamic recovery. Since DRX occurs in the austenite grains of duplex stainless steel, the saturated stress in the austenite cannot be obtained directly from experimental data; the saturated stress σγ,sat can be calculated for the austenite by the mathematical tangential extrapolation shown in Fig. 5(c). Although the stress partitioning of the two phases continuously changes with the strain, it can be assumed to be a constant ratio when it reaches the equilibrium state. A schematic plot of λ, the ratio between σγ,sat and σδ,sat is illustrated in Fig. 6.

The rule of mixtures can be applied to the saturated stress by using Eq. (11). Iγ/δ is the interaction effect on the application of the rule of mixtures. There are cases when it is reasonable to consider Iγ/δ as zero owing to net effect of positive and negative interactive stresses between the two phases of austenite and ferrite. Of course, this assumption of Iγ/δ = zero does not mean that there is no interaction. It simply means that the resulting net interaction is negligible as mentioned by Ankem et al.14) As a result, the Eq. (11) can be simplified to Eq. (12).
|
σ
¯
sat
=
σ
¯
γ,sat
×V
f
γ
+
σ
¯
δ,sat
×V
f
δ
+
I
γ/δ
| (11) |
|
σ
¯
sat
=
σ
¯
γ,sat
×V
f
γ
+
σ
¯
δ,sat
×V
f
δ
| (12) |
λ can be determined by solving Eq. (12) by comparing the changes in saturated stress (σsat) for various volume fractions Vfγ and Vfδ, as shown in Fig. 7. The changes in the volume fractions were simulated by varying the Cr and Ni contents by increments of 0.5 wt.% starting from 25% Cr and 7% Ni, where Cr acts as a ferritic former and Ni acts as an austenitic stabilizer. Higher contents of Ni and lower contents of Cr were selected to increase Vfγ, and lower contents of Ni and higher contents of Cr were selected to increase Vfδ, as respectively shown in Figs. 8(a) and 8(b). Since small changes in the composition ensure linear changes in stress, λ can be calculated by the regression method with Eq. (13) or (14).
|
σ
¯
sat
/
σ
¯
δ,sat
=
σ
¯
γ,sat
/
σ
¯
δ,sat
×V
f
γ
+V
f
δ
| (13) |
|
σ
¯
sat
/
σ
¯
δ,sat
=(
λ-1
)
×V
f
γ
+1
| (14) |

The stress variation obtained by JMatPro for various Vfγ and Vfδ is plotted in Fig. 9, and it can be seen that increasing the Ni content increases Vfγ and increasing the Cr content increases Vfδ because Ni acts as an austenitic stabilizer and Cr acts as a ferritic former. Since these variations result in changes in the saturated flow stress (σsat) of the duplex stainless steel, the contributions of σγ,sat and σδ,sat to σsat can be obtained from the values of the simulated Vfγ and Vfδ by Eqs. (12) and (13). Although the absolute values of σsat have errors, the ratio σsat/σδ,sat, which we used in the equations, guarantees much more accuracy than the absolute values owing to the effect of scaling. In addition, since very small variations of chemical compositions were selected to the target composition as presented in Fig. 7, it guarantees better linearity to avoid other possible effects by solid solutions or precipitations.

For the calculation of σsat, the software JMatPro was used, and the results correspond to the stress–strain curve obtained using Eq. (15) with its own coefficient in the dominant dislocation glide (DDG) before the peak stress. It was only used flow data obtained by JMatPro before peak stresses excluding data after peak stresses because the results after peak stresses may include undesireable data to obtain saturated stress σsat.
where
K is the material coefficient,
n is the work hardening exponent, and
m is the strain rate sensitivity. There are two unknown variables of
σγ,sat and
σδ,sat or
λ and
σδ,sat, as expressed in
Eqs. (13) and
(14). And there are three known variables of
Vfγ,
Vfδ, and
σsat obtained by the simulations of the software. The saturated stress
σsat of duplex stainless steel was calculated by the regression method by using the data before peak data of the software and
Eq. (9). The results are presented in
Fig. 9. By using these seven results of varied chemical compositions, the two unknown variables were solved by the method explained in
Fig. 7. Thus, the stress ratio
λ can be calculated and the results are plotted in
Fig. 10. The
λ tends to increase with decreasing temperature (°C). The obtained
R2 values are 0.959, 0.976, and 0.991 at the temperatures of 1050, 1150, and 1250°C, respectively; thus it can be concluded that the values of
λ are reasonable.
3.4. Inverse Analysis to Obtain the Duplex Flow Stress
Inverse analysis of the duplex stainless steel requires the additional consideration of the microstructural difference in the austenite and ferrite phases during the hot deformation. To incorporate this difference in the main softening mechanism based on dynamic recrystallization in austenite and dynamic recovery in ferrite, the general rule of mixtures can be given by Eq. (16). Regarding strain partitioning, Taylor hypothesis (1938) of uniform strain22) was applied to simplify the strain relationship between two phases, so the strain partitioning can be assumed to be given as Eq. (17). The hypothesis is that each grain conforms to the macroscopic strain imposed on the bulk, which can allow to use mathematical functions of a same parameter ε. Then equation σ(ε) in Eq. (16) is depending on two constituent flow stresses and volume fractions of austenite and ferrite. It is more acceptable at the regime of equilibrium stresses because the change of strain cannot affect anymore to change of stresses due to convergences of stresses (∂σ/∂ε = 0).
|
σ
¯
(
ε
¯
)
=
σ
¯
γ
(
ε
¯
)
×V
f
γ
+
σ
¯
δ
(
ε
¯
)
×V
f
δ
| (16) |
Since the strain partitioning was simplified, as shown in
Figs. 11(a) and 11(b), it allows the use of a constitutive function with an equal strain (
ε) as functions of
σγ(
ε) and
σδ(
ε).
Finally, the constitutive stresses σγ(ε) and σδ(ε) for each phase are given by Eqs. (18) and (19), respectively.
|
σ
¯
γ
(
ε
¯
)
={
F
1
ε
¯
n
(
ε
¯
<
ε
¯
c
)
F
2
exp[
a
(
ε
¯
-
ε
¯
p
)
2
]+
F
3
(
ε
¯
≥
ε
¯
c
)
| (18) |
|
σ
¯
δ
(
ε
¯
)
=
σ
¯
γ,sat
λ
{
1-exp(
-
b
D
ε
¯
˙
ε
¯
)
}
1
2
| (19) |
σγ(ε) is an equation that well describes the DRX effect of the γ–phase, whereas σδ(ε) is in good agreement with DRV of the δ–phase of duplex stainless steel. Here, F1, n, εc, F3, and bD are five independent parameters and F2, a, and εp are dependent parameters determined by the first and second order mathematical continuity of Eq. (18) which was presented in the work of Yanagida et al.2) σγ,sat is a dependent on F1, n, εc, and
∂
σ
¯
γ
∂
ε
¯
as described in Fig. 5(c). The volume fractions of Vfγ and Vfδ were used by predetermined values presented in Fig. 13(b). Calculated λ of 4.85, 2.66, and 2.05 were used at the target temperatures of 1050, 1150, and 1250°C, respectively.

The overall inverse analysis process in this research is shown in Fig. 12. For the optimization methods used in nonlinear problems, we set parameter set C which consists of the above five independent parameters. C can be optimized by changing values with iteration loops. From the initial designations of the parameters, iterations of the main process while changing C<k> are conducted until the termination conditions are satisfied to find the optimized solution. Except for the proposed duplex constitutive equation in this research, the overall procedure is the same as that in the work of Yanagida et al.2)
4. Results and Discussion
4.1. Flow Curves of Duplex Stainless Steel Subjected to Hot Compression
The results of the axial stress obtained by the compression test are shown in Fig. 13(a). The stress in the experiments decreased with increasing temperature and decreasing strain rate, indicating that higher temperatures and lower strain rates can accelerate the softening process with DRV and DRX. Both higher temperatures and lower strain rates not only allow higher mobility at grain boundaries and a longer time for energy accumulation at dislocations, but also promote the nucleation and growth of DRX grains.23) Because DRX softening occurs around the γ/γ and γ/δ grain boundaries, its effect decreases along with a decrease in the austenite phase fraction with increasing temperature.24) The experimental results of axial stress in Fig. 13(a) show that the DRX softening rate tends to depend on Vfγ by the comparison between Figs. 13(a) and 13(b). Although the test results of axial stress-strain relationship involve the uncontrollable effects such as uneven temperature and strain distribution of the specimen, there are some information to explain those relationship. The softening rate from the peak stress plotted by green arrows in Fig. 13(a) becomes steeper with decreasing deformation temperature from 1250 to 1050°C. The decrease from the peak stress was in good agreement with Vfγ values of 61% (1050°C), 49% (1150°C), and 33% (1250°C). Because the work hardening ratio ∂σ/∂ε in the austenite starts to decrease, reaching zero and even becoming negative whereas the ratio ∂σ/∂ε in the ferrite does not become negative, the shape of the curve for 1250°C has a plateau without a peak stress due to a higher Vfδ. The Vfγ in Fig. 13(b) was calculated from the chemical composition in Table 1 at various temperatures from 600 to 1500°C in increment of 10°C.
4.2. Flow Curves of Duplex Stainless Steel Obtained by Inverse Analysis
The results of inverse analysis by the procedure in Fig. 12 are presented in Fig. 14, and the values of the five parameters and errors are presented in Table 2. The obtained flow stresses show that the higher the temperature, the smaller the difference between σγ(ε) and σδ(ε), as shown in Fig. 14. It is considered that the higher the temperature, the less the stress is partitioned, corresponding to the λ value, because of the effect of the decreased difference between σγ and σδ at higher temperatures. The higher the strain rate, the more the stress is partitioned, because the different softening time has different relaxation effects on σγ and σδ. Moreover, the difference in the partitioned stress between σγ and σδ increases at lower temperatures, which confirms that the stress partitioning decreases with increasing temperature. The calculated σ is more affected by σγ than by σδ at the temperature of 1050°C, whereas σ is closer to σδ at the temperature of 1250°C, which is related to the changes in Vfγ with the temperature.

Table 2. Values of five parameters.
| Temperature °C | Strain rate s−1 | bD | F1 | n | εc | F3 | error % |
|---|
| 1050 | 0.1 | 11.73 | 159.7240 | 0.0072 | 0.0522 | 79.8886 | 2.35 |
| 1 | 29.70 | 189.4749 | 0.0100 | 0.0936 | 162.0758 | 1.35 |
| 10 | 88.74 | 235.0002 | 0.0189 | 0.1496 | 159.0479 | 0.48 |
| 1150 | 0.1 | 13.28 | 89.0364 | 0.0056 | 0.0559 | 46.4847 | 2.32 |
| 1 | 59.61 | 112.1247 | 0.0213 | 0.1070 | 88.4842 | 1.43 |
| 10 | 196.34 | 126.5685 | 0.0012 | 0.0333 | 116.8452 | 1.11 |
| 1250 | 0.1 | 26.79 | 44.8854 | 0.0546 | 0.0791 | 39.6778 | 2.20 |
| 1 | 135.00 | 50.8990 | 0.0104 | 0.0571 | 49.1969 | 1.09 |
| 10 | 385.26 | 73.3314 | 0.0150 | 0.0825 | 51.6419 | 1.90 |
The calculated load-reduction data by inverse analysis are in good agreement with experimental data presented in Fig. 15. This is providing validation of the method by the procedure of inverse analysis with the proposed flow curve model of the duplex stainless steel by consideration of the microstructural difference in the austenite and ferrite phases during the hot deformation.
4.3. Microstructural Observation and Verification of Softening Mechanism
EBSD investigation was performed to verify the different microstructural evolutions, i.e., DRX is the main softening mechanism in austenite and DRV is dominant in ferrite, using three specimens deformed at temperatures of 1050, 1150, and 1250°C with a strain rate of 0.1 s−1 and a height reduction rate of 75% (an average strain of 1.386). The specimens were observed at the center of a cross section perpendicular to the compression direction over an area of 40 × 40 μm2 with a step size of 0.15 μm.
Figure 16 shows the inverse pole figures (IPF), misorientation, and grain size distribution of the austenite and ferrite in the duplex stainless steel after compression. In the austenite regime, serrated and equiaxed grains having high–angle grain boundaries, and triple junctions of grain boundaries can be observed confirming the occurrence of dynamic recrystallization.23) Comparing the misorientation maps of austenite with those of in ferrite, equiaxed grains having high–angle grain boundaries were clearly present, and triple junctions and grain boundary bulging were also observed in the former, which commonly occur in the regime of nucleation for dynamic recrystallization. In contrast, in the ferrite regime, subgrain structures including low–angle grain boundaries can be observed, and triple–grain junctions or serrated–grain bulging was hardly present, which means that dynamic recrystallization hardly occurs and dynamic recovery is dominant. In the ferrite, the subgrains were created with textures in the <001>//RD and <111>//ND directions as reported in the previous publications.25,26)

In addition, the average grain sizes in austenite (1.91, 2.85, and 5.67 μm at 1050, 1150, and 1250°C, respectively) were much smaller than those in ferrite (6.72, 13.74, and 22.97 μm at 1050, 1150, and 1250°C, respectively), confirming that the dynamic recrystallization in the austenite and the dynamic recovery in the ferrite of duplex stainless steels are the dominant softening mechanisms during the hot working. Therefore, it can be concluded that the separation and mixture combination between the two flow stresses of the austenite and ferrite must be considered.
5. Conclusions
A new method was proposed for considering the relationship between the saturated stress ratio λ and volume fractions of austenite and ferrite at various temperatures to determine the flow stress of duplex stainless steel. The method was applied to inverse analysis to obtain the flow stress of duplex stainless steel (SUS329J4L) during hot working. The main achievements can be summarized as follows:
(1) The proposed duplex flow model, which is a function of an equal strain (ε) as a parameter, could express the different softening mechanisms in duplex stainless steel, with mainly DRX in austenite and DRV in ferrite.
(2) The ratio of saturated stress partitioning (λ) between σγ,sat and σδ,sat was defined as that in the equilibrium state, which was calculated from the simulated relative stresses obtained while changing the volume fraction of each phase.
(3) Inverse analysis coupled with CAE in duplex stainless steel (SUS329J4L) was performed with five independent parameters, F1, n, εc, F3, and bD, and provided a description of the heterogeneous flow stresses of austenite and ferrite.
(4) EBSD analysis showed the heterogeneity of the microstructural evolution (DRV and DRX), which confirmed that different softening mechanisms occurred in the γ and δ phases.
References
- 1) J. Kusiak, R. Kawalla, M. Pietrzyk and H. Pircher: J. Mater. Process. Technol., 60 (1996), 455. https://doi.org/10.1016/0924-0136(96)02370-9
- 2) A. Yanagida, J. Liu and J. Yanagimoto: Mater. Trans., 44 (2003), 2303. https://doi.org/10.2320/matertrans.44.2303
- 3) J.-O. Nilsson: Mater. Sci. Technol., 8 (1992), 685. https://doi.org/10.1179/mst.1992.8.8.685
- 4) P. Cizek and B. P. Wynne: Mater. Sci. Eng. A, 230 (1997), 88. https://doi.org/10.1016/S0921-5093(97)00087-7
- 5) P. Cizek: Acta Mater., 106 (2016), 129. https://doi.org/10.1016/j.actamat.2016.01.012
- 6) S. Emami, T. Saeid and R. Azari Khosroshahi: J. Alloy. Compd., 739 (2018), 678. https://doi.org/10.1016/j.jallcom.2017.12.310
- 7) A. Kumar, A. Gupta, R. K. Khatirkar, N. Bibhanshu and S. Suwas: ISIJ Int., 58 (2018), 1840. https://doi.org/10.2355/isijinternational.ISIJINT-2018-051
- 8) Y. Tomota, K. Kuroki, T. Mori and I. Tamura: Mater. Sci. Eng., 24 (1976), 85. https://doi.org/10.1016/0025-5416(76)90097-5
- 9) Z. Jiang, J. Liu and J. Lian: Acta Metall. Mater., 40 (1992), 1587. https://doi.org/10.1016/0956-7151(92)90101-J
- 10) S. Spigarelli, M. El Mehtedi, P. Ricci and C. Mapelli: Mater. Sci. Eng. A, 527 (2010), 4218. https://doi.org/10.1016/j.msea.2010.03.029
- 11) A. Momeni, G. R. Ebrahimi and H. R. Faridi: Mater. Sci. Eng. A, 626 (2015), 1. https://doi.org/10.1016/j.msea.2014.12.016
- 12) Z. Li, J. Zhao, F. Jia, Y. Lu, Q. Zhang, S. Jiao and Z. Jiang: Int. J. Mech. Sci., 169 (2020), 105317. https://doi.org/10.1016/j.ijmecsci.2019.105317
- 13) W. Reick, M. Pohl and A. F. Padilha: ISIJ Int., 38 (1998), 567. https://doi.org/10.2355/isijinternational.38.567
- 14) S. Ankem, H. Margolin, C. A. Greene, B. W. Neuberger and P. G. Oberson: Prog. Mater. Sci., 51 (2006), 632. https://doi.org/10.1016/j.pmatsci.2005.10.003
- 15) F. Gao, B. Song, Y. Xu and K. Xia: Metall. Mater. Trans. A, 31 (2000), 21. https://doi.org/10.1007/s11661-000-0048-8
- 16) O. Balancin, W. A. M. Hoffmann and J. J. Jonas: Metall. Mater. Trans. A, 31 (2000), 1353. https://doi.org/10.1007/s11661-000-0254-4
- 17) U. F. Kocks: J. Eng. Mater. Technol., 98 (1976), 76. https://doi.org/10.1115/1.3443340
- 18) G. Cheng, B. Gault, C. Huang, C. Huang and H. Yen: Acta Mater., 148 (2018), 344. https://doi.org/10.1016/j.actamat.2018.01.060
- 19) E. I. Poliak and J. J. Jonas: Acta Mater., 44 (1996), 127. https://doi.org/10.1016/1359-6454(95)00146-7
- 20) J. J. Jonas, X. Quelennec, L. Jiang and É. Martin: Acta Mater., 57 (2009), 2748. https://doi.org/10.1016/j.actamat.2009.02.033
- 21) T. Senuma, H. Yada, Y. Matsumura, S. Hamauzu and K. Nakajima: Tetsu-to-Hagané, 70 (1984), 1392 (in Japanese). https://doi.org/10.2355/tetsutohagane1955.70.10_1392
- 22) G. I. Taylor: J. Inst. Met., 62 (1938), 307.
- 23) T. Sakai, A. Belyakov, R. Kaibyshev, H. Miura and J. J. Jonas: Prog. Mater. Sci., 60 (2014), 130. https://doi.org/10.1016/j.pmatsci.2013.09.002
- 24) R. Wang and T. C. Lei: Mater. Sci. Eng. A, 165 (1993), 19. https://doi.org/10.1016/0921-5093(93)90622-L
- 25) H. W. Park and J. Yanagimoto: Mater. Sci. Eng. A, 567 (2013), 29. https://doi.org/10.1016/j.msea.2012.12.061
- 26) H. W. Park, K. Shimojima, S. Sugiyama, H. Komine and J. Yanagimoto: Mater. Sci. Eng. A, 624 (2015), 203. https://doi.org/10.1016/j.msea.2014.11.070
- 27) R. Sandström: Acta Metall., 25 (1977), 897. https://doi.org/10.1016/0001-6160(77)90176-6