1. Introduction
Large blast furnaces have an advantage of high productivity but require high-strength and high-quality iron burden materials to suppress unstable operations. Due to this requirement, more energy is consumed in pellet production, sintering processes, etc. in order to improve the strength of the burden materials. Thus, improvements to the blast furnace ironmaking process necessitate considerations of both energy and resource usage.
A proposed solution is the oxygen blast furnace process, which is a new method of iron-making that uses pure oxygen instead of hot blast in a normal blast furnace.1,2,3,4,5) A major feature of an oxygen blast furnaces is that the top gas used contains almost no nitrogen, which makes it possible to generate a top gas with a high calorific value.4) Thus, the combustion efficiency of pulverised coal in an oxygen blast furnace is increased by blowing pure oxygen. The improved efficiency means a large amount of pulverised coal can be blown from the tuyere, and the coke ratio can be reduced accordingly. Furthermore, the oxygen blast furnace is characterised by a high tapping ratio. Generally, the upper limit of the pig iron ratio of a blast furnace is the flooding limit of the slag or ore. Because the oxygen blast furnace operates under conditions that do not contain nitrogen, the concentration of reducing gas increases and the amount of Bosch gas decreases, so the flooding conditions at the bottom of the furnace are relaxed. In addition, a large reduction rate can be obtained with a high-concentration reduction gas. Owing to these characteristics, the restrictions on the pig iron ratio are relaxed in the oxygen blast furnace operating conditions, and a high pig iron ratio operation becomes possible.
In an oxygen blast furnace trial using an experimental blast furnace, it was confirmed that the oxygen blast furnace could operate at a high pig iron ratio of approximately twice that of a normal blast furnace, with a maximum pig iron ratio of 5.1 t/m3·d.5) Owing to the higher productivity of the oxygen blast furnace compared to the standard blast furnace process, the internal volume can be reduced while maintaining the same productivity. Reducing the internal volume of the blast furnace can be considered effective in reducing the load on charged raw materials and suppressing radial non-uniformity. Owing to the low strength and poor reducibility of lump ore compared to sintered iron ore, it is generally not used in current blast furnace operation. If oxygen blast furnaces become widespread, the charging ratio of lump ore with lower strengths than that of pellets and sintered iron ore may be increased. In other words, the oxygen blast furnace process is a new energy-saving technology that reduces the agglomeration energy required for processing iron materials.
Appropriate control of the cohesive zone in a blast furnace is one of the most important factors for stable operation.6) To increase the lump ore charge ratio, an accurate understanding of the softening and melting behaviour of lump ore at the cohesive zone in an oxygen blast furnace is necessary. As lump ore contains almost no basic oxide, the slag produced from it is low in basicity and high in viscosity. When using lump ore in a blast furnace, limestone must first be charged to adjust the basicity of the slag appropriately. Therefore, understanding the reaction mechanism between lump ore and limestone is necessary to expand the amount of lump ore that can be used in an oxygen blast furnace.
Since the 1970s, many studies have reported on the controlling factors of the softening and melting behaviour of iron burden materials in the lower part of the blast furnace with reduction and softening tests under loading conditions.7,8,9,10,11,12,13,14)
Ono et al.7) reported that melting and dripping temperatures of iron ore are closely related to the amount of gangue, the melting point of gangue, and the reduction rate of iron ore. In general, iron ores with a large amount of high melting point gangue have a high dripping start temperature, but when a slag with a low reduction rate and a high wustite ratio is produced, the dripping start temperature is lowered. One of the main reasons for the difference in the softening and melting behaviour of the ore layer is the formation behaviour of molten slag due to the reaction between the gangue components and/or between the gangue component and iron oxide. If a large amount of molten slag is formed at a lower temperature, the softening start temperature decreases. This behaviour increases the cohesive zone and increases the gas pressure drop.10)
Various studies on the effects of limestone on slag formation from iron ore have been reported, including: CaO as a raw material component of the sintered iron ore making process,15) CaO additive to pellets,16,17) and the reaction of sintered iron ore, as a CaO fluxed iron burden material, with pellets and lump ore.18,19) However, very few reports that include observation of the reaction between melt produced from lump ore and limestone under blast furnace conditions exist.
In this study, lump ore and CaO were brought into contact under conditions that partially imitated the inside of an oxygen blast furnace, and the slag formation behaviour under high-temperature load conditions was evaluated. To focus only on the slag formation behaviour at the lump ore and limestone interface, the softening and melting behaviour of pre-reduced lump ore in contact with CaO was evaluated in the cohesive zone temperature range in an inert atmosphere.
2. Experimental Method
In this study, lump ore that had been pre-reduced in a reducing atmosphere under oxygen blast furnace conditions was brought into contact with CaO under load conditions, and the slag formation mechanism with various lump ores was investigated.
As shown in Fig. 1,20) the apparatus used in this study has a sample pushing device and a sample shrinkage measuring unit in the upper stage, an infrared image heating furnace and a silica reaction tube in the middle stage, and an elevating mechanism for the sample crucible and sample rapid cooling dry chamber in the lower stage.
The combination of an infrared image heating furnace, ascending and descending sample stage, rapid cooling dry chamber, and quartz reaction tube rich in thermal shock resistance allows this new apparatus to be used with rapid heating and quenching experimental conditions that are impossible with conventional load softening test equipment.
To investigate the slag formation behaviour of the lump ore and CaO in the cohesive zone, three types of lump ore were prepared: hematite ore (H ore), goethite ore (G ore), and dense hematite ore (D-H ore). The chemical composition of each ore is listed in Table 1. Each ore was pre-reduced under a reducing atmosphere in typical blast furnace reduction condition before softening and melting temperature region as shown in Fig. 2.
Table 1. Chemical composition and properties of lump ore.
| T–Fe
(mass%) | SiO2
(mass%) | Al2O3
(mass%) | CaO
(mass%) | MgO
(mass%) | Combined
water
(mass%) | RI
(%) | RDI
(%) |
|---|
| H Ore | 63.9 | 2.53 | 1.03 | 0.02 | 0.04 | 4.17 | 55.3 | 22 |
| G Ore | 58.2 | 4.00 | 2.29 | 0.07 | 0.09 | 9.07 | 60.0 | 38.7 |
| D-H Ore | 66.5 | 2.75 | 1.12 | 0.13 | 0.03 | 0.36 | 33.8 | 4.3 |
RI: Reduction Index
RDI: Reduction Degradation Index
Table 2 shows the chemical composition and reduction ratio (hematite standard) of each sample after pre-reduction, as measured by chemical analysis. Figure 3 shows the cross-section of each sample after pre-reduction, the outer circumference of the sample, and the interior microstructure. The presence of metallic iron (Fe: white), wustite: FeO (W: light grey), slag (S: dark grey), and voids (P: black) were confirmed in the texture of each ore in ascending order of colour.
Table 2. Chemical analysis of lump ore after pre-reduction (mass%).
| T–Fe | M–Fe | FeO | SiO2 | Al2O3 | CaO | MgO | R (%) |
|---|
| H ore | 89.3 | 72.3 | 13.4 | 3.5 | 1.4 | 0.0 | 0.1 | 84.9 |
| G ore | 87.0 | 70.9 | 14.2 | 5.7 | 3.2 | 0.1 | 0.1 | 85.7 |
| D-H ore | 88.8 | 60.6 | 23.0 | 3.6 | 1.5 | 0.2 | 0.0 | 75.0 |

As the reduction of the sample cross-section proceeded from the outer peripheral portion to the central portion, a topochemical reduction was confirmed. A softening test was conducted using each topochemically reduced iron ore. The outer part of the pre-reduced lump ore is where slag forms in contact with CaO under high-temperature load conditions. Area analysis by EDS on the outer part of each pre-reduced lump ore are shown following results. It can be seen that the gangue components containing Si and Al are finely present in the metallic iron structure at the outer part of the H ore. The gangues of the D-H ore, mainly composed of Si, are distributed in the metallic iron structure. The gangues are relatively finely distributed in the metallic iron structure of the G ore, and the existence of Al is most strongly confirmed.
The experiments were conducted with the CaO substrate in contact with the lump ore. CaO substrate instead of limestone was used because the limestone charged in a blast furnace is assumed to exist as CaO due to thermal decomposition in the temperature range simulated in the cohesive zone. Thus, CaO obtained by calcining limestone used in an actual blast furnace was used. Figure 4 shows the preparation procedure for a CaO substrate. Limestone was calcined in an air atmosphere at 1000°C for 12 h using a muffle furnace. The calcined limestone was crushed to 75 μm or less using a mortar. A total of 15.0 g of the obtained powder was placed in a die with a diameter of 30 mm, and uniaxial pressure moulding was performed at 40 MPa. The CaO substrate obtained by firing the obtained green compact at 1500°C for 2 h in a muffle furnace was used as the experimental sample. The calcined limestone was confirmed to thermally decompose into CaO substrate from XRD analysis.

In order to focus only on the slag formation behaviour between the lump ore and limestone in the cohesive zone, a descending reaction hysteresis for both to the cohesive zone was reproduced with offline pre-treatments (pre-reduction of the lump ore and calcination of limestone). The load softening test was performed in an inert atmosphere in an N2 stream at a flow rate of 2 NL/min to avoid reduction reactions during the experiment.
The experimental temperature range was 900–1500°C. The sample was first rapidly heated to 900°C at 1000°C/min, this temperature was then held for 5 min to homogenise heat distribution, and then finally the sample was further heated to a specified temperature at 10°C/min. After heating to the specified temperature, the sample was immediately quenched in a dry cooling chamber. A load of 20 N was applied to the sample through the graphite lid of the crucible during the heating experiment.
During the experiment, the shrinkage ratio of the sample was measured from the displacement of the graphite lid on the top of the sample, and the changes over time were recorded. As shown in Eq. (1), the shrinkage ratio was defined based on the height of each sample at room temperature. The amount of shrinkage of the sample was calibrated by subtracting the amount of expansion of the crucible, sample, etc., from the actual measured value.21)
|
Shrinkage degree (%)=
Shrinkage amount (mm)
Sample's initial height (mm)
×100
| (1) |
shows the setup of an experimental sample. An alumina block, Fe sheet, lump ore, and CaO substrate were stacked, in this order, and set in the graphite crucible (outer diameter 36 mm, inner diameter 30 mm, height 40 mm). The alumina block was used to prevent the reaction between the lump ore and graphite crucible. The Fe sheet was used to prevent reaction between the ore and alumina.
Figure 5(b) shows the setup of another experimental sample for tracing of “only iron ore” shrinkage degree. In this case, lump ore sample was put on Fe sheet instead of CaO substrate for focusing on shrinkage behaviour of lump ore itself.
4. Discussion
4.1. Preparation of Quenched Samples
From cross-sectional observations, the process of slag formation from the interface of the lump ore and CaO could be: 1) melt formation from the lump ore; 2) intrusion of the melt of the lump ore into CaO; 3) slag formation including reaction between the melt and CaO. Based on this reaction scheme, intrusion of the melt from lump ore into the CaO substrate is the focus of this discussion. Quenched samples were prepared, and the intrusion phenomena of the melt in each lump ore were observed. Figure 11 shows a cross-sectional image of the quenched samples at 1000, 1200, 1300, and 1500°C. No discolouration of CaO was observed up to 1200°C.

For the H ore, discolouration of the CaO substrate due to the slight intrusion of the melt was observed at 1300°C. For D-H ore, the degree of intrusion of the melt at 1300°C is the largest compared to other lump ores. No exudation of the melt was observed even at 1300°C for the G ore, and the degree of intrusion of the melt was minimal even after the temperature was raised to 1500°C.
4.2. Quantitative Evaluation of Melt Intrusion Depth into CaO Substrate
To quantitatively evaluate the cross-sectional observation results of the quenched samples, the penetration depth of the lump ore into the CaO substrate, accompanied by the deformation of the CaO substrate, and the intrusion depth of the melt into the CaO substrate were measured.
As shown in Fig. 12, the length to the edge of the CaO substrate discolouration region in the thickness direction of the CaO substrate with respect to the original interface of the CaO substrate is defined as the intrusion depth of the melt.
The length to the bottom part of the lump ore in the thickness direction in the CaO substrate with respect to the original surface of the CaO substrate is defined as the penetration depth of the lump ore, as shown in Fig. 12.
The measured intrusion depth of the melt and the penetration depth of the lump ore are shown in Fig. 13. From these results, it can be ascertained that the intrusion of the melt could be necessary to cause lump ore penetration. In the H ore, a slight intrusion of the melt occurs from 1200 to 1300°C, and then the intrusion of the melt progresses to the same level as the D-H ore at 1500°C. The lump ore penetrated the CaO substrate because of the rapid intrusion of the melt from 1300 to 1500°C. For D-H ore, the intrusion of the melt progresses significantly from 1200 to 1300°C, and then the intrusion of the melt slowly progresses up to 1500°C. This trend corresponds to the penetration behaviour of the lump ore, and the increase speed of the penetration depth of the lump ore from 1200 to 1300°C is larger than from 1300 to 1500°C. Compared to the other lump ores, the intrusion depth of the melt is extremely small for the G iron ore, and little penetration of the lump ore is observed.

The penetration of the lump ore could be thought of as the deformation of the CaO substrate. It occurs with the intrusion of the melt into the CaO substrate, and when a large amount of melt intrudes, the deformation of the CaO substrate becomes larger.
4.3. Intrusion Behaviour of Melt with CaO Substrate
In this experiment, the outer part of lump ore after pre-reduction is reduced to metallic iron. Therefore, movement of the melt from the lump ore to CaO must first pass through this metallic layer. Then, the melt from the lump ore intrudes into and reacts with the CaO substrate while reacting with the CaO substrate. To discuss this phenomenon, the following three steps are assumed: 1) melt formation in iron ore, 2) melt passing through the metallic iron layer and moving to the lump ore–CaO interface, and 3) melt intrusion into the CaO substrate.
4.3.1. Melt Formation
We focused on the amount of melt formed inside the lump ore. Figure 14 shows the liquid phase ratio variation of each lump ore calculated using FactSage 7.2. The calculation conditions were as follows: thermodynamic equilibrium state in the quinary system of FeO–SiO2–Al2O3–CaO–MgO based on the average chemical analysis results of lump ore, temperature range of 900 to 1500°C, total pressure of 1 atm, inert Ar gas atmosphere, and metallic iron as the solid phase. It was assumed that the metallic iron in the lump ore did not react with other gangue components, and the liquid phase ratio was calculated using the formula shown in (2).
|
Liquid phase ratio (%)=A×(100-M)/100
| (2) |
A: Liquid fraction of FeO–SiO2–Al2O3–CaO–MgO (%)
M: Metallic Fe amount (%)
From Fig. 14, the D-H ore produced the most melt among the three lump ores. Although there is a slight difference between the H and G ores, the final liquid-phase ratio shows approximately equivalent values. These results correspond to those shown in Fig. 11, where the degree of discolouration of the CaO substrate due to the intrusion of the melt was larger for the D-H ore than the other lump ores in the quenched samples at 1300°C.
The maximum liquid phase ratio was reached at approximately 1300°C for all lump ores. In the experiment using the CaO substrate, the intrusion of the melt was observed only at 1300°C or higher. It can be inferred that intrusion does not occur into the CaO substrate until a sufficient amount of melt is formed. In addition, the amount of melt in contact with the CaO substrate in this experiment was also calculated using FactSage. FACT was used for the pure substance database, and FToxid was used for the solution database. Using FactSage 7.2, the thermodynamic equilibrium state in the experimental temperature range of 900 to 1500°C was calculated at a total pressure of 1 atm and in an inert Ar gas atmosphere. The equilibrium calculation in FactSage 7.2 assumed that each phase such as monoxide, melilite, Ca2SiO4, spinel, Slag-liq all oxide + S exists in an equilibrium state.22)
This calculation was performed assuming that the gangue in the lump ore reacted with the CaO substrate at a mass ratio of 1:1. Both the bulk chemical analysis and EDS results of the outer part of the lump ore were used as values for the gangue chemical composition to be applied for the calculation. When calculating the gangue component based on the EDS analysis, Fe, Si, Al, and Ca were regarded as FeO, SiO2, Al2O3, and CaO, respectively.
Figure 15 shows the results of calculating the gangue components assuming FeO, SiO2, Al2O3, and CaO. As shown in Fig. 15, the separation of components was confirmed in the gangue at the outer part of the H and G ores. Therefore, as shown in Fig. 16, each area ratio was measured using the image analysis software, ImageJ. The gangue component at the outer parts of the ore was estimated by multiplying the EDS analysis results at each separation phase and the measured area ratio. The estimated gangue components are presented in Table 3.
Table 3. Chemical composition of the mineral phase in the outer part of lump ore (mass%).
| FeO | CaO | SiO2 | Al2O3 | MgO |
|---|
| H ore | 58.0 | 0.6 | 35.2 | 6.2 | 0.0 |
| D-H ore | 18.8 | 0.2 | 80.3 | 0.7 | 0.0 |
| G ore | 59.4 | 0.6 | 25.7 | 14.3 | 0.0 |
As for the gangue composition of the outer part of the lump ore, the D-H ore contained an extremely large amount of SiO2, and the G ore contained a large amount of Al2O3. The liquid phase ratios calculated based on the average chemical analysis results of the lump ores are shown in Fig. 17(a). Figure 17(b) shows the results calculated based on Table 3 values, which were approximated from the average gangue components at the outer part of the lump ore.

The H ore shows the lowest temperature (approximately 1150°C) of initial slag formation among the three lump ores when calculating the change in liquid phase ratio under CaO contact in both cases. The lump ore with the second lowest temperature of initial slag formation was the G ore with considerably close values to those of the H ore’s temperature. In both cases, the initial slag formation temperature of the D-H ore was approximately 1200°C, which was the highest temperature among the three lump ores. These calculated results indicated that the lump ores in which the intrusion of the melt starts at a relatively low temperature are H and G ores, and D-H ore starts at the highest temperature.
However, as shown in the experimental results in Fig. 11, the melt intrusion of the D-H ore occurs at the lowest temperature, and the H and G ores displayed no intrusion of the melt even when quenched at 1300°C. For the D-H ore, the melting start temperature was approximately 1200°C, as shown in Fig. 17. The melt formation started at approximately 1200°C, and the liquid phase ratio increased with increasing temperature.
Although no intrusion was observed in the quenched sample at 1200°C, in the sample cross-section after the experiment, as shown in Fig. 11, the intrusion of the melt was observed at 1300°C. Thus, the liquid phase ratio and the intrusion behaviour of the melt show very similar tendencies for the D-H ore.
One of the main reasons for the differences in the calculated liquid phase ratio and the observed melt intrusion behaviour into the CaO substrate for the H and G ores could be the formation of Ca2SiO4 at the lump ore-CaO interface, as shown in Fig. 10. Ca2SiO4 does not melt in the temperature range of this experiment, which affects the intrusion of the melt.
4.3.2. Reduced Metallic Iron Structure for Passing Melt
The structure of the metallic iron through which the melt formed inside the lump ore passes was observed. The metallic iron structures for the quenched sample at 1200°C (where the melt did not intrude into the CaO substrate in all lump ores), quenched sample at 1300°C (where intrusion of the melt occurred for H and D-H ores), and all samples after heating to 1500°C are shown in Fig. 18.
The melt intrusions of H and D-H ores, which produced a relatively large amount of melt intrusion into the CaO substrate at 1500°C, were the result of aggregation of gangue mineral phases from 1200 to 1500°C. This is in contrast to the G ore, where the gangue components are hardly aggregated from 1200 to 1300°C, and some aggregation can be observed at 1500°C, but the extent of aggregation is small compared to other lump ores, as shown in Fig. 18.
Hence, it appears that the movement of the melt is relatively difficult in the metallic iron structure in which the gangue components are finely dispersed. This is likely one of the main reasons why the scale of discolouration of the CaO substrate is very small in the post-experimental sample of the G ore.
However, the movement of the melt in the metallic iron layer is due to the complexity of the metallic iron structure surrounding the lump ore component that produces the melt due to the complexity of the melting behaviour of the lump ore as well as the complexity of the surrounding iron structure. As it is possible that many factors such as viscosity and surface tension are involved, further studies are required.
4.3.3. Melt Intrusion into CaO Substrate
To discuss the melt intrusion phenomenon into the CaO substrate, a detailed observation of the lump ore-CaO interface was conducted. As shown in Fig. 10, a precipitate layer is formed at the lump ore–CaO interface for the H and G ores. By contrast, no precipitate layer formed in the D-H ore. The EDS analysis of this precipitate determined a Ca:Si ratio of approximately 2:1; thus, it was inferred that the precipitate at the interface was mainly due to Ca2SiO4.
When the H ore was in contact with the CaO substrate, a Ca2SiO4 layer, which is a high-temperature melting point compound, was formed at the lump ore–CaO interface from the initial stage of the melt intrusion. The small amount of melt intrusion is likely due to the formation of the Ca2SiO4 layer.
For the G ore, no melt intrusion and no precipitation layer were observed at the lump ore–CaO interface up to 1300°C. In the quenched sample at 1500°C, a Ca2SiO4 layer was formed at the interface. The Ca2SiO4 layer inhibits the melt intrusion generated from the lump ore to the CaO substrate. This caused the G ore to have the smallest melt intrusion into the CaO substrate among the three lump ores. This Ca2SiO4 phase does not exist in the pre-reduced lump ore samples. It is considered that Ca2SiO4 was confirmed in this experiment because of the contact of the lump ore with the CaO substrate.
To discuss the formation behaviour of Ca2SiO4 due to contact with the CaO substrate and the influence of the ore species, the results of thermodynamic equilibrium calculations using FactSage to estimate the liquid phase formation ratio was modified to express the formation behaviour of the solid phase.
Figure 19 shows the formation ratios of Ca2SiO4. The results calculated based on the average chemical analysis results of the lump ore from Table 2 are shown in Fig. 19(a), and the results calculated based on Table 3 estimates for the gangue components in the outer part of the lump ore are shown in Fig. 19(b). The calculated main solid phase component other than Ca2SiO4 was Ca2Fe2O5. Because of lower melting point of Ca2Fe2O5. than Ca2SiO4, the effect of that solid phase was ignored in this discussion.
For the H ore, the Ca2SiO4 phase is stable up to 1400°C under all the calculation conditions. It is considered that the formation of Ca2SiO4 starts from approximately 1150°C, which is the starting temperature for the formation of the initial melt seen in Fig. 17(b), and the melt intrusion into the CaO substrate is hindered.
Figure 19(b) shows the results of focusing on the gangue components at the outer part of the lump ore. A large amount of the Ca2SiO4 phase was present with the temperature being 1500°C. As shown in Fig. 19(a), calculated for the entire gangue, the presence of the Ca2SiO4 phase is not found above 1400°C.
From the melt intrusion behaviour shown in Fig. 8, although almost no intrusion of the melt was observed up to 1300°C, the H ore suddenly showed a significant amount of melt intrusion after the temperature was raised to 1500°C. This is likely due to the disappearance of the Ca2SiO4 phase at 1400°C or higher, as shown in Fig. 19(a).
For the D-H ore, as shown in Fig. 19(a), using calculations based on the average chemical analysis results of the lump ore, the Ca2SiO4 phase is present upto 1400°C.
Contrastingly, as shown in Fig. 19(b), a small amount of Ca2SiO4 phase, calculated on the basis of the gangue component at the outer edge of the lump ore, is present at 1300°C or higher, and the Ca2SiO4 phase is present even at 1500°C.
As shown in Fig. 9, in the D-H ore, the Ca2SiO4 phase was not present at the lump ore–CaO interface in the samples quenched at all temperatures. The conditions in which the Ca2SiO4 phases of Fig. 18 do not appear are summarised for each temperature as follows: at 1000, 1200 and 1300°C, the Ca2SiO4 phase does not exist in Fig. 19(b), which focuses on the gangue component of the outer part of the lump ore, and at 1500°C, the Ca2SiO4 phase does not exist in Fig. 19(a), which focuses on the average gangue component.
Regarding the formation of Ca2SiO4, the relationship between the calculation results of FactSage in Fig. 19, and the observation results in Fig. 17(a) are as follows: Fig. 19(a) focuses on the average gangue component of the whole lump ore corresponding to Ca2SiO4 formation behaviours at 1300°C or higher. Figure 19(b) focuses on the gangue component of the outer edge of the lump ore corresponding to the behaviours at 1300°C or lower.
From Fig. 17(b) at 1300°C or lower, rapid intrusion of the melt was observed, and the Ca2SiO4 phase, which inhibits the melt intrusion is not present in Fig. 19(b), which focused on the gangue component at the outer part of the lump ore.
However, as shown in Fig. 13 at 1300°C or higher, the melt intrusion is relatively slow. This is likely because the Ca2SiO4 phase is present and inhibits the exudation of the melt up to 1400°C, as shown in Fig. 19(a), which is focused on the average gangue composition of the entire lump ore.
Regarding the G ore, the Ca2SiO4 phase is present from 900 to 1500°C, under all calculation conditions.
In Fig. 19(a), which focused on the average gangue component of the entire lump ore, the Ca2SiO4 phase disappeared just before reaching 1500°C. This result corresponds to the intrusion behaviour of the melt, as shown in Fig. 13. No intrusion of the melt was observed up to 1300°C, and only a slight intrusion was observed at 1500°C.
When focusing on the gangue component of the outer part of the lump ore at 1300°C or lower, and the average gangue component of the entire lump ore at 1300°C or higher, a relationship between the melt intrusion behaviour and the Ca2SiO4 phase formation can be explained.
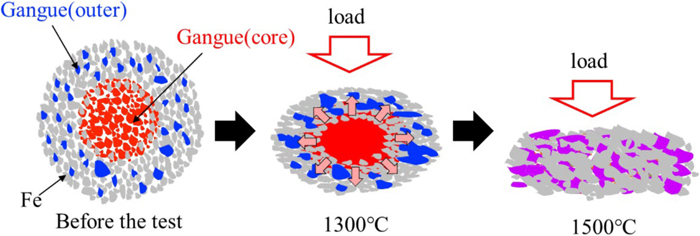
As shown in Fig. 14, 1300°C is the temperature at which the maximum liquid phase ratio of gangue is reached when the temperature of the lump ore is raised alone. In other words, all the gangue present in the lump ore is in a molten state at 1300°C. When components other than metallic iron in the lump ore are completely melted and the lump ore shrinks due to the load from above, the melt inside the lump ore is pushed out to the outer part, as shown in Fig. 20.
Therefore, it is considered that the difference in the gangue composition between the outer part and the centre of the lump ore becomes smaller. At 1300°C or above, the melt that reacts with the CaO substrate is close to the average gangue component composition of the entire lump ore.
It is considered that the calculation result of the formation behaviour of the Ca2SiO4 phase from the average gangue component of the entire lump ore, as shown in Fig. 19(a), explains well the intrusion depth of the melt in Fig. 13. At below 1300°C, the gangue in the lump ore does not melt sufficiently, and there is a difference in the gangue component between the average of the entire lump ore and the outer part. When correctly considering the formation behaviour of the Ca2SiO4 phase, it is necessary to study the gangue component at the outer edge of the lump ore in contact with the CaO substrate.