Abstract
The Bragg-edge neutron transmission imaging method can quantitatively visualize various types of crystalline microstructural information inside a bulk material over a large visualization field area. In this study, we investigated and improved both the experimental method and the data analysis method for the evaluation of crystalline phase volume fraction in steel composed of ferrite/martensite and austenite. For wavelength-resolved neutron transmission imaging experiments, we confirmed that accurate measurement of neutron transmission intensities was crucial. Therefore, the background neutrons scattered from a sample must be reduced. Simultaneously, we confirmed that a neutron wavelength resolution of approximately 1% was required. For the data analysis of the measured Bragg-edge neutron transmission spectrum, we used double March-Dollase orientation distribution functions for each crystalline phase to achieve effective spectrum correction of the crystallographic texture effect. As a result, this data analysis method allows improved evaluation of the crystalline phase volume fraction, compared with the use of a single March-Dollase function for each phase.
1. Introduction
High-performance steels composed of multiple crystalline phases, such as dual phase (DP) steel and transformation induced plasticity (TRIP) steel, have been developed, investigated, and improved.1) For example, the TRIP steel consists of a retained metastable austenite phase in a ferrite matrix phase, which can transform to a hard martensite phase under stress. Here, to evaluate the crystalline phase volume fraction of the retained austenite phase, the TRIP steel is characterized using SEM-EBSD and X-ray diffraction.2) Furthermore, recently, neutron diffraction is used because neutrons can easily penetrate a millimeter/centimeter-sized bulk steel and retrieve the high-statistical data of the crystalline phase volume fraction over the bulk of the steel sample. For example, the neutron diffractometer “iMATERIA” at BL20 of Materials and Life Science Experimental Facility (MLF) in Japan Proton Accelerator Research Complex (J-PARC) achieves crystalline phase volume fraction evaluation with the correction of the crystallographic texture effect using Rietveld texture analysis.3) In addition, RIKEN Accelerator-driven Compact Neutron Source (RANS) achieves the evaluation of the volume fraction of the retained austenite phase by using a neutron diffraction experiment coupled with Rietveld analysis.4)
In this study, we focus on the Bragg-edge neutron transmission imaging method as an advanced neutron-based materials characterization technique to quantitatively evaluate the position-dependent information of the crystalline microstructure of a bulk sample. The standard performance of this method achieves a spatial resolution of 1 mm for an imaging area of 10 cm × 10 cm. This method is advantageous for realizing short-time measurements using large-area beam irradiation, position-dependent analyses for a material having a complex macrostructure, and tomographic imaging. The Bragg-edge neutron transmission method has been applied, for example, to time-dependent phase transformation measurements5) and three-dimensional imaging of crystalline phases.6,7)
In particular, the Bragg-edge neutron transmission spectrum analysis program, Rietveld Imaging of Transmission Spectra (RITS) is applied for the quantitative evaluation of various types of crystalline microstructural information, e.g., area density, crystal lattice parameters, crystallographic texture information and crystallite size of each crystalline phase, included in the wavelength-dependent neutron transmission data.8,9,10,11,12,13) The RITS program is based on a spectrum profile fitting analysis over a wide wavelength bandwidth as well as Rietveld analysis for diffractometry. RITS phase-dependently evaluates the atomic number density integrated over the neutron transmission path in a bulk sample in order to obtain the crystalline phase volume fraction. Here, RITS is advantageous in that, for a precise analysis, it uses the spectrum profile correction for the crystallographic texture and primary extinction effects.8,9,10,11,12,13,14)
Thus, Bragg-edge neutron transmission imaging combined with RITS is accepted as an effective tool for the imaging of bulk information of crystalline phase volume fractions. However, some issues remain concerning this method. For example, the effects of neutron wavelength resolution and background neutrons scattered from a sample have not been experimentally investigated yet. In addition, the March-Dollase orientation distribution function is used in RITS for the spectrum profile correction of the crystallographic texture effect. However, the effect of the March-Dollase function on the data analysis has not been systematically investigated. Therefore, in this study, we evaluated and improved the experiment and data analysis methods of Bragg-edge neutron transmission imaging for the crystalline phase volume fraction analysis. For this purpose, we prepared and measured samples having known real-space distributions of ferrite/austenite phase volume fractions. In this paper, we report and discuss the results demonstrating the improved methodologies.
2. Time-of-flight Neutron Transmission Imaging Experiments
For the measurement of Bragg-edge neutron transmission spectra, time-of-flight (TOF) neutron transmission imaging experiments were performed at pulsed neutron sources. The TOF neutron transmission experiment can yield wavelength-dependent neutron transmission data, namely, neutron transmission spectrum including Bragg-edges caused by the neutron diffraction phenomenon. The Bragg-edge neutron transmission spectrum includes crystallographic information averaged over the neutron transmission path in a sample. In addition, the imaging mode using a two-dimensional neutron counter that enables TOF analysis provides position-dependent Bragg-edge transmission spectra over a sample. In this section, we describe the experimental conditions in detail.
2.1. Samples
Figure 1 shows schematic illustrations of plate-shaped and cylindrical samples composed of ferrite and austenite phases. The real-space distributions of each crystalline phase in the samples were completely known. We used JIS-SS400 as the ferrite phase and JIS-SUS304 as the austenite phase. An SS400 wedge was stacked on an SUS304 wedge in the plate-shaped sample (Fig. 1(a)), and an inner SS400 rod was fitted into an outer SUS304 holder in the cylindrical sample (Fig. 1(b)). Therefore, each crystalline phase was clearly separated although two crystalline phases existed in each sample. We could certainly evaluate the validity of analysis results of the crystalline phase volume fractions since the complete inner structures and crystalline phases at each position could be determined.

The plate-shaped sample, comprising the SS400 and SUS304 wedges, was evaluated for the measurement accuracy over various austenite phase volume fractions from 0% to 100%. The total thickness of the sample was 5 mm, corresponding to the neutron transmission thickness. The crystalline phase volume fraction along the neutron transmission path corresponds to the ratio of the thickness of each phase in principle. Therefore, the crystalline phase volume fraction changes from 0% to 100% along the horizontal direction of the sample. The results are described in Secs. 4.2 and 4.3.
The cylindrical sample with an outer diameter of 20 mm and comprising the inner SS400 rod and outer SUS304 holder was measured for demonstrating the tomography of the austenite phase volume fraction. Because of the axial symmetry of this sample, the tomography was obtained by only a single projection. At the vertical center position of this sample, for example, austenite phase volume fractions from 30% to 100% can be evaluated by neutron projection data. The results are described in Sec. 4.4.
In addition, we measured a JIS-SS400 plate of 1 cm thickness and 10 cm × 10 cm area for evaluating the effect of background neutrons scattered from the sample. The results are described in Sec. 4.1.
2.2. Wavelength-resolved Neutron Transmission Imaging Experiments
In this study, we conducted the experiments at Hokkaido University Neutron Source (HUNS),15) which is a compact pulsed neutron facility, and at J-PARC, which is a large pulsed spallation neutron facility. At HUNS, we measured two types of neutron transmission spectrum depending on different wavelength resolutions. We conducted three types of experiments at HUNS, as described in Secs. 2.2.1 and 2.2.2. At J-PARC, we measured higher statistical precision data to evaluate the precision of spectral fitting analysis using RITS with the improved March-Dollase function. In this section, experimental conditions at each facility are presented in detail, and the important parameters are summarized in Table 1. The setting of the sample in front of a neutron detector at each facility is illustrated in Fig. 2.
Table 1. Comparison of conditions of four neutron TOF-imaging experiments.
| Accelerator power (kW) | Neutron flight path length (m) | Angular divergence (mrad) | Δλ/λ (%) | Grid collimator | Guide tube | Sample |
|---|
| HUNS-I Low-resol. | 1.2 | 5.29 | 19 | 3 | Yes | No | Plate |
| HUNS-I High-resol. | 1.2 | 6.72 | 15 or more | 1 | Yes | Yes | Plate |
| HUNS-II High-resol. | 1.5 | 6.13 | 16 or more | 1 | Yes | Yes | Cylinder |
| RADEN | 200 | 24.78 | 0.9 | 0.2 | No | No | Plate |
For measuring neutron transmission spectra at a low wavelength resolution, we conducted a neutron TOF-imaging experiment with the coupled-type cold neutron source beamline14) at HUNS. It uses an electron linear accelerator with the power 1.2 kW for our experiment. The cold neutron moderator used was coupled-type mesitylene. The full width at half maximum (FWHM) of the cold neutron pulse was approximately 170 μs. This pulse width was experimentally estimated from a line broadening obtained by a neutron backscatter diffraction experiment using a mica sample, before the present study. The neutron TOF-imaging detector was a gas electron multiplier (GEM) detector16) with a pixel size of 800 μm × 800 μm and an imaging area of 10.24 cm × 10.24 cm. The total neutron flight path length from the neutron source to the neutron detector was 5.29 m. Thus, the cold neutron wavelength resolution obtained using the TOF method was 3%.
Due to a large neutron beam angular divergence of several tens of milliradians, low spatial resolution is attained when the distance between the sample and the detector is large. Therefore, the sample must be placed close to the detector. However, this may result in the imaging detector capturing background neutrons scattered from the sample. RITS cannot handle such data; therefore, background neutrons must be experimentally reduced. To reduce background neutrons scattered from the sample, we set a neutron grid collimator17) between the sample and the detector as shown by Fig. 2(a). However, using the grid collimator, the low energy neutron flux becomes 60% that without the collimator.
In this experiment, we measured the plate-shaped sample. The measurement time for the direct beam without any samples was 23.5 h and that for the sample was 12.2 h. Incidentally, although the measurement time of the direct beam is longer than that of the sample in this study, it is usually no problem that the measurement time of the direct beam is shorter than that of the sample.
2.2.2. Experiment at a High Wavelength Resolution with the Thermal Neutron Beamline at HUNS
For measuring neutron transmission spectra at a high wavelength resolution, we performed two neutron TOF-imaging experiments at the decoupled-type thermal neutron source beamline18) at HUNS-I and HUNS-II driven by a new electron linear accelerator reconstructed at Hokkaido University.
The thermal neutron moderator was decoupled/poisoned polyethylene at ambient temperature. The FWHM of the cold neutron pulse was approximately 65 μs. This pulse width was experimentally estimated from broadening of a Bragg-edge of an α-Fe sample, before the present study. This type of neutron moderator supplies a short-pulsed neutron beam, but a relatively low neutron flux. Therefore, a 3.65Qc supermirror guide tube of 3.83 m length was installed in the beamline.18) A GEM detector was used as the neutron TOF-imaging detector. Note that in the HUNS-II experiment, we used a different GEM detector with a detection efficiency 43% that of the detector used in the HUNS-I experiment. The total neutron flight path lengths were 6.72 m in the HUNS-I experiment and 6.13 m in the HUNS-II experiment. Thus, the cold neutron wavelength resolution obtained using the TOF method was 1%. A neutron grid collimator was set between the sample and the detector.
In the HUNS-I experiment, we measured the plate-shaped sample, where the measurement time for the direct beam without any samples was 12.2 h and that for the sample was 12.0 h. Incidentally, although the measurement time of the direct beam is longer than that of the sample in this study, it is usually no problem that the measurement time of the direct beam is shorter than that of the sample. In the HUNS-II experiment, we measured the cylindrical sample, where the measurement time for the direct beam without any samples was 18.8 h and that for the sample was 21.6 h.
In addition, an experiment to evaluate the effect of scattered neutron background was conducted using the JIS-SS400 plate mentioned in the last paragraph in Sec. 2.1. The measurement time was 10 min.
2.2.3. Experiment with RADEN at MLF BL22 in J-PARC
The energy-resolved neutron imaging system, RADEN, was constructed at BL22 of MLF in J-PARC.19,20) The pulsed neutron source is based on a spallation reaction using the 3 GeV proton synchrotron in J-PARC. The proton beam power for our experiment was 200 kW. The neutron moderator of BL22 was decoupled 20 K supercritical para-H2. The FWHM of the cold neutron pulse was approximately 50 μs.19,20) The neutron beam angular divergence and the neutron flux were determined by a pinhole collimator with 15 mm diameter placed at the 8.0 m beamline position. The neutron TOF-imaging detector was a GEM detector. The total neutron flight path length was 24.78 m. Thus, the cold neutron wavelength resolution obtained using the TOF method was 0.2%. Owing to a low beam angular divergence of less than 1 mrad, we placed the sample 20 cm from the detector12) in order to reduce background neutrons scattered from the sample.
In this experiment, we measured the plate-shaped sample with the measurement time for the direct beam without any samples being 12.9 h and that for the sample being 6.5 h. Incidentally, although the measurement time of the direct beam is longer than that of the sample in this study, it is usually no problem that the measurement time of the direct beam is shorter than that of the sample.
3. Data Analysis of Bragg-edge Neutron Transmission Spectrum for the Evaluation of Crystalline Phase Volume Fractions
This section describes the RITS-based data analysis of the Bragg-edge neutron transmission spectrum for crystalline phase volume fraction evaluation. The analysis consists of two important parts: evaluation of the crystalline phase volume fraction10,11) and the use of double March-Dollase functions for better correction of the crystallographic texture effect.
3.1. Evaluation of Crystalline Phase Volume Fraction
The neutron transmission as a function of neutron wavelength λ, Tr(λ), is described by
|
Tr(λ)=exp(
-
∑
p
σ
tot,p
(λ)
ρ
p
t
p
)
,
| (1) |
where
p is the index of the crystalline phase,
σtot(
λ) is the wavelength-dependent total cross-section,
ρ is the atomic number density, and
t is the thickness. In this paper,
ρt is called the “projected atomic number density”, indicating the projection data of the atomic number density, and is obtained by integrating
ρ through the neutron transmission path length
t. For each crystalline phase,
ρt can be converted to the crystalline phase volume fraction. Here, we assume that
ρt of the ferrite phase (
ρtF) and that of the austenite phase (
ρtA) are obtained by RITS. In this case, the volume fraction of the austenite phase,
VA, can be evaluated by the following equation:
10,11)
|
V
A
=
ρ
t
A
a
A
3
4
ρ
t
F
a
F
3
2
+ ρ
t
A
a
A
3
4
,
| (2) |
where
aF is the lattice parameter of the BCC crystal structure of the ferrite phase, and
aA is the lattice parameter of the FCC crystal structure of the austenite phase. Thus,
VA can be evaluated from the Bragg-edge neutron transmission spectrum,
Tr(
λ). In the RITS analysis performed in this study, we assumed that the chemical composition of SS400 was only Fe, and that of SUS304 was 69.75Fe-9.25Ni-19.00Cr-2.00Mn in mass%, based on the Japanese Industrial Standards (JIS) data.
3.2. Double March-Dollase Functions for Correction of the Crystallographic Texture Effect
For RITS,8) the coherent elastic scattering cross-section, included in the total cross-section of Eq. (1), is described as
|
σ
ela
coh
(λ)=
λ
2
2
V
0
∑
hkl
|
F
hkl
|
2
d
hkl
R
hkl
(λ)
P
hkl
(λ)
E
hkl
(λ).
| (3) |
Here,
V0 is the unit cell volume,
hkl is the diffraction index,
Fhkl is the crystal structure factor,
12) dhkl is the crystal lattice plane spacing calculated from lattice parameters
, Rhkl(
λ) is the Jorgensen-type asymmetric Bragg-edge profile function,
Phkl(
λ) is the March-Dollase orientation distribution function, and
Ehkl(
λ) is Sabine’s primary extinction function. The spectrum profile fitting can be performed well by using the spectrum profile correction functions
Rhkl(
λ)
, Phkl(
λ) and
Ehkl(
λ). Simultaneously, the strain, the March-Dollase coefficient
RMD, expressing the degree of crystallographic anisotropy, the preferred orientation <
HKL>, and crystallite size
S can be evaluated.
In this study, multiple March-Dollase functions were used in RITS for improved spectrum fitting and more accurate VA evaluation. Diffraction pattern correction using multiple March-Dollase functions has already been used in the Rietveld analysis program for powder diffractometry, RIETAN-FP.21) The multiple March-Dollase functions are expressed by
|
P
hkl
(
λ
)
=
∑
i=1
n
w
i
P
hkl,i
(
λ,HK
L
i
,
R
MD,i
)
,
| (4) |
where
Here,
wi denotes the fraction of the
i-th March-Dollase function with the preferred orientation <
HKL>
i and the March-Dollase coefficient
RMD,i. In this study, we used double March-Dollase functions, that is,
n = 2.
By using double March-Dollase functions, it is expected that the profile fitting for Bragg-edge transmission spectrum can be successfully performed for more complicated orientation distributions which are not reproduced by a single March-Dollase function. At the same time, it is also expected that the integrated intensities of neutron diffraction, which are proportional to the crystalline phase volume, are more correctly evaluated in the Bragg-edge neutron transmission method. However, because the total number of March-Dollase functions reaches four for a single neutron transmission spectrum, the number of surveyed parameters reaches 14: ρt, two <HKL>, two RMD, wi, and S for each crystalline phase. In this study, this new function for RITS was applied, evaluated, and successfully utilized for evaluation of the crystalline phase volume fraction. The results are discussed in Sec. 4.3.
4. Results and Discussion
4.1. Evaluation of Measured Neutron Transmission Spectrum with the Neutron Grid Collimator
First, the effect of using the grid collimator in reducing background neutrons scattered from the sample was investigated. Figure 3 shows the comparison result of neutron transmission spectra measured by the experiment explained in Sec. 2.2.2. These spectra include those obtained without the grid collimator, with the grid collimator, and calculated by RITS. The spectrum without the collimator has higher transmission intensity due to the background neutrons scattered from the sample, especially in the wavelength region less than 0.4 nm, where Bragg scattering occurs. This is consistent with a previous report.12) By contrast, the spectrum with the collimator is well consistent with the calculation data for wavelengths longer than 0.1 nm, except for the spectrum shape change due to the texture effect. Incidentally, the transmission intensities of the spectrum with the collimator for wavelengths less than 0.1 nm approach those without the collimator. This is because neutron absorption of gadolinium within the collimator abruptly weakens at less than 0.1 nm. In any case, we confirmed that the grid collimator was effective for reducing background neutrons scattered from the sample based on the fact that the transmission intensities were accurately measured at the wavelength region where RITS was applied.

Here, we focus on the effect of wavelength resolution on the analysis of the crystalline phase volume fraction. Figure 4 shows the comparison of the neutron transmission spectra of austenite phase volume fractions 0%, 50%, and 100% in the plate-shaped sample. These spectra were measured in both low and high wavelength resolution modes at HUNS. These neutron transmission spectra were obtained from neutron counts summed over 95 pixels along the vertical direction because the crystalline phase volume fraction did not change along the vertical direction in the plate-shaped sample. Figure 4 indicates that the transmission intensities increase when a low wavelength resolution instrument is used, as shown by arrows in Fig. 4. This intensity increase cannot be completely reproduced by the Bragg-edge profile function, relating to the wavelength resolution, in RITS.

Figures 5 and 6 show the profile fitting analysis results obtained by RITS for the spectra measured at the low and high wavelength resolution beamlines at HUNS, respectively. RITS used here a single March-Dollase function and the preferred orientations <HKL> were set as <111> for the ferrite phase and <110> for the austenite phase. The analyzed six spectra are the neutron transmission spectra shown in Fig. 4. The spectral fitting analyses are confirmed to be successfully performed for both wavelength resolution cases. Moreover, the refined March-Dollase coefficient RMD and crystallite size S of each phase are shown in the figures. The texture and crystallite size parameters shown here are just reference data. In this study, we focus on the reliability of the evaluated crystalline phase volume fraction, as discussed in the next paragraph. However, the functions Phkl(λ) and Ehkl(λ), including RMD and S, play an important role as the spectrum profile correction functions for reasonable fitting and crystalline phase volume fraction evaluation.

After the fitting analysis, we evaluated the analysis reliability of volume fractions of the austenite phase at both wavelength resolutions. Figure 7 shows the results of the austenite phase volume fraction evaluated at low and high wavelength resolutions. The vertical axis indicates the evaluated value, and the horizontal axis indicates the actual value calculated from the thickness ratio of SUS304 to SS400. The dashed line indicates the correct answer. We investigated for five points of austenite phase volume fraction, that is, 0%, 25%, 50%, 75%, and 100%. Figure 7 clearly indicates that the high wavelength resolution case can provide more reasonable results. Here, we quantitatively evaluate the difference between the analysis results and the actual values. The difference parameter, D, is defined by
|
D=
1
N
∑
n=1
N
|
V
exp,n
-
V
cal,n
|,
| (6) |
where
Vexp is the analysis result of the austenite phase volume fraction, and
Vcal is the actual value of the austenite phase volume fraction.
D is the value averaged for the total number
N = 5. The difference in the value of
D is 16% for low wavelength resolution and 4% for high wavelength resolution.
The difference in D is larger in the low wavelength resolution experiment because, as mentioned before, RITS cannot reproduce the profile of the neutron transmission spectrum distorted by low wavelength resolution, which results in higher transmission intensities, as shown by Fig. 4. However, RITS forcibly achieves successful fitting by tuning ρt, RMD, and S of each phase. As a result, it affects the accuracy of the evaluated projected atomic number density ρt and austenite phase volume fraction VA. Hence, it is confirmed that more correct transmission intensity should be measured by reducing the distortion due to the wavelength resolution as well as scattered neutron background.
4.3. Effect of Correction of the Crystallographic Texture Effect
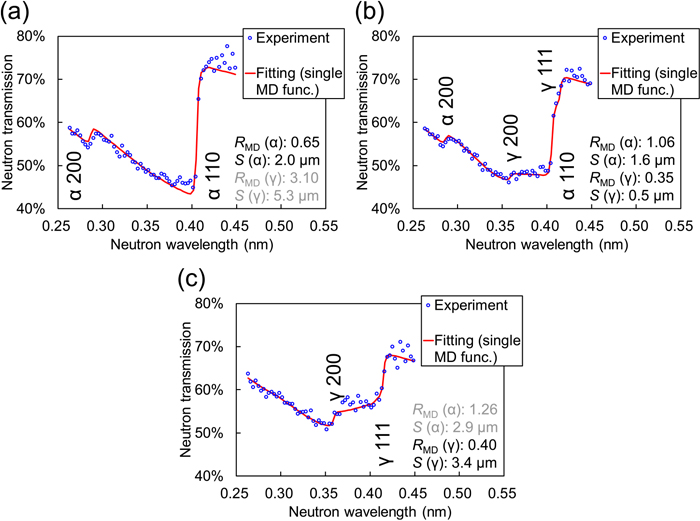
In this section, we discuss the effect of texture effect correction with double March-Dollase functions for the RADEN experiment data. Figure 8 shows profile fitting analysis results obtained by RITS, here, using a single March-Dollase function. The preferred orientations <HKL> were set as <111> for the ferrite phase and <110> for the austenite phase. The three analyzed spectra were obtained from positions of the austenite phase volume fractions 0%, 50% and 100% in the plate-shaped sample. Figure 8 indicates that the profile fittings are not sufficient, especially, at certain wavelength regions indicated by arrows. This indicates a possibility that the coherent elastic scattering intensity of each crystalline phase, which is proportional to each crystalline phase volume, is not evaluated correctly. Here, we focused on partial differences between spectra indicated by arrows shown in Fig. 8. The partial shape of a Bragg-edge transmission spectrum can be altered by the crystallographic texture effect, namely, the crystal orientation distribution. Therefore, the correction of the crystallographic texture effect by using a single March-Dollase function is not sufficient for a textured material having a complicated orientation distribution. Thus, we expected a possibility that better profile fitting with better texture effect correction can provide more reasonable evaluation result for the austenite phase volume fraction.

For this reason, we tried to use double March-Dollase functions in this study. Figure 9 shows the improved profile fitting results for the same spectra shown in Fig. 8. We set <111> and <100> as the preferred orientations for the ferrite phase as well as <110> and <211> for the austenite phase. The refined texture and crystallite size parameters are shown in the figures. We note that the second RMD and weight w1 are newly added for each phase because of the double March-Dollase functions. These texture and crystallite size parameters are used only for the correction of the profile fitting and the crystalline phase volume fraction evaluation, which are deeply evaluated in this study. Figure 9 indicates that the profile fitting using double March-Dollase functions drastically improved, especially at the wavelength regions indicated by arrows. Thus, the evaluation result of the crystalline phase volume fraction is expected to improve since the integrated intensities of coherent elastic scattering cross-section for each phase are evaluated more correctly.

Finally, we discuss the improvement of the evaluation result of the austenite phase volume fraction by using double March-Dollase functions, shown in Fig. 10. The figure shows the comparison results of the evaluated austenite phase volume fraction with double and single March-Dollase functions. The difference between the evaluated and the actual values from Eq. (6) decreases from 5% to 2% owing to the double March-Dollase functions. This indicates that for the correct analysis of the crystalline phase volume fraction, evaluation of the correct value of the integrated intensities of the coherent elastic scattering cross-section is crucial even for samples with complicated orientation distribution. Therefore, RITS with the spectrum profile correction using double March-Dollase functions is confirmed to be effective.

Incidentally, it can be considered that triple March-Dollase functions are used. It is effective for improving the spectrum fitting if the spectrum fitting obtained by double March-Dollase functions is not sufficient. However, triple March-Dollase functions were not used in this study because the spectrum fittings were sufficiently conducted as shown by Fig. 9. In addition, we have to inspect quite many refinement parameters if we use triple March-Dollase functions. In particular, this difficulty of data analysis handling is enhanced for a sample composed of two crystalline phases because six March-Dollase functions are necessary in total. For these difficulties, double March-Dollase functions are better approach because the spectrum fitting is successfully conducted.
4.4. Demonstration of Crystalline Phase Volume Fraction Tomography
Finally, we demonstrated the tomography of the austenite phase volume fraction in the cylindrical sample measured with the high wavelength resolution beamline of HUNS-II. We analyzed the position-dependent neutron transmission spectra by RITS using double March-Dollase functions. The neutron transmission spectra were obtained from the neutron counts summed over an 8 mm wide vertical center region, indicated as the computed tomography (CT) region in Fig. 1(b). Therefore, a cross-sectional distribution of the crystalline phase volume fraction from 6.6 mm to 7.4 mm in radius could contain the gradual transition region from the ferrite phase to the austenite phase. This point is important to evaluate the result of tomographic imaging. Incidentally, the neutron beam angular divergence of HUNS, < 20 mrad, does not cause the blurring of spatial resolution of the imaging results. This is because both the 0.8 mm pixel size of the neutron imaging detector and the 0.4 mm pixel size of the reconstructed CT image are larger than the blurring, < 0.4 mm, which is estimated by both the beam angular divergence and the sample thickness.
Figure 11 shows the horizontal position dependence of the analysis results of the austenite phase volume fraction at the CT region shown in Fig. 1(b). The actual values in this figure indicate the austenite phase volume fractions along the neutron transmission path, calculated from the inner macrostructure of the cylindrical sample. Owing to the neutron grid collimator, high wavelength resolution, and double March-Dollase functions, the evaluated austenite phase volume fractions are consistent with the actual values calculated by Eq. (6), with a difference of 2.5%. This value is similar to the value reported in Sec. 4.3.

By using two types of data shown in Fig. 11 as the projection data for the CT image reconstruction, we derived tomographic images of the austenite phase volume fraction in the cylindrical sample. The CT image reconstruction used the maximum likelihood - expectation maximization (ML-EM) algorithm.22) ML-EM has a mathematical advantage that does not output the negative values. The CT image was reconstructed using 16 projections which correspond to the angular interval of 22.5°. ML-EM is effective for the small number of projections. Since this advantage is usable for wavelength-resolved neutron imaging, ML-EM was applied. However, because 8 projections which correspond to the angular interval of 45° are too rough, we tested the CT image reconstruction under the condition of 16 projections. All the projection data have the same ones shown in Fig. 11. This is because the cylindrical sample has axial symmetry in terms of the austenite phase volume fraction. Figure 12 shows the derived CT image reconstruction results from the projection data of (a) experimentally obtained austenite phase volume fractions and (b) actual austenite phase volume fractions. The crystalline phase volume fractions more than 100% were reconstructed in the CT images. This is because the CT image can be reconstructed mathematically; physical restrictions are necessary for rejecting the crystalline phase volume fractions more than 100% although the crystalline phase volume fractions less than 0% can be rejected owing to the mathematical advantage of ML-EM. Thus, since it is difficult to discuss the quantitative reliability of the CT image, we prepared the CT image reconstructed from the projection data of actual austenite phase volume fractions for the comparison. Although both reconstructed images are consistent with each other, there are instabilities in the cross-sectional images, caused by several little projections. Therefore, we additionally derived the radius-dependent values of the CT image by applying the circular averaging to the CT image.

Finally, Fig. 13 shows the radius dependences of the austenite phase volume fractions from both experimentally reconstructed and simulation tomograms. The actual values determined from the inner sample shape are indicated by a solid line in this figure. As mentioned before, in a real-space distribution of the actual values, the transition region from the ferrite phase to the austenite phase appears from 6.6 mm to 7.4 mm in radius. First, it is clearly confirmed that the experimentally reconstructed tomogram is highly consistent with the simulation tomogram. In addition, both CT-reconstructed data are consistent with the actual values, because three features, namely the inner region of the 0% fraction, the outer region of the 100% fraction, and the transition region from the ferrite phase to the austenite phase, are reconstructed reasonably. By contrast, there is a difference between the tomograms and the actual values near the 6 mm radius position. This difference is present in both the experimental and simulation tomograms. Therefore, we consider that this difference is caused by a lack of projection data and a limitation of the algorithm of ML-EM-based CT image reconstruction. In any case, because the experimentally reconstructed tomogram was consistent with the simulation tomogram, we conclude that the Bragg-edge neutron transmission imaging with the various advanced procedures proposed in this study is sufficiently applicable to the CT image reconstruction of the ferrite/austenite phase volume fraction.

5. Conclusion
In this study, we improved methodologies of Bragg-edge neutron transmission imaging for the evaluation of crystalline phase volume fractions in steel composed of ferrite and austenite. For the experimental method, we confirmed that the reduction of background neutrons scattered from the sample and a high wavelength resolution of approximately 1% are required. For the data analysis, the Bragg-edge neutron transmission spectrum fitting program RITS was effectively used with double March-Dollase functions for the spectrum profile correction in order to reproduce a complicated orientation distribution in the sample. A difference of approximately 2%–3% was achieved between the evaluated and expected crystalline phase volume fractions. These values could be reasonably used to reconstruct the tomography of the ferrite/austenite phase volume fraction.
The principles established in this study can be applied to the case of martensite/austenite phase volume fractions because the Bragg-edge neutron transmission spectrum of martensite is similar to that of ferrite.23) In the future, we will conduct axial-asymmetric tomography of the austenite phase volume fraction in steel at intense pulsed spallation neutron source facilities.
Acknowledgements
The authors thank Prof. Michihiro Furusaka of Hokkaido University for invaluable discussions, and Dr. Hirotaku Ishikawa, Mr. Tsukasa Sasaki, Mr. Shogo Ito, Mr. Hiroki Nagakura, Mr. Koh-ichi Sato of Hokkaido University for experimental assistance. The neutron experiment at J-PARC MLF BL22 “RADEN” was performed under a user program (Proposal No. 2016I0022). This work was partially supported by 27th ISIJ Research Promotion Grant.
References
- 1) S. Curtze, V.-T. Kuokkala, M. Hokka and P. Peura: Mater. Sci. Eng. A, 507 (2009), 124. https://doi.org/10.1016/j.msea.2008.11.050
- 2) D. De Knijf, R. Petrov, C. Föjer and L. A. I. Kestens: Mater. Sci. Eng. A, 615 (2014), 107. https://doi.org/10.1016/j.msea.2014.07.054
- 3) Y. Onuki, A. Hoshikawa, S. Sato, T. Ishigaki and T. Tomida: J. Mater. Sci., 52 (2017), 11643. https://doi.org/10.1007/s10853-017-1309-x
- 4) Y. Ikeda, A. Taketani, M. Takamura, H. Sunaga, M. Kumagai, Y. Oba, Y. Otake and H. Suzuki: Nucl. Instrum. Methods Phys. Res. A, 833 (2016), 61. https://doi.org/10.1016/j.nima.2016.06.127
- 5) S. Vogel: Ph.D. thesis, Christian-Albrechts-Universität zu Kiel, (2000), https://nbn-resolving.org/urn:nbn:de:gbv:8-diss-3306, (accessed 2008-5-23).
- 6) A. Steuwer, P. J. Withers, J. R. Santisteban and L. Edwards: J. Appl. Phys., 97 (2005), 074903. https://doi.org/10.1063/1.1861144
- 7) R. Woracek, D. Penumadu, N. Kardjilov, A. Hilger, M. Boin, J. Banhart and I. Manke: Adv. Mater., 26 (2014), 4069. https://doi.org/10.1002/adma.201400192
- 8) H. Sato, T. Kamiyama and Y. Kiyanagi: Mater. Trans., 52 (2011), 1294. https://doi.org/10.2320/matertrans.M2010328
- 9) H. Sato, T. Shinohara, R. Kiyanagi, K. Aizawa, M. Ooi, M. Harada, K. Oikawa, F. Maekawa, K. Iwase, T. Kamiyama and Y. Kiyanagi: Phys. Procedia, 43 (2013), 186. https://doi.org/10.1016/j.phpro.2013.03.022
- 10) Y. H. Su, K. Oikawa, S. Harjo, T. Shinohara, T. Kai, M. Harada, K. Hiroi, S. Y. Zhang, J. D. Parker, H. Sato, Y. Shiota, Y. Kiyanagi and Y. Tomota: Mater. Sci. Eng. A, 675 (2016), 19. https://doi.org/10.1016/j.msea.2016.08.037
- 11) Y. H. Su, K. Oikawa, T. Shinohara, T. Kai, K. Hiroi, S. Harjo, T. Kawasaki, W. Gong, S. Y. Zhang, J. D. Parker, H. Hayashida, H. Sato, Y. Kiyanagi and Y. Tomota: Phys. Procedia, 88 (2017), 42. https://doi.org/10.1016/j.phpro.2017.06.005
- 12) H. Sato, K. Watanabe, K. Kiyokawa, R. Kiyanagi, K. Y. Hara, T. Kamiyama, M. Furusaka, T. Shinohara and Y. Kiyanagi: Phys. Procedia, 88 (2017), 322. https://doi.org/10.1016/j.phpro.2017.06.044
- 13) H. Sato: J. Imaging, 4 (2018), 7. https://doi.org/10.3390/jimaging4010007
- 14) H. Sato, K. Mochiki, K. Tanaka, K. Ishizuka, H. Ishikawa, T. Kamiyama and Y. Kiyanagi: Nucl. Instrum. Methods Phys. Res. A, 943 (2019), 162501. https://doi.org/10.1016/j.nima.2019.162501
- 15) M. Furusaka, H. Sato, T. Kamiyama, M. Ohnuma and Y. Kiyanagi: Phys. Procedia, 60 (2014), 167. https://doi.org/10.1016/j.phpro.2014.11.024
- 16) S. Uno, T. Uchida, M. Sekimoto, T. Murakami, K. Miyama, M. Shoji, E. Nakano, T. Koike, K. Morita, H. Satoh, T. Kamiyama and Y. Kiyanagi: Phys. Procedia, 26 (2012), 142. https://doi.org/10.1016/j.phpro.2012.03.019
- 17) K. Y. Hara, H. Sato, T. Kamiyama and T. Shinohara: EPJ Web Conf., 146 (2017), 03032. https://doi.org/10.1051/epjconf/201714603032
- 18) H. Sato, T. Sasaki, T. Moriya, H. Ishikawa, T. Kamiyama and M. Furusaka: Phys. B, 551 (2018), 452. https://doi.org/10.1016/j.physb.2017.12.058
- 19) T. Shinohara, T. Kai, K. Oikawa, M. Segawa, M. Harada, T. Nakatani, M. Ooi, K. Aizawa, H. Sato, T. Kamiyama, H. Yokota, T. Sera, K. Mochiki and Y. Kiyanagi: J. Phys. Conf. Ser., 746 (2016), 012007. https://doi.org/10.1088/1742-6596/746/1/012007
- 20) T. Shinohara, T. Kai, K. Oikawa, T. Nakatani, M. Segawa, K. Hiroi, Y. H. Su, M. Ooi, M. Harada, H. Iikura, H. Hayashida, J. D. Parker, Y. Matsumoto, T. Kamiyama, H. Sato and Y. Kiyanagi: Rev. Sci. Instrum., 91 (2020), 043302. https://doi.org/10.1063/1.5136034
- 21) F. Izumi and K. Momma: Solid State Phenom., 130 (2007), 15. https://doi.org/10.4028/www.scientific.net/SSP.130.15
- 22) A. P. Dempster, N. M. Laird and D. B. Rubin: J. R. Stat. Soc. Ser. B, 39 (1977), 1. https://doi.org/10.1111/j.2517-6161.1977.tb01600.x
- 23) H. Sato, T. Sato, Y. Shiota, T. Kamiyama, A. S. Tremsin, M. Ohnuma and Y. Kiyanagi: Mater. Trans., 56 (2015), 1147. https://doi.org/10.2320/matertrans.M2015049


