Abstract
This note describes a method to determine an imbalance in burden distribution by quantifying the ratio of coke and ferrous burden across the circumference of the blast furnace. Real-time signals of hopper weight, the tilt angle of the rotary chute, the rotation angle of the rotary chute, and the gate opening from bell less top system of the blast furnace is used as input data for this method. The imbalance in burden distribution can be seen as non-uniformity in the distribution of coke and ferrous burden across the circumference of the furnace. Few possible remedies to rectify the root cause of non-uniformity in burden distribution are discussed based on observations from an analysis of real-time signals from the bell less top system.
1. Introduction
A blast furnace is a complex reaction vessel involving cross-current flows of gas, liquid, and solids. Solid is charged in the blast furnace as alternate layers of ore and coke. The hot gases from the hot blast of tuyere across the circumference of furnace react with coke in raceway zone to form reducing gas mixture of CO, H2 and N2.1) The hot ascending gas follows the path of least resistance and if the distribution of material is not uniform gas distribution can become non-uniform, resulting in inefficiency in the process. Ryuichi NAKAJIMA et al.2) has shown how non-uniformity in burden distribution can be measured by evaluating the stock-levels in four quadrants of a blast furnace. Where feedback from the stock level in each quadrant of the blast furnace is given as input to control the blast flow rate from tuyeres in corresponding quadrants. That is to increase or decrease the coke consumption in a particular quadrant of the blast furnace, which rectifies the non-uniformity in burden distribution. Nomura et al.3) has presented a technique to evaluate the imbalance in burden distribution by assessing the distribution of coke ratio in four quadrants of the blast furnace. Where coke ratio was calculated using the gas composition data for gases analysed from respective quadrants. Current work aims to present a direct method to evaluate the imbalance in burden distribution by monitoring the distribution of coke ratio across the circumference of the furnace. Where coke ratio shown in Eq. (1-1) is the ratio of the amount of coke and ferrous burden charged in each quadrant of the blast furnace.
|
CR =
W
coke
W
coke
+
W
ferrous
| (1-1) |
Where CR is coke ratio, Wcoke and Wferrous are the weight of coke and ferrous burden discharged in a quadrant of the blast furnace. Sun et al.,4) Xu et al.5) and Narita et al.6) has shown in their work that bell less top blast furnaces with parallel hopper have tendency to create circumferential non-uniformity in burden distribution due to varying mass flow rate of burden material along the circumference of furnace. Xu et al.5) describes altering the hoppers for consecutive charge dumped in furnace can remove this non-uniformity in burden distribution due to parallel hopper configuration in bell less top blast furnaces. The paper also describes methods to investigate the root cause of imbalance in burden distribution and techniques to rectify them.
2. Methodology
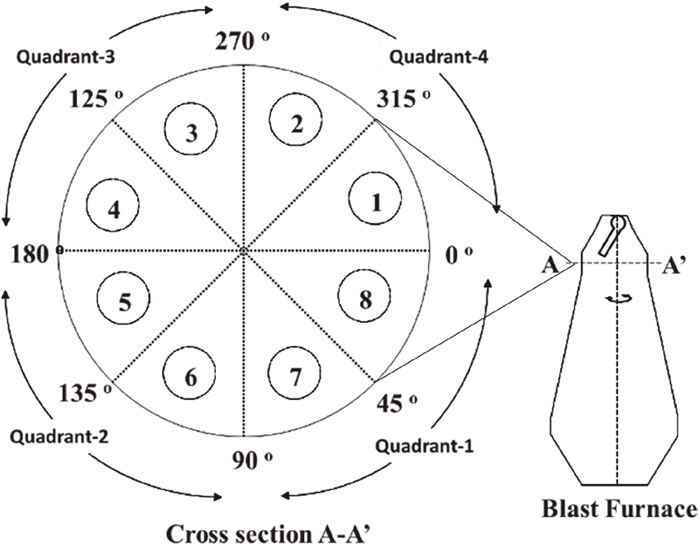
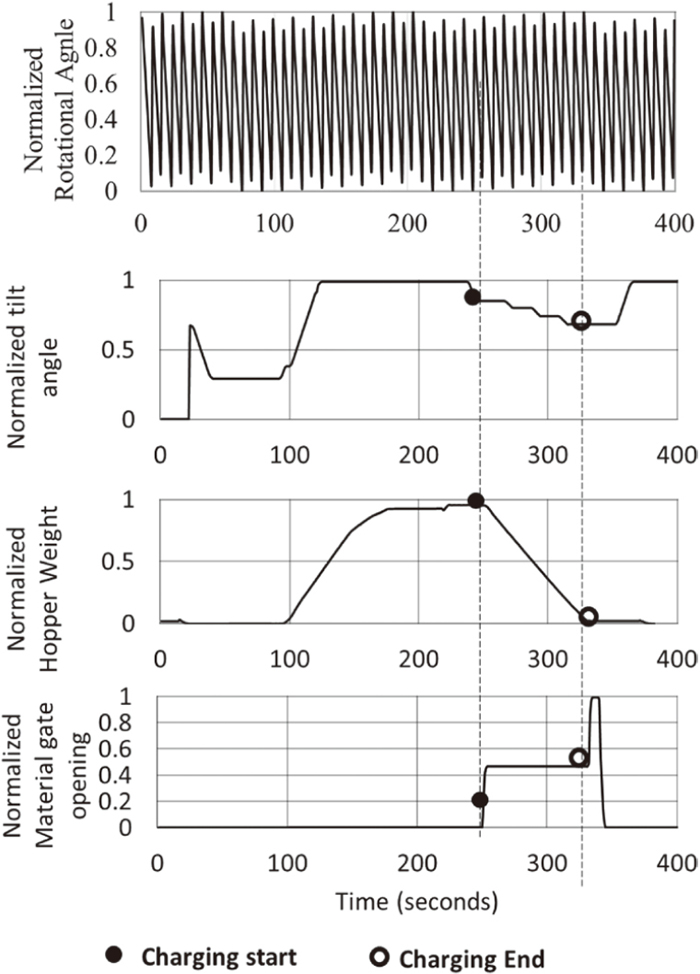
This method assumes the division of blast furnace cross-section into four quadrants shown in Fig. 1. Signals from the sensor in bell less top system that is the hopper weight signal, the chute rotation angle signal, the chute tilt angle signal, and the material gate opening signal shown in Fig. 2 is processed to calculate the actual amount of coke and ferrous burden discharged in each quadrant of the blast furnace. The start of dropping value for hopper weight signal is considered as start of charging. Negative value of time differential of hopper weight signal
d(w)
dt
given by Eq. (2-1) is used to identify the dropping value of hopper weight signal. To affirm dropping value of hopper weight signal is for actual charging and not for any noise in signal following two checks are performed: a) continuous drop in hopper weight value for consecutive five timestamps, b) Gate opening value is above the base level value for consecutive five timestamps, where base level value is the gate opening value when it is closed. While charging end is identified when
d(w)
dt
value returns to zero and with condition that its value remains zero for consecutive five timestamps.
|
(
d(w)
dt
)
n
=
w
n
-
w
n-1
t
n
-
t
n-1
| (2-1) |
Here
(
d(w)
dt
)
n
is the time differential of hopper weight signal at tn timestamp, w is the weight of hopper, wn is hopper weight at tn timestamp, wn−1 is the hopper weight at tn−1 timestamp. There is a time lag (lag) between the opening of the gate and the actual arrival of burden material in the furnace top which is given by Eq. (2-2). Quadrant of blast furnace in which amount of burden material (wburden)n given by Eq. (2-5) has arrived is determined by the value of chute rotation angle at tn_lag timestamp given by Eq. (2-4).
|
V
burden
=
∑
i=1
n
total
w
i
-
w
i-1
t
i
-
t
i-1
ρ ×
n
total
| (2-3) |
|
(
w
burden
)
n
=(
w
n
-
w
n-1
)
| (2-5) |
Here, L is length of path travelled by burden material between the opening of the gate and the top burden surface for a tilt angle of chute at tn_lag timestamp, Vburden is the average flow rate for the charge dumped in blast furnace, ntotal is the total number of timestamps between start and end of the charge dumped in blast furnace and ρ is the bulk density of burden material of the charge dumped in blast furnace.
Coke ratio (CR) is calculated using the amount of coke and ferrous burden in the corresponding quadrant using Eq. (1-1). Here, the signal is normalized using Eq. (2-6),
|
y =
x-min(data)
max(data)-min(data)
| (2-6) |
Where y is normalized value, x is actual value of the signal, maximum and minimum value of the signal data is fixed and is determined by the limit of the operating condition. The standard deviation of coke ratio (CR) across the four quadrants shown in
Eq. (2-7) quantifies the imbalance in burden distribution.
|
CCRI =
∑
i=1
n
(C
R
i
-μ)
2
n
| (2-7) |
|
μ=
∑
i=1
n
W
coke i
∑
i=1
n
W
coke i
+
∑
i=1
n
W
ferrous i
| (2-8) |
Where CCRI is Circumferential Coke Ratio Index, CRi is coke ratio in the ith quadrant, μ is the mean of coke ratio in all quadrants of a blast furnace and n is number of divisions along the cross-section of furnace.
3. Results and Discussion
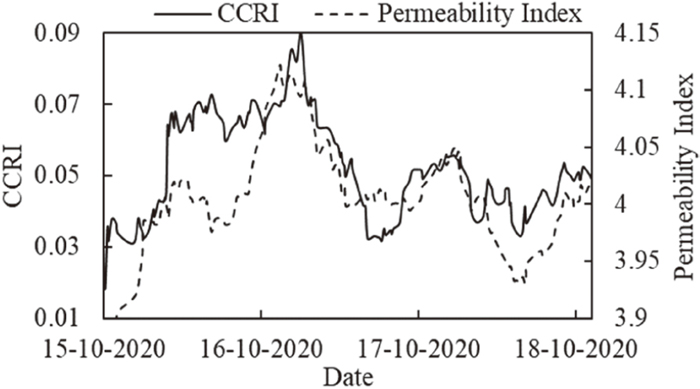
The sequence of coke and ferrous layers is charged in the blast furnace termed as a batch, which is repeated for continuous operation. The Coke ratio (CR) value for each batch charged in the furnace was calculated and Circumferential Coke Ratio Index (CCRI) value for the respective batch was calculated for three days using Eq. (2-7). Here value of n was taken as four, as cross-section of furnace is assumed to be divided in four quadrants. Each batch charged in furnace mentioned above represents a sequence of a Coke charge(C), a Center-Coke(C) charge and a Ferrous charge (O). Figure 3 shows 10 hours moving average trend for values of CCRI and 10 hours moving average trend of permeability index (K) of the blast furnace. Here permeability index (K) is the total permeability of blast furnace which is calculated using the empirical co-relation shown in Eq. (2-9).
|
Permeability Index (K)=
(HBP)
2
-
(TGP)
2
BG
V
1.7
| (2-9) |
Where, HBP is absolute Hot Blast Pressure (gm/cm2), TGP is absolute Top Gas Pressure (gm/cm2) and BGV is Bosh Gas Volume (Nm3/min).
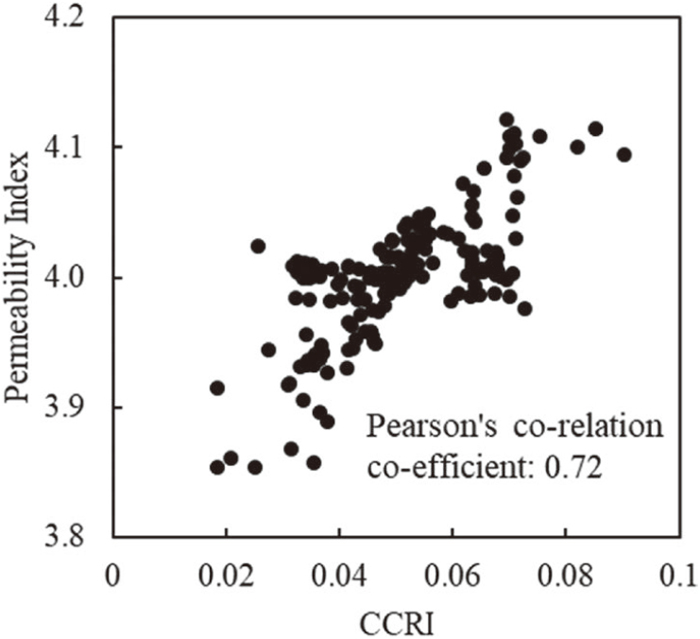
There is a good co-relationship between values of CCRI and K with Pearson’s correlation coefficient of approximately 0.72 as shown in Fig. 4. Here values of CCRI and K are 10 hours moving average values. This shows that imbalance in coke ratio across the circumference monitored as CCRI index of furnace has a significant impact on the permeability of blast furnace. This trend can be monitored for real-time checks of imbalance in burden distribution across the circumference of the furnace. As described above CCRI is the standard deviation of coke ratio (CR) in four quadrants of the blast furnace, so the lower the value of CCRI better is the burden distribution uniformity across the circumference of the furnace.
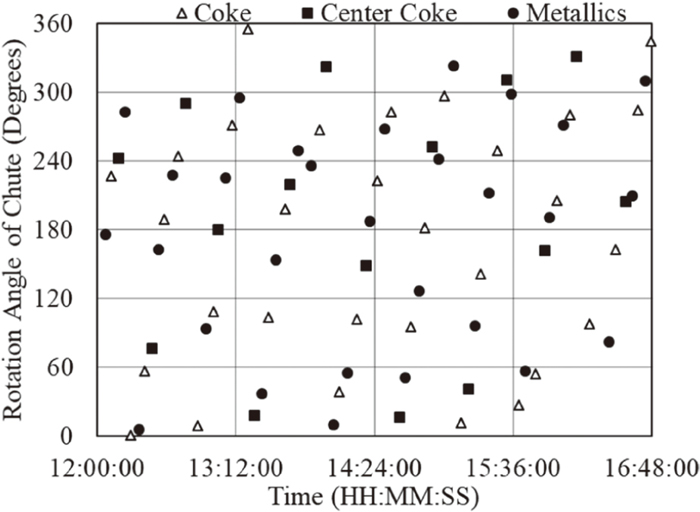
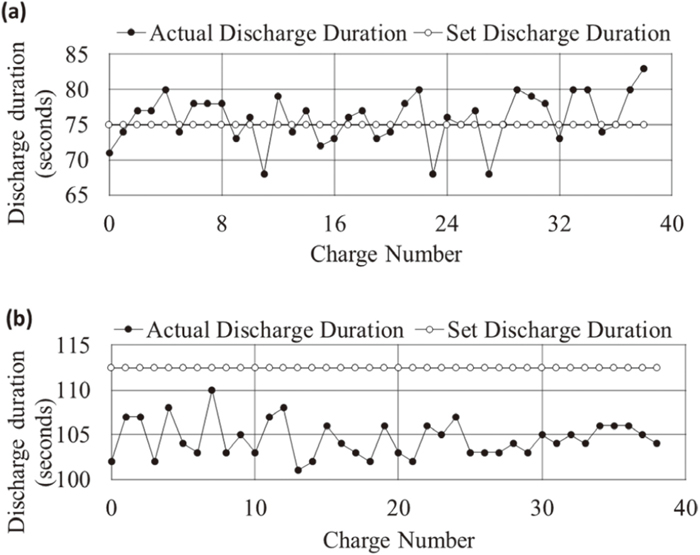
Ideally, the bell less top system is designed for the uniform discharge of burden material along the circumference of the furnace. Variation in moisture content, the composition of burden material, or erosion of discharge chute of bell less top system influence discharge behavior of burden material. Material gate opening for burden distribution system is programmed or set considering standard co-relation between material flow rate and gate opening percentage. This co-relation is valid provided the composition, moisture content, granulometry of charged burden in the furnace is approximately similar to the burden material properties used to develop the standard co-relation. Figure 5(a) shows a case that the actual discharge duration of charge is close to the set discharged duration, while the case in Fig. 5(b) shows there is a significant gap between actual and set discharged duration. It was investigated that regime of operation for the case shown in Fig. 5(b) had a significant deviation in burden material properties, while the standard co-relation between material flow rate and gate opening percentage was not tuned for this regime. The case shown in Fig. 5(b) will be responsible for extra amount of material discharged in some section across the circumference of the furnace. To get rid of such abnormality, it is better to tune the co-relation between material gate opening and material flow rate for changed properties of burden material. However, it is sometimes not feasible to tune this co-relation immediately, in such situations the strategy of randomly distributing the abnormality should work. Figure 6 shows an actual case where the start location of coke charges (empty triangles), start location of center coke charges (filled squares), and start location of ferrous charges (filled circles) are randomly distributed. To understand the effect of random start-position for different charges shown in Fig. 6 on overall uniformity of burden distributed in blast furnace, let us consider any consecutive four charges a, b, c, d. Let their discharge duration in minutes as ta, tb, tc and td. Assume ‘s’ be the angular velocity of rotary chute in rpm (revolutions per min). If number of revolutions completed for a charges a, b, c, d given by ta × s, tb × s, tc × s and td × s is a fraction, then last revolution for that charge is incomplete. If start position of charge a, b, c and d is same, then the incomplete section of last revolution for charges a, b, c, d will lie in same quadrant of blast furnace. Which will ultimately increase the imbalance in burden distribution. While if the start of charging for charges a, b, c, d are randomly distributed, then the position of incomplete section for last revolution of these charges will be randomly distributed among the four quadrants of blast furnace. Random distribution of incomplete section in four quadrant of blast furnace will counterbalance each other and resultant uniform burden distribution will be achieved. Only pitfall here is response time to achieve uniformity in distribution will be high as it is trying to counterbalance the abnormality in series of charges.
4. Conclusion
This work shows the measurement of non-uniformity in burden distribution along with its probable root cause is possible by a technique that uses real-time signals from the bell less top system of the blast furnace. This method can complement other techniques of detection in an imbalance in burden distribution where stock level data and top gas analysis are considered to ascertain that imbalance is due to non-uniform distribution of burden by bell less top system. With enough experimental evidence from blast furnace data, this method can be refined to study the impact of non-uniformity in burden distribution on blast furnace parameters especially permeability of blast furnace. Also, it can be modified for suggesting or controlling bell less top system control parameters to rectify the imbalance in burden distribution.
References
- 1) J. G. Peacey and W. G. Davenport: The Iron Blast Furnace Theory and Practice, ed. by D. W. Hopkins, Pergamon Press, Oxford, UK, (1979), 19.
- 2) R. Nakajima, S. Kishimoto, H. Hotta, K. Ishii, R. Kimura and S. Yamamoto: Tetsu-to-Hagané, 76 (1990), 1466 (in Japanese).
- 3) M. Nomura, S. Taguchi, N. Tsuchiya, H. Sakimura and K. Tanaka: Proc. 43rd Ironmaking Conf., Iron and Steel Society, Warrendale, PA, (1984), 111.
- 4) C. Sun, J. Xu, Z. Liao, Y. Xu, M. Kou and L. Wen: ISIJ Int., 59 (2019), 1527.
- 5) J. Xu, S. Wu, M. Kou, L. Zhang and X. Yu: Appl. Math. Model., 35 (2011), 1439.
- 6) Y. Narita, H. Mio, T. Orimoto and S. Nomura: ISIJ Int., 57 (2017), 429.