Ironmaking
Enrichment of Phosphorus from Iron Ore to Dicalcium-silicate Phase by Partial Reduction
2021 Volume 61 Issue 8 Pages 2220-2226

Details
2021 Volume 61 Issue 8 Pages 2220-2226
Due to the low quality of available iron ore, it is necessary to develop a new technology to produce high quality steel from ore containing a high concentration of phosphorous. In this study, we propose a new process for producing low-P steel by concentrating P in the dicalcium silicate phase through a partial reduction process. High-P iron ore was mixed with varying quantities of CaO and graphite and heated at 1573 K in an Ar atmosphere, and the obtained product was analyzed by electron probe microanalysis. It was found that in the reduced product mixture that was obtained under specific conditions of high basicity and a lower amount of added carbon, more than 95% of P was concentrated in the dicalcium silicate phase, and the P content in metallic iron was sufficiently low.
The current integrated steelmaking process is divided into two main stages. Iron ore is first reduced in a blast furnace and the impurities are removed in the subsequent step. As the hearth area of the blast furnace is carbon saturated, the oxygen partial pressure is low, and impurity elements such as P and Si are reduced along with Fe. In particular, almost all of the P present in the ore is reduced to its elemental form, and it must be reoxidized later in the steelmaking process to remove it as slag. In recent years, the quality of raw materials for steel manufacturing has lowered, and in particular, the P concentration in iron ore has increased.1) Concurrently, the demand for high quality and extremely low-P steel has increased, which has in turn presented a significant challenge to the steelmaking industry.2) Accordingly, the need for an efficient method to produce low-P steel from inferior raw materials is an urgent issue. The authors have previously proposed a process for the removal of P from the iron ore before blast furnace reduction, carried out at a temperature lower than that of the current steelmaking process.3,4,5) Figure 1 shows the result of a calculation performed using the thermodynamics software Factsage 6.4. It shows the dependence of the reduction equilibrium composition on oxygen partial pressure and the temperature of the blast furnace, which contains the raw material. The equilibrium phase is divided into the following regions: (1) unreduced oxide, (2) liquid phase metallic iron, (3) solid phase metallic iron, (4) region where P and Mn are reduced and mixed with liquid phase iron, (5) the region where P and Mn are reduced and mixed with solid iron, and (6) the region where Si, in addition to P and Mn, is reduced and mixed with the liquid phase iron. The circle in the figure indicates conditions of 1843 K and an oxygen partial pressure of 10−16 atm, which corresponds to the normal carbon saturation environment near the hearth of a blast furnace. Under these conditions, almost all of the P and Mn in the iron ore are reduced, Si is partially reduced, and these elements become impurities in the liquid metal. However, if the temperature and oxygen partial pressure can be carefully controlled to maintain the system in regions (2) and (3), the reduction process can be avoided and it might be possible to use a direct steelmaking process to obtain high-purity iron. In general, the favorable conditions for dephosphorization are low temperature, high oxygen partial pressure, and high basicity (the concentration ratio of CaO to SiO2, hereafter abbreviated as C/S); therefore, we focused on the lower temperature region (3).

Stability diagram calculated by FactSage 6.4. (Online version in color.)
In our previous study, we measured the distribution of P between solid iron and molten oxide, which was equilibrated by immersing solid iron pieces in P-containing molten oxide for 20 h or more.4) At 1623 K, where iron exists as a solid, and with an oxygen partial pressure of 10–13 atm or higher, even with a low basicity molten oxide equivalent to the blast furnace slag with C/S ≈ 1.2, P was observed to favor the oxide phase, and the P concentration in solid iron was sufficiently low. In contrast, when the molten oxide was reduced to produce solid iron, although the P concentration in the solid iron was low, it contained the oxide phase in which P was distributed, making the separation process difficult.5) Park et al. measured the P distribution between iron nuggets and CaO–Al2O3 system slag when high-alumina iron ore was melt-reduced in the temperature range of 1673–1773 K. They reported that the high-basicity oxides of the CaO–Al2O3 system can suppress the distribution of P in iron, but the oxide phase particles must be separated.6)
As described above, in the temperature range in which iron exists as a solid and in a high oxygen partial pressure environment, it is possible to suppress the reduction of P and concentrate it in the oxide phase. In contrast, the current steelmaking process uses a high-basicity slag (C/S > 2.0) to achieve a high-efficiency and high-speed dephosphorization operation.7,8,9,10) It is known that the higher the basicity of slag, the more the dicalcium silicate phase (2CaO–SiO2, hereafter abbreviated as C2S) coexists in the molten slag as a solid solution, and P concentrates as a solid solution (C2S–C3P solid solution, hereafter abbreviated as C2S–C3Ps.s.) of C2S and the calcium phosphate phase (3CaO–P2O5, hereafter abbreviated as C3P). Such a slag is being actively used as a multiphase flux.11,12,13,14,15,16)
The C2S–C3Ps.s. phase is soluble in water and Teratoko et al.,17) Numata et al.,18) and Iwama et al.19) have reported the possibility of dilute acid leaching of P from slag. Kubo et al. proposed a process in which C2S–C3Ps.s.-containing slag is converted into free particles by electrical pulse disintegration and then the P concentrate is sorted using a strong magnetic field.20,21,22) Therefore, if P in iron ore can also be concentrated in the C2S phase, it is expected that selective extraction can be easily performed by a similar leaching or magnetic separation treatment. However, little research has been done on the conditions under which C2S is actively produced when iron ore is used as a starting material.
Therefore, in this study, we experimentally investigated various mineral phases formed when iron ore of adjusted basicity and carbon ratio was reduced at 1573 K to identify the conditions under which P was selectively concentrated in the C2S phase.
A diagram of the experimental setup is shown in Fig. 2. A vertical tubular electric resistance furnace equipped with a mullite tube with an outer diameter of 60 mm and an inner diameter of 52 mm and a silicone-carbide heating element was used. Predetermined amounts of ore powder (goethite powder ore containing 0.1 mass% P and 1.7 mass% Al2O3), graphite (special grade powder reagent), and CaO powder were mixed in an agate mortar. CaO was produced by thermally decomposing CaCO3 (special grade powder reagent) at 1273 K in an air atmosphere. Table 1 shows the quantities of each mixture component used in each experiment, and Fig. 3 shows a phase diagram of the CaO–SiO2–FetO system showing the target compositions for each experiment after heat treatment. The composition of the iron ore is shown Fig. 3. To generate C2S, it is necessary to adjust the composition so that it is located in the C2S saturation region shown in Fig. 3. First, based on the amount of SiO2 contained in the powdered ore, a calculated amount of CaO was added to adjust the basicity (C/S) to 1.0 or 2.0. These basicity values were chosen because the samples with C/S = 1.0 are located outside the C2S saturation region and the samples with C/S = 2.0 are located within the region. It was expected that when all the iron oxide (FetO) contained in the raw material is reduced, P will be reduced and transferred to Fe, as it does in a blast furnace. It is important, therefore, to leave some FetO unreduced as slag. Assuming that the reduction reaction of goethite (FeOOH) proceeds according to formula (1), an amount of graphite was added so that the FetO concentration (residual amount) in the sample after heat treatment would be 5–60 mass%.
| (1) |
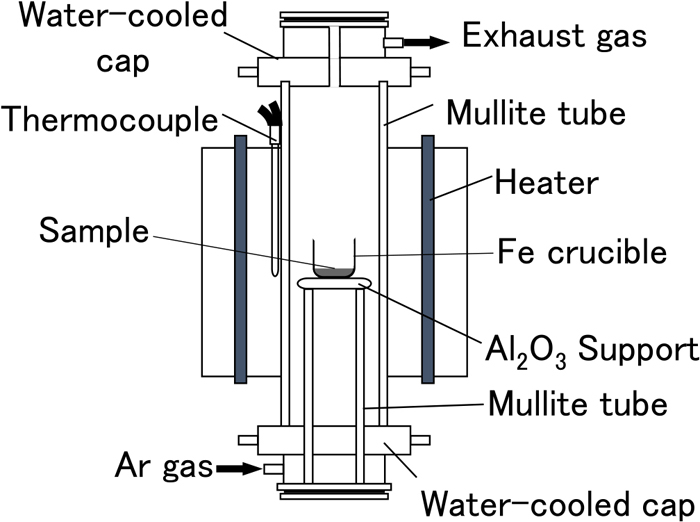
Schematic of the experimental apparatus. (Online version in color.)
| Sample No. | Target | Charged/g | |||
|---|---|---|---|---|---|
| C/S [−] | FetO [mass%] | Iron ore | CaO | Graphite | |
| 1 - 60 | 1.0 | 60.0 | 20.0 | 1.22 | 2.59 |
| 1 - 40 | 1.0 | 40.0 | 20.0 | 1.22 | 3.19 |
| 1 - 20 | 1.0 | 20.0 | 20.0 | 1.22 | 3.50 |
| 1 - 10 | 1.0 | 10.0 | 20.0 | 1.22 | 3.60 |
| 1 - 5 | 1.0 | 5.0 | 20.0 | 1.22 | 3.64 |
| 2 - 60 | 2.0 | 60.0 | 20.0 | 2.47 | 2.12 |
| 2 - 40 | 2.0 | 40.0 | 20.0 | 2.47 | 2.98 |
| 2 - 20 | 2.0 | 20.0 | 20.0 | 2.47 | 3.42 |
| 2 - 10 | 2.0 | 10.0 | 20.0 | 2.47 | 3.56 |
| 2 - 5 | 2.0 | 5.0 | 20.0 | 2.47 | 3.62 |
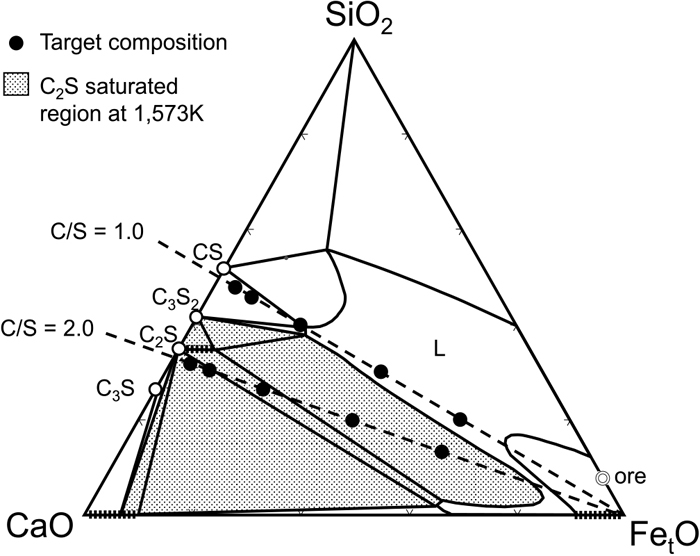
Ternary phase diagram of CaO–SiO2–FetO system27) with the target composition of the oxide phase for the experimental samples.
Each mixed sample was placed in an iron crucible and heated at 1573 K for 1 h under an Ar stream. After heating, it was removed from the furnace and the outside of the crucible was rapidly cooled in water to prepare a partially reduced sample. After quenching, the sample was embedded in cold resin that was cut and dry-polished, and the constituent mineral phases were investigated by electron probe microanalysis (EPMA). Since the P concentration in the produced metallic iron was expected to be low, the analysis accuracy was improved by comparing the results to those generated from standard samples as follows: metallic iron samples containing 0.01, 0.1, 0.5, and 1.0 mass% P were melted in an arc melting furnace, and the P concentration was quantified by double-focusing ICP-MS. The results were used to generate a calibration curve. For samples with C/S = 2.0, EPMA composition images were obtained (15 fields of view or more per sample), and the area ratio of each phase was calculated.
Figure 4 shows representative EPMA composition images of the cross sections of the samples after the partial reduction treatment. Note that there were additional mineral phases that do not appear in this figure. It was confirmed that the reduction proceeded in all the samples and a metallic iron phase was generated. It may be seen that FeOOH, which is the main form of Fe in goethite, thermally decomposed and reacted with the added CaO and the Al, Si, P impurities to form various mineral phases. For the samples with C/S = 1.0, a smooth continuous surface was observed over the entire area, and it can be inferred that the oxide phase existed as a liquid at the experimental temperature. In contrast, for the samples with C/S = 2.0, voids (black) were observed, and some liquid phase oxides had a structure in which the metallic iron phase and oxide solid phase were bonded. When the target FetO concentration was 60%, FetO-containing mineral phases such as the FetO phase, CaO–Al2O3–FetO phase (abbreviated as CAF), and CaO–MgO–SiO2–FetO phase (abbreviated as CMSF) were observed for both C/S = 1.0 and 2.0. In contrast, when the target FetO concentration was 40% or less, the phase mainly composed of FetO was not observed, while that composed of CaO–Al2O3–SiO2 phase (abbreviated as CAS) was observed. The C2S solid solution phase was observed at C/S = 2.0, but not at C/S = 1.0.

EPMA composition images of samples after reduction at 1573 K. (Online version in color.)
The oxide phases other than metallic iron, confirmed by EPMA, are plotted on the phase diagram shown in Fig. 5. The samples produced in this study were complex mixtures containing CaO, SiO2, and FetO as the main components, along with Al2O3 and P2O5. For simplicity, the measured compositions of the samples were projected onto the SiO2–CaO–FetO system isothermal cross section at 1573 K.23) The results of C/S = 1.0 and 2.0 with target FetO concentrations of 5% and 60% are shown in the figure. The numerical value near the composition point represents the Al2O3 concentration.
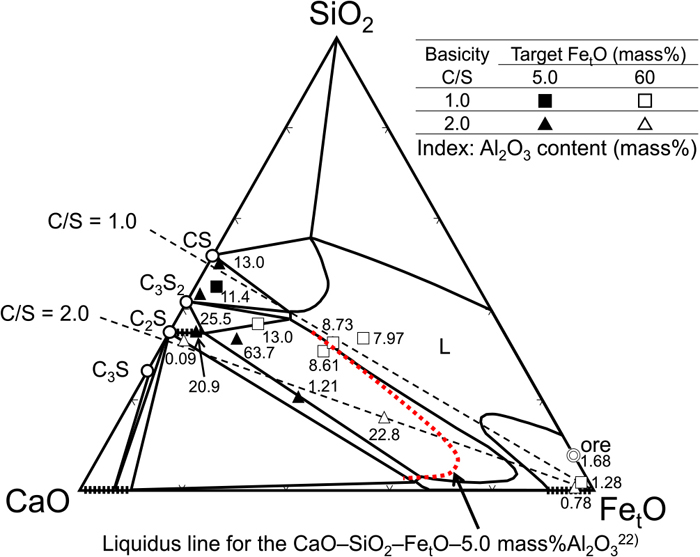
Comparison of oxide phases measured by EPMA by using SiO2–CaO–FetO system phase diagram at 1573 K.23) (Online version in color.)
Under the conditions of C/S = 1.0 and target FetO concentration of 60% (□ in Fig. 5), five phases including the FetO solid solution were observed. Since this phase diagram is divided into left and right by a wide uniform liquid phase region (L), the FetO solid solution and the phases on the left cannot coexist in an equilibrium state. The four phases other than the FetO solid solution are located near the line of C/S = 1.0, although the FetO concentration is different. In addition, according to the EPMA image in Fig. 4, there are many places where the FetO solid solution comes into columnar contact with the metallic iron. Therefore, if the four phases other than the FetO solid solution are regarded as the liquid phase, it can be inferred that the Fe component was in a transient state of being reduced, and when cooled, precipitated as the FetO solid solution or metallic iron from the uniform liquid phase. Under the conditions of C/S = 1.0 and target FetO concentration of 5% (■ in Fig. 5), where the reduction progressed further, only one phase was observed. In the phase diagram, this condition is located in a complicated region where the three phases CS, C3S2, and L, and Al2O3 and even Gehlenite and Anorthite can coexist. Calculated from the measured values, it is very similar to the condition in which the CS and 2CaO·Al2O3·SiO2 phases are presented at a ratio 4:1. Although it was regarded as one phase in EPMA, it can be inferred that the melting point was increased due to the removal of the Fe component from the uniform liquid phase, and the SiO2–CaO–Al2O3 system oxide remained.
Under the conditions of C/S = 2.0 and target FetO concentration of 60% (△ in Fig. 5), a total of three phases of FetO solid solution, C2S solid solution, and central part were confirmed along the line of basicity. Even under this condition, the left and the right phases of the uniform liquid phase region, which cannot coexist in the equilibrium state, were generated. As shown in Fig. 3, the target composition prior to heating is located in the two-phase coexistence region of the C2S solid solution and the liquid phase with a high FetO concentration. The liquidus line in the SiO2–CaO–FetO system phase diagram changes position depending on the oxygen partial pressure and the Al2O3 concentration. For example, Yajima et al.24) measured the liquidus of SiO2–CaO–FetO–5.0 mass% Al2O3 at PO2 = 1.8 × 10⁻³ Pa and reported that the liquidus shifts to the left due to the addition of Al2O3, as shown by the dotted line in Fig. 5. There is no report of a phase diagram in which the concentration of Al2O3 exceeds 5.0 mass%, but the liquidus is expected to shift still further to the left under such conditions. In the case of this sample, it can be inferred that Al2O3 remained in the liquid phase because of the crystallization of the FetO solid solution from the phase that existed in the liquid phase at high temperature, and as a result, a mineral phase with a high Al2O3 concentration was observed under the conditions of C/S = 2.0 and target FetO concentration of 5% (▲ in Fig. 5). In this case, the reduction progressed further and many phases that could not coexist in an equilibrium state were observed. The composition also varied greatly depending on the EPMA measurement area and the structure of the sample was non-uniform. However, it was suggested that the calcium silicate-based oxide tends to remain in a non-equilibrium phase, while the Fe component is reduced and removed from the solid–liquid coexistence state.
3.2. Relationship between FetO and P ConcentrationThe relationship between the FetO concentration in the oxide phase and the target FetO concentration is shown in Figs. 6 and 7, respectively. FetO was mainly present in the FetO solid solution phase and other phases, but it was also present in the C2S solid solution phase and the CAS phase (one of the components contained in the other phases) at approximately 0–10%. The FetO solid solution phase existed only in the sample with the target FetO concentration of 60 mass% and disappeared as the reduction proceeded. In the sample with 40 mass% or less, a low-melting-point liquid phase containing FetO was formed. It can be inferred that as the reduction progressed further, this changed to a high-melting-point solid phase containing Al2O3 and CaO as the main components.

Comparison of FetO content in oxide phases at C/S = 1.0.
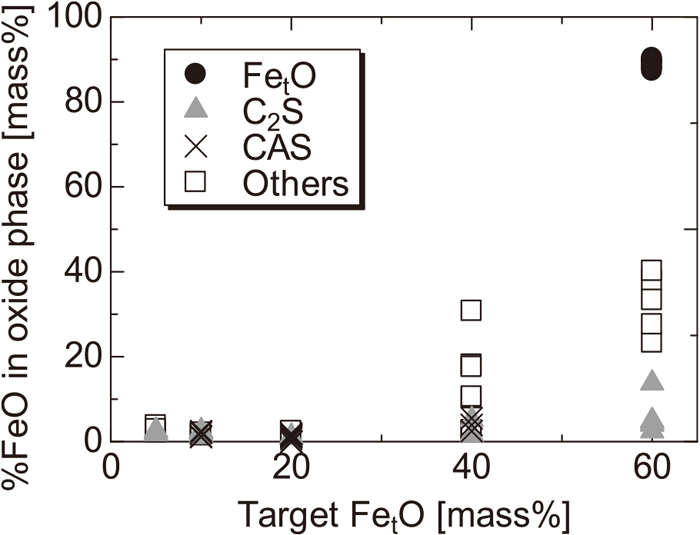
Comparison of the FetO content in oxide phases at C/S = 2.0.
Figures 8 and 9 show the relationship between P and the target FetO concentration in the metallic iron phase, C2S solid solution phase, and other phases of each sample. As shown in Fig. 4, the C2S solid solution phase was not observed for C/S = 1.0 and was observed for C/S = 2.0. For both C/S = 1.0 and 2.0, the higher the target FetO concentration, the lower the P concentration in metallic iron and the higher the P concentration in the oxide phase. This indicates that the oxygen partial pressure in the sample is dominated by the Fe/FetO equilibrium. Therefore, the higher the target FetO concentration, the higher the oxygen partial pressure and the higher the dephosphorization ability of the oxide phase. It was revealed that P is minimally distributed in metallic iron when C/S = 1.0 and the target FetO concentration is 20% or more or when C/S = 2.0 and the target FetO concentration is 40% or more. This is consistent with previous results of studies that used multiphase flux in the steelmaking dephosphorization process.11,12) In the sample with a target FetO concentration of 40%, P in the metallic iron phase was not detected at C/S = 1.0, whereas it was present at C/S = 2.0, although it was as low as 0.2% or less. This is contrary to the general tendency for P to be transferred to the oxide phase as the basicity increases. This could have occurred because the FetO concentration in the oxide phase is lower at C/S = 2.0, as shown in Figs. 6 and 7, and this indicates that it is important to control not only the basicity but also the FetO concentration.

Comparison of the P content in each phase at C/S = 1.0.

Comparison of the P content in each phase at C/S = 2.0.
The dephosphorization reaction between metallic iron and molten oxide generally depends on the oxygen partial pressure and the FetO concentration in the molten oxide. Figure 10 shows the relationship between the P distribution of metallic iron–molten oxide and the FetO concentration at C/S = 1.0. The distribution ratio LP of P was defined by the following equation:
| (2) |
| (3) |
Next, Fig. 11 shows the relationship between P distribution and FetO concentration in the coexisting C2S phase. The P concentration in the molten oxide and metallic iron is extremely small in the case of coexistence with C2S; therefore, it was evaluated by the P distribution ratio LP,SS11) between the C2S and the liquid phase defined by the following equation:
| (4) |
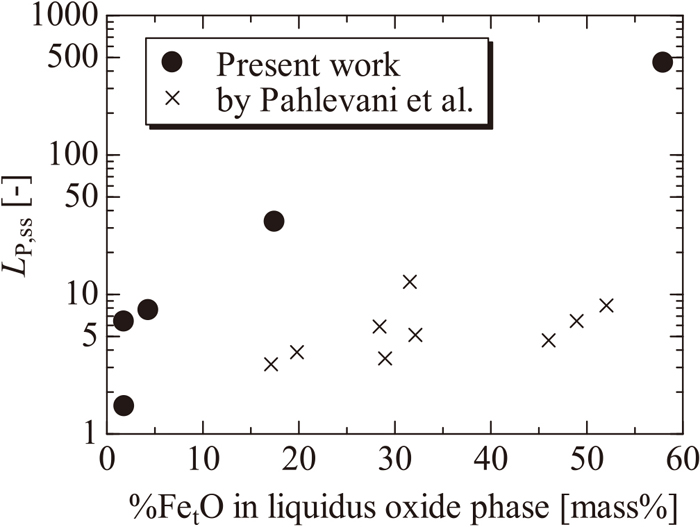
Influence of FetO content in liquid oxide phase on the distribution ratio of phosphorous between C2S and liquid oxide phases compared with results reported by Pahlevani et al.11)
Figure 12 shows the area ratios of the metallic iron phase, FetO solid solution phase, C2S solid solution phase, and other phases (main component: CaO–SiO2–FetO–Al2O3) in the sample with C/S = 2.0. The smaller the target FetO concentration, the higher the proportion of metallic iron phase and the lower the proportion of the oxide phase. Figure 13 shows the area ratio of various mineral phases in the C2S saturated system (C/S = 2.0) and the abundance ratio of P calculated from the analytical values. It was revealed that 80–95% of P was present in metallic iron when the target FetO concentration is 20% or less. In contrast, when the target FetO concentration was 40% or more, P concentration in metallic iron was low, and it was shown that 70% or more of P was present in C2S. With a target FetO concentration of 60%, it was found that 95% or more of P was concentrated in C2S. For the partial reduction treatment process of iron ore to be effective, it is important to efficiently concentrate P to the C2S phase to allow subsequent separation. This result strongly supports this possibility.
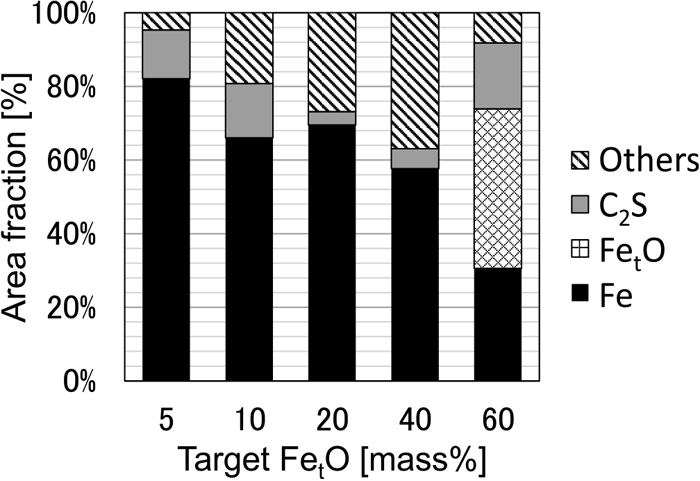
Area fraction of each phase at C/S = 2.0.
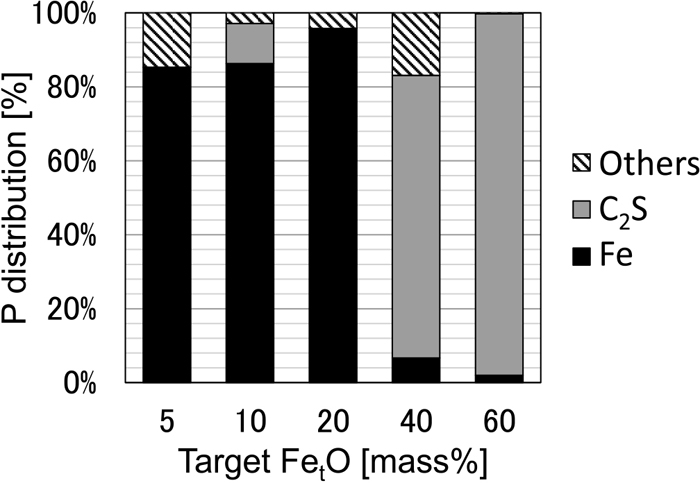
P distribution as a function of target FetO content.
Figure 14 shows the Si abundance ratios calculated using the same method. The Si in C2S is derived from the iron ore. It can be seen that Si in the treated sample is present in the C2S phase or other low-melting-point phases. Under conditions where the precipitation rate of C2S was high, the concentration rate of Si in the C2S phase was high. It is suggested that the separation of the C2S phase could reduce the amount of not only P, but also Si in the ore.

Si distribution as a function of target FetO content.
To adapt to the increase in P concentration in raw materials and to maintain a high quality steel product, we proposed a process of concentrating P present in iron ore into the dicalcium silicate (C2S) phase, which may be easily separated from the metallic iron. The constituent phases of the samples produced by partially reducing iron ore at 1573 K, to which CaO and graphite were added, were experimentally examined, resulting in several key findings. Although P is normally concentrated in the metallic iron phase as the reduction progresses, when the FetO concentration in the oxide phase is 10% or more, the reduction is suppressed and P remains in the oxide phase. When C/S = 1.0, the C2S phase is not generated and P is distributed to other oxide phases. When C/S = 2.0, a C2S phase in which P dissolves is formed, and P is distributed to the oxide phase above the equilibrium value. Under the conditions of C/S = 2.0 and target FetO = 60%, 95% or more, the P in the iron ore is distributed to the C2S phase rather than into the metallic iron product.
This work was supported by a Promotion Grant and the Network Joint Research Center for Materials and Devices, JSPS KAKENHI Grant Number JP20K05591, and Support Program of IMRAM. We would like to thank the members of the Ecotechnology Young Research Forum of the Division of Sustainable Systems in ISIJ and Professor Hiroshi Nogami of the Institute of Multidisciplinary Research for Advanced Materials, Tohoku University for their useful advice. We thank Akihisa Ito and Miho Hayasaka for their research support. We would like to thank Editage (www.editage.com) for English language editing.
