Abstract
A method to quantify regular graphite and turbo-stratified graphite (TS-graphite) forming the free carbon in ductile cast iron was developed using X-ray powder diffractometry. Iron in accurately sampled 2–4 g of the ductile cast iron powder was decomposed using hydrochloric acid without heating, and the residue was centrifugally separated. Graphite, TS-graphite, wustite (FeO), and amorphous silicate were identified in the residue. Calibration-standard mixtures were prepared by mixing corundum (α-Al2O3), griceite (LiF), and graphite powder which showed the most similar full-width at half-maximum value of (002) line to that of graphite in the ductile cast iron sample. The calibration curve of graphite showed good linearity, with a range of 0–200 mg corresponding to the 0–5.0 mass% of graphite in the 4.00 g of the cast iron sample. The quantitative value of total graphite in the ductile cast iron sample was 3.17 mass% with 8.0% of relative standard deviation for n = 5. The peak area ratio of graphite and TS-graphite was calculated using Rietveld refinement by assuming the same atomic scattering factor for each graphite measurement. The concentration ratio of graphite and TS-graphite were 67.8 and 32.2%, respectively. The analytical values of graphite were in good agreement with those of the NIST gray cast iron standard material, with concentration ratio of 53.7% and 46.3% for graphite and TS-graphite, respectively.
1. Introduction
Casting, which is used to fabricate various products, was first adopted in Mesopotamia during the Bronze Age in 3500 BC, and it propagated to Europe, Southeast Asia, and China. However, the development of a casting technique for iron was a challenge owing to the high melting point of iron.1) Casting was formulated through the development of a melting iron technique in China at 500 BC.2) This technique was handed down to Japan from China at 538 during the introduction of Buddhism, for which it was used in various regions to fabricate Buddhist altar fittings and statues.1) Thereafter, the casting technique was developed in Japan. Presently, cast irons are used in the infrastructure industry for the production of automobile parts, industrial machines, hardware for buildings, water, and wastewater, and splicing chambers.
Cast iron comprises a group of Fe–C alloys that contain 1.5% to 6.7% of carbon existing as cementite (Fe3C) and graphite. Various types of cast irons, which are classified by graphite configurations, have been developed to date, such as those of flaky graphite (gray cast iron), nodular graphite (ductile cast iron), vermicular graphite, and white cast.3) The mechanical and chemical characteristics of cast iron depend on its graphite content and shape of educts.4) Heterogenization due to the nucleation and large content of graphite, decreases the partial strength of cast iron and increases the overall fragility.5) Therefore, when cast iron is refined, the graphite characteristics must be altered depending on the purpose of application.6) High-stability ductile cast iron is obtained by adding a basic slag,7) Ce, or Mg8,9) to the cast iron as a contact agent.
An analytical method of carbon in cast iron for ensuring quality control used in industry is named JIS G 1211-1 to 1211-5.10,11,12,13,14) The combustion method in JIS G 1211-1 to 1211-310,11,12) is used to determine the total carbon in the cast iron. As the configuration and quantity of the graphite affects the fragility of the casting, gravimetry, gas-volumetric analysis, and infrared absorption spectrometry of CO2 in residue after decomposition of iron sample with nitric acid in JIS G 1211-5.14) In addition, electron microscopy6,15,16) and X-ray fluorescence spectrometry17) are used to perform quantitative analyses of the carbon in cast iron. These methods yield the analysis of the total carbon in cast iron; however, they do not allow the separative analysis of graphite and its polymorphism. X-ray diffractometry, which is used for the analysis of crystalline materials, such as zinc oxide,18) asbestos,19) calcium sulfate in air particles,20) cement,21) refractory materials,22) and sintered ore23) can be used to distinguish the analysis of different crystal phases of graphite and its polymorphism. Therefore, we propose a method to easily provide separative determination for different types of graphite by X-ray diffraction (XRD). Regular graphite and turbo-stratified graphite (TS-graphite) contained in cast iron24,25,26) were analyzed by internal standard X-ray powder diffractometric determination of residue after acid decomposition of cast iron sample. However, the quantitative analysis of graphite is challenging, owing to the variation in the diffraction intensity ratio of graphite packed into a sample plate by pressure loading, because graphite shows a distinctly preferred orientation toward the [00l] direction.
In this study, we propose the followings: (1) a method to decompose the matrix components in cast iron by hydrochloric acid, (2) adaptation of internal standard method to the quantification of graphite, (3) selection of a graphite powder for calibration and the suppression of the characteristics of the preferred orientation through dilution by corundum (α-Al2O3) powder, and (4) separative analyses of regular graphite and TS-graphite by peak decomposition with XRD - Rietveld refinement.27)
2. Experimental
2.1. Apparatus
XRD analysis was performed on a RINT-TTR III diffractometer (Rigaku Co., Japan) equipped with a horizontal goniometer (radius of 285 mm) and a scintillation counter, using Cu Kα radiation with a monochromator at a tube voltage of 50 kV and tube current of 300 mA. Bragg-Brentano geometry was applied to the optical setup, with a 2/3° divergence and scattering slit and a 0.3 mm receiving slit. The sample was packed into an aluminum holder. The diffraction intensities were calculated as the average value of five refilling measurements. All diffraction and Rietveld refinement analyses were carried out using PDXL software (Rigaku Co., Japan).
Elemental analysis was performed using a Rix 3100 X-ray fluorescence spectrometer (Rigaku Co., Japan) equipped with an end-window 4 kW Rh X-ray tube operating at a tube voltage of 50 kV and tube current of 80 mA. A scintillation counter and gas flow proportional counter were used as detectors, in which P-10 gas was flowed at 50 cm3 min−1. LiF(200), PET(002), Ge(111), and TAP(001) were used for the analyzing crystals.
A mixer mill (MM 200, Retsch GmbH, Germany) was used for the pulverization of the samples, and an alumina mortar with 120 mm of internal diameter and pestle was used for mixing of the samples by hand to avoid the grinding effect. The samples for elemental analysis packed into a resin ring of vinyl chloride were pressed using a press machine (P-18; Riken Keiki Co., Ltd., Japan) to prepare the pellet samples. An air flowing dryer (FS-320; Advantec Ltd., Japan) was used to desiccate the samples. A centrifugal separator (HimacCT4i, Hitachi Ltd., Japan) with a 50 mL centrifuge tube made of polytetrafluoroethylene (PTFE) was used to separate the residue and the solvent.
2.2. Sample and Reagents
For the quantification of graphite, a commercially available ductile cast iron sample in Japan was used. Samples were granular grayish black powder accompany with small metallic brilliances with 0.5–1.5 mm of particle size. Twenty g of the powder was ground by mixer-mill until its particle size reached to under 325 mesh sieve (<44 μm). Hydrochloric acid (12 mol L−1, Junsei Chemical Co., Ltd., Japan) was used for the acid cleavage, and demineralized water and ethanol (99%, Junsei Chemical Co., Ltd, Japan) were used as a washing agent for the residues after centrifugal separation. The graphite powder exhibiting similar full width at half maximum (FWHM) to that of the (002) diffraction peak of graphite in the ductile cast iron selected from four graphite powders, that are from Analytik Jena AG, Germany (AJ), Wako Pure Chemical Industries, Ltd., Japan (WK), Hitachi Chemical Company. Ltd., Japan (HC), and GL Sciences Inc., Japan (GL) was used for standard material to draw the calibration curve. Corundom (α-Al2O3, Wako Pure Chemical Industries, Ltd., Japan) was used as the diluting agent for the matrix of calibration mixtures, and griceite (LiF, Junsei Chemical Co., Ltd, Japan) was used as the internal standard material according the selection criteria of internal standard materials for X-ray diffractometric quantification.28) An NIST gray cast iron standard (certified value of graphite: 1.98 mass%) was used for verification of the calibration curve and quantitative results.
2.3. Proposed Analytical Procedures
Two-four gram of ductile cast iron sample was treated with 40 mL of concentrated hydrochloric acid in a tall beaker (300 mL) for 24–72 h to dissolve iron. 40 mL of deionized water was added to the residue after decantation to remove the solution, and the suspension was put into the centrifuge tube (50 mL) made by PTFE. The residue was washed a total of four times, one time with distilled water and three times with ethanol. The resultant residue in the tube was placed on a hotplate at 110°C to evaporate the ethanol, and the remaining ethanol and water was removed using an air flowing dryer at 140°C. To prepare the specimen for quantification, the residue was diluted to 2.000 g with corundom powder, and then 0.200 g of griceite as an internal standard material was added to the diluted residue. The mixture was homogenized in the alumina mortar and pestle by hand for 30 min.29)
The mixture was packed into a glass sample plate for XRD measurement. The integrated intensities of graphite (002) appeared at 26.5°/2θCuKα and griceite (200) at 44.9°/2θCuKα as the internal standard were calculated from the average value of the five refilling measurements. The calibrating standards were prepared using graphite powder with a similar FWHM to that of graphite in ductile cast iron, aluminum oxide powder as the diluting agent, and griceite powder as the internal standard material. The quantification range of the calibration curve was 0–200 mg of graphite (from 0 to 5 mass% in 4 g of ductile cast iron).
3. Results and Discussion
3.1. Identification of Crystalline Phases in Ductile Cast Iron
Diffraction pattern of ductile cast iron samples with and without hydrochloric acid treatment were measured to identify crystalline phases (Fig. 1(a) and 1(b)). The ductile cast iron was passed through a sieve with 250 mesh (58 μm opening) after grinding by the mixer mill for 90 min. Diffraction peaks of graphite were not detected, although the peaks of iron were only observed (Fig. 1(a)) because the diffracted X-ray from graphite were absorbed by iron as a matrix component with a high μ*CuKα (302 cm2/g) toward that of graphite (4.51 cm2/g). Conventionally used nitric acid or nitro-hydrochloric acid is used for the dissolution of iron matrix; however, graphite is merely dissolved by producing graphitic acid because of the high oxidizability of nitric acid. In contrast, as hydrochloric acid having low oxidizability was used for the removal of iron in ductile cast iron. The identified phases in the residue after acid treatment are shown in Fig. 1(b), and the elemental compositions are shown in Table 1. The XRD peaks of graphite, wustite (FeO), and halo from the amorphous phase were identified on the pattern of the residue after acid treatment. The halo was due to a mixture of amorphous SiO2 and carbon, because the main component of the residue was silicon. Figure 1(c)–1(g) shows the diffraction patterns of the incinerated residue at 800°C after hydrochloric acid treatment of ductile cast iron (c), residue with hydrochloric acid treatment (d), silica gel (e), silica glass (f), and activated carbon (g). The residue (c) was incinerated at 800°C to remove carbonaceous phase. The diffraction peaks of graphite were not observed in the pattern (c) although the diffraction peaks of rutile (TiO2) were identified, and the halo maximum at 22°/2θCuKα on this pattern was fitted to that of silica glass (f) even if the heating temperature was lower than 1200–1400°C of glass transition temperature for silica.30) In addition, the halo pattern of residue after only hydrochloric acid treatment (d) showed just like overlapped pattern of silica gel (e) and activated carbon (g). This silica phase was might be formed the acid decomposition of ferrosilicon (FeSi) or ferrosilicomanganese (FeSiMn) in the ductile cast iron, and silica gel was formed by the dehydration of silicate sol formed after dissolution of these ferrosilicon species. Consequently, the residue of the hydrochloric acid treatment of ductile cast iron was composed of graphite, wustite, amorphous silica, and amorphous carbon.
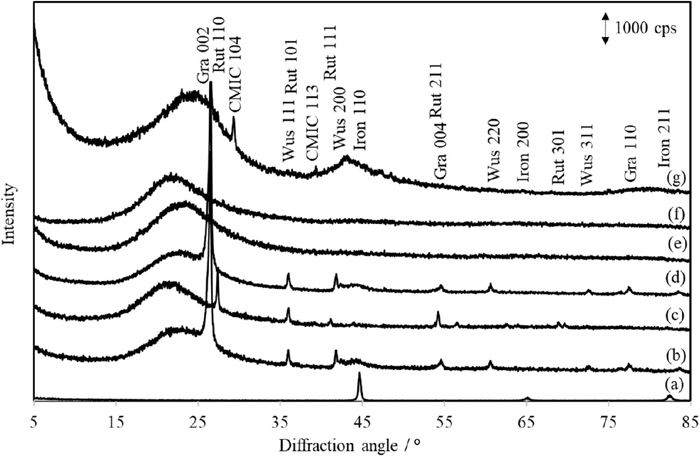
Table 1. Elemental composition in the ductile cast iron sample after hydrochloric acid treatment obtained by FP-WDXRF method.
| Element | Concentration / mass% |
|---|
| Si | 86.2 |
| Ti | 4.58 |
| Fe | 4.40 |
| Cl | 3.74 |
| S | 0.233 |
| Ca | 0.187 |
| P | 0.161 |
C (Carbon): Not determined.
Under the melting conditions of cast iron, carbon dissolved in iron is distributed homogeneously. However, crystallized graphite phases in solid iron can be heterogeneously distributed owing to the production of white pig iron in cast iron by a rapid cooling.31) The heterogeneous distribution of graphite serves as error factors in the quantification not only graphite but carbon. The relationship between the weights of the ductile cast iron sample and the XRD intensities of graphite on the (002) lattice plane is shown in Fig. 2 in order to ensure the quantitative ability of graphite. Griceite (200) was chosen as the internal standard and griceite powder added to the cast iron samples in constant weight. The selection criteria of an internal standard28) are as follows, (1) showing close values of the absorption coefficient of analyte, (2) appear neighboring angle of analytical line without overlapping (3) having sufficient mechanical stability, (4) lacking preferred orientation, (5) having high crystallinity. Griceite (200) appeared at 44.9°/2θCuKα was used as the internal standard, which had almost the same μ*CuKα (12.20 cm2/g) as that of graphite and satisfies the above conditions.
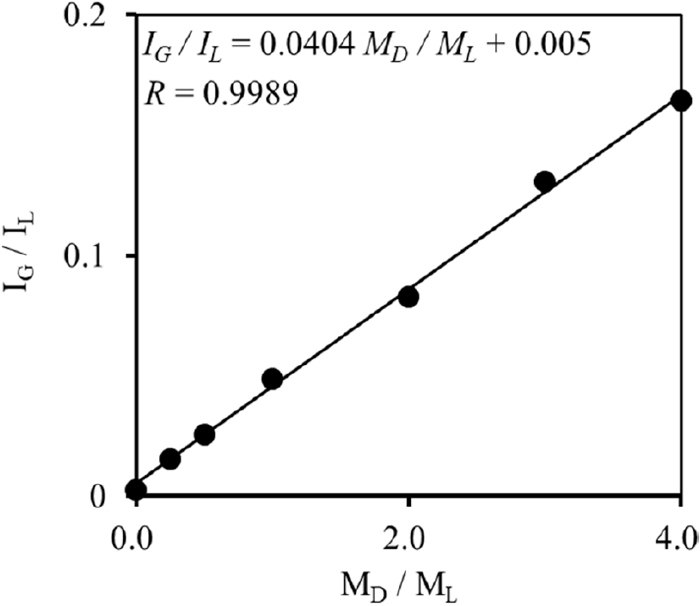
The relationship between the weight ratio of the ductile cast iron sample to griceite and the XRD intensity ratio of graphite to lithium fluoride showed good linearity (R = 0.9989) up to 4.0 g. The relative standard deviations (r.s.d., n = 6), ranged from 1.9% to 9.1%, and good repeatability was obtained for each plot. This result shows that graphite was distributed homogeneously in only 0.25 g of ductile cast iron sample and can be quantified with the calibration curve method.
3.3. Selection of Graphite for Calibrating Standard
The graphite in the cast iron sample exists in various forms which affect the profile of most intense diffraction peaks (002) showing different configurations owing to cooling conditions with or without a contact agent.7,8,9) These difference result from concentration of coexisting TS-graphite, in addition to the crystallite size, amount of lattice strain, and number of lattice defect.4) Graphite powder, with the same crystal state as graphite in ductile cast iron, was selected as the calibrating standard used to prepare the calibration curve. The crystallinities among the four graphite powders after 15 min grinding and the graphite in ductile cast iron sample after acid decomposition were confirmed by comparing the diffraction patterns. Figure 3 shows the diffraction patterns of the four graphite powders and residual graphite in the ductile cast iron after hydrochloric acid treatment, and Table 2 shows the FWHM of the diffraction peaks of the (002) lattice plane associated with each graphite measurement. The FWHM of graphite HC showed good agreement with that of the graphite from the ductile cast iron sample. Therefore, this graphite powder was used as the calibrating standard to determine the graphite content in the ductile cast iron sample. In addition, swelling at 26.2°/2θ on the diffraction pattern of the ductile cast iron originates from the diffraction peak of TS-graphite, as described in 3–5 section. Also, it is considered that differences of the tails of each diffraction pattern between the ductile cast iron and the four graphite powders were associated with differences of the particle size distribution of graphite.

Table 2. FWHMs and integrated intensities for the four graphite powders and residue with hydrochloric treatment of the ductile cast iron sample.
| Sample | FWHM / ° | Integrated intensity / counts |
|---|
| Analytik Jena | 0.2072 | 19892.13 |
| Wako | 0.2909 | 19398.14 |
| Hitachi Chemical | 0.2852 | 4498.24 |
| GL Science | 0.2536 | 7518.65 |
| Residue of ductile cast iron | 0.2705 | 196.06 |
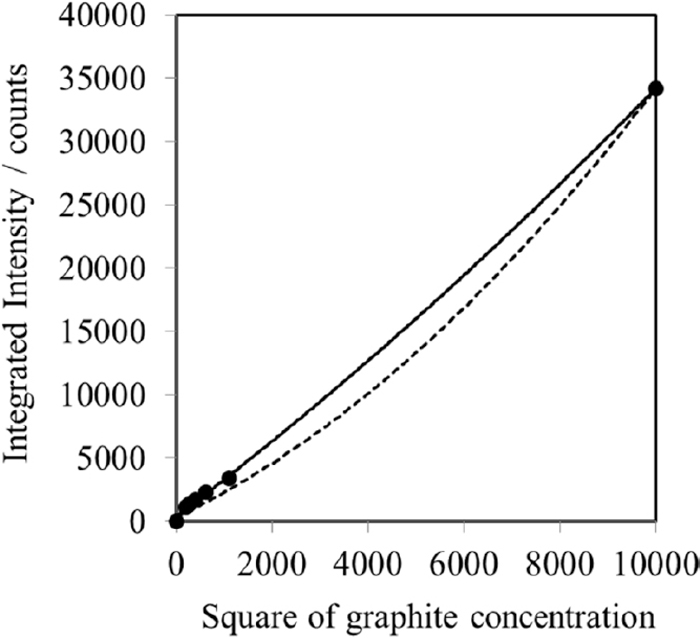
The lattice planes of the crystalline phases are set in the same direction by compressive filling because of the preferred orientation when the sample is packed into the sample holder. The preferred orientation occurs owing to the cleavage or anisotropic growth of the crystalline phase. The XRD intensities of certain lattice planes are changed by the preferred orientation.33) Graphite exhibits a preferred orientation with respect to the lattice plane in the [00l] direction; consequently, the XRD intensities of [00l] are observed with higher magnitudes than those of the other diffraction intensities, although the XRD peaks of (002) show the highest intensity. Generally, the other XRD peaks of graphite without the preferred orientation should be used for analysis instead of the (002) peak. However, the 2nd or 3rd intense peak show extremely low, if these peaks are detected at all, and a large statistical error may be present in the data. Therefore, a method for suppressing the preferred orientation with mixing of powder with indeterminate form was adopted to this quantitation of graphite. Testing mixtures were prepared by mixing corundom powder as a matrix working the orientation suppressor and graphite powder with a mortar for 20 min. The weight ratio of corundom to graphite powder was set as follows: 1:2, 1:3, 1:4, 1:5, and 1:6. The relationship between the graphite concentration and integrated intensity is shown in Fig. 4. The relative standard deviations (n = 7) showed low values (from 1.8% to 2.6%). The relationship shown in Fig. 4 was approximated by a quadratic equation (solid line), as the integrated intensities of graphite were affected by the absorption effect. This absorption effect was corrected by dividing the μ*CuKα of graphite by that of the sample, and the corrected theoretical calibration curve is shown as a dotted line in Fig. 4. The horizontal axis was shown as a square of graphite concentration to compare the two relationship line owing to clearly confirmation. The effect of the preferred orientation was still observed even if the absorption effect was corrected by the mass absorption coefficient μ*CuKα of sample and diluted by corundum powder. However, it is considered that the effect of the preferred orientation after correcting the absorption effect was almost small at the low concentration range as an actual quantification range of graphite because the difference between the measured and calculated lines was shown smaller than the high concentration range. In addition, the relationship line at the low concentration range up to 20 mass% of the graphite concentration was shown as the linear line (R=0.9983). Therefore, the calibration curve was applied for the quantification of graphite in the ductile cast iron because the effect of the preferred orientation was almost suppressed by diluted with corundum powder as a matrix.
The calibrating standards were prepared using graphite powder with a similar FWHM to that of graphite in ductile cast iron, aluminum oxide powder as the diluting agent, and griceite powder as the internal standard material. The quantification range of the calibration curve was 0–200 mg of graphite (from 0 to 5 mass% in 4 g of ductile cast iron). The calibration curve of graphite, with the integrated intensity of graphite corrected by the intensity of griceite as the internal standard, is shown in Fig. 5. Good linearity was observed up to a graphite content of 5.00 mass%. The lower limit of the detection of graphite was determined to be 38.8 μg (19.4 mass ppm), calculated using three times the standard deviation of the blank samples. The calibration curve was evaluated using the gray cast iron standard issued by National Institute of Standards and Technology (NIST), and the analytical results are shown in Table 3. The free carbon in the ductile cast iron sample was quantified by the prepared calibration curve, with an analytical value of 3.17 mass% with 8.0% of relative standard deviation calculated from each 6 sample (n = 6). The analytical value of 2.01 mass% of graphite in the NIST gray cast iron standard showed good agreement with the certified value of graphite (1.98 mass%).
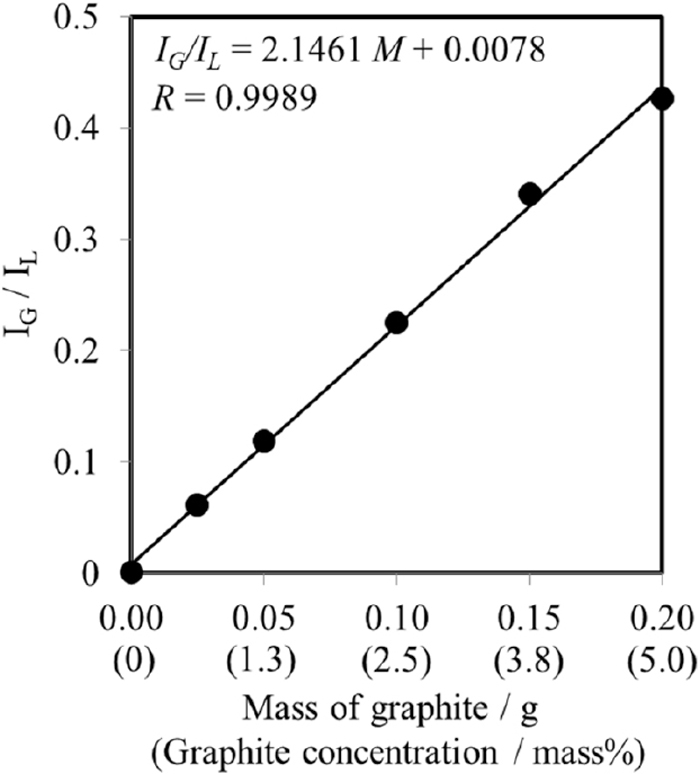
Table 3. Quantification results of free carbon (total graphite), graphite, and TS-graphite in the ductile cast iron and the NIST gray cast iron material calculated by Rietveld refinement.
| Concentration / mass% |
|---|
| Ductile cast iron | NIST gray cast iron (Certified value: 1.98 mass%) |
|---|
| Free carbon | Regular graphite | TS-graphite | Free carbon | Regular graphite | TS-graphite |
|---|
| 1 | 3.18 | 2.16 | 1.02 | 2.08 | 1.13 | 0.95 |
| 2 | 3.25 | 2.20 | 1.05 | 2.15 | 1.21 | 0.94 |
| 3 | 3.36 | 2.27 | 1.09 | 2.10 | 1.15 | 0.95 |
| 4 | 3.47 | 2.35 | 1.12 | 1.81 | 0.95 | 0.86 |
| 5 | 2.77 | 1.87 | 0.90 | 1.91 | 0.99 | 0.92 |
| 6 | 3.00 | 2.02 | 0.97 | – | – | – |
| Average | 3.17 | 2.15 (68%) | 1.02 (32%) | 2.01 | 1.08 (54%) | 0.93 (46%) |
| R. s. d.*/% | 8.0 | 8.1 | 9.0 | 7.1 | 3.2 | 3.8 |
Parenthesis on the average: Content rate toward total graphite content.
*: Relative standard deviation,
n = 6.
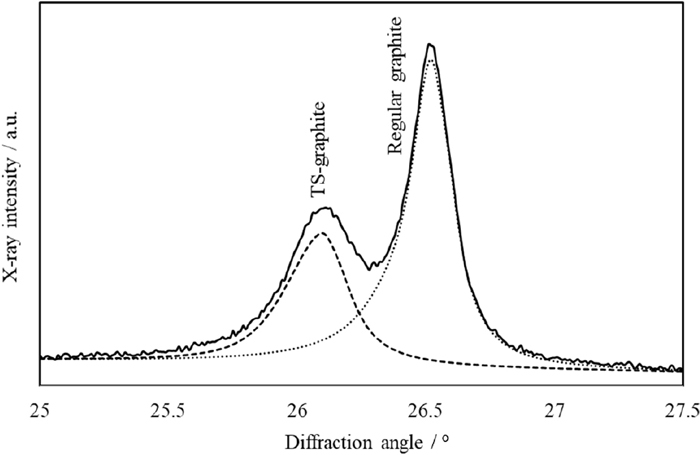
The cast iron is composed of two types of graphite, namely, regular graphite and TS-graphite. The fragility of the cast iron is affected by the graphite configuration and content, and it control the characteristics of iron production. Therefore, the quantification of the separate types of graphite was performed by peak decomposition using Rietveld refinement.
The diffraction peaks of graphite and TS-graphite were confirmed by the diffraction pattern of the ductile cast iron sample. Both diffraction peaks on the diffraction pattern of the ductile cast iron sample were separated using Rietveld refinement with the assumption that the structure of TS-graphite was the same as that of regular graphite in a hexagonal system (Fig. 6). Rietveld refinement was used to observe and calculate diffraction patterns from the initial crystal structure, utilizing the least-squares method by refining each parameter. The repeatability of peak decomposition largely affects the analytical results, because the overlapping diffraction peaks are separated by peak decomposition in the Rietveld refinement method. Actually, each parameter resulting from Rietveld refinement needs to assume the same value because the diffraction peak configurations of graphite and TS-graphite obtained by the peak decomposition depend on the FWHM, asymmetry, and decay factors. Table 3 shows the quantitative values of regular graphite, TS-graphite, and free carbon. The quantitative values of regular graphite and TS-graphite were obtained by multiplying the diffraction intensity ratio of the graphite and TS-graphite obtained from the peak decomposition using Rietveld refinement with respect to the free carbon content. Consequently, out of the 3.17 mass% of free carbon contained in the ductile cast iron sample, approximately 32% (1.02 mass%) was of the TS-graphite form.
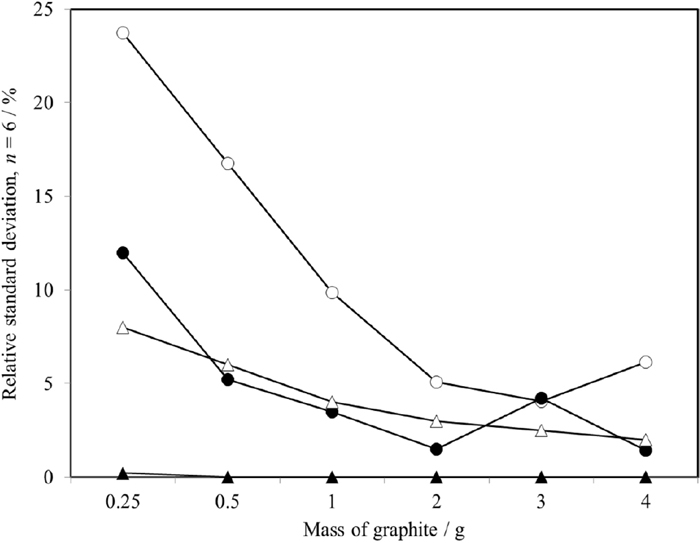
The repeatability of the diffraction peak intensities of graphite and TS-graphite obtained by peak decomposition demonstrated in terms of the relative standard deviation is shown in Fig. 7. This is shown along with the statistical fluctuations from the average values of diffraction intensities of graphite and TS-graphite and the repeatability through Rietveld refinement obtained from repetitive simple calculations, demonstrating that the repeatability depends on various factors such as peak width, asymmetry and attenuation factor associated to profile parameters. The peak decomposition from the calculations showed good repeatability, and relative standard deviation was calculated as almost zero, signifying that similar diffraction peak configurations and diffraction intensities in the peak decomposition were obtained by Rietveld refinement. The repeatability of the diffraction intensities of graphite and TS-graphite by peak decomposition was improved with increasing graphite content. In addition, the statistical fluctuation of diffraction intensities showed a similar trend, demonstrating similar diffraction intensities for graphite and TS-graphite by peak decomposition. Consequently, the repeatability of the peak decomposition was shown to improve with increasing diffraction intensity, and the same results in the peak decomposition were obtained by acquiring a sufficiently high diffraction intensity.
4. Conclusion
XRD was applied for the quantification of free carbon in the ductile cast iron sample. Diffraction peaks of graphite were detected by removing iron using hydrochloric acid, which has low oxidizability, although the diffraction peak of the graphite was not detected without chemical treatment owing to the absorption effect. To prepare the calibration curve of graphite, the FWHM of the graphite from the Hitachi Chemical Company was related to that of the graphite in the ductile cast iron sample by comparing the diffraction peaks of four graphite powders and the graphite in the ductile cast iron sample exhibiting the same crystal structure. Consequently, a graphite powder from Hitachi was used to prepare the calibration curve. To use the calibration curve for quantification, an internal standard material is necessary to correct for the absorption effect. Graphite with a similar μ*CuKα was added as the internal standard, and the diffraction peak ratio calculated from the diffraction peaks of graphite (002) to that of griceite was used to prepare the calibration curve. In addition, the effect of preferred orientation was decreased by applying aluminum oxide as a matrix. Good linearity for the calibration curve was exhibited up to a graphite amount of 0.20 g. The calibration curve was applied to analyze graphite in the ductile cast iron because a good evaluation of the calibration curve was indicated by using the gray cast iron standard reference material. Graphite and TS-graphite in the ductile cast iron sample were quantified by peak decomposition using Rietveld refinement. The repeatability of the diffraction intensities of graphite and TS-graphite by peak decomposition was improved with increasing graphite content. Using Rietveld refinement, approximately 32% (1.02 mass%) of the free carbon amount in the ductile cast iron sample, calculated by peak decomposition, is TS-graphite. The separation and subsequent quantification of regular graphite and TS-graphite yielded an increased understanding of the characteristics of the iron products in cast iron.
References
- 1) K. Ikawa: J. Jpn. Soc. Mech. Eng., 87 (1984), 703.
- 2) D. M. Stefanescu: Mater. Sci. Eng. A, 413–414 (2005), 322.
- 3) S. Itomura, K. Heshiki, F. Matsuda and Y. Kikuta: Q. J. Jpn. Weld. Soc., 6 (1988), 406.
- 4) S. Hagiwara and T. Makiguchi: Imono (J. Jpn. Foundarymen’s Soc.), 39 (1967), 542.
- 5) I. Minkoff: The Physical Metallurgy of Cast Iron, John Wiley & Sons, New York, (1983), 55.
- 6) H. Arai: J. JFS, 76 (2004), 599.
- 7) A. Wittmoser: Giesserei, 38 (1951), 469.
- 8) H. Morrogh and W. J. Williams: J. Iron Steel Inst., 158 (1948), 306.
- 9) A. P. Gagnebin, K. D. Millis and N. B. Pilling: Iron Age, 163 (1949), 77.
- 10) JIS G 1211-1: 2011, Iron and steel - Determination of carbon content - Part 1: Combustion gravimetric method (in Japanese).
- 11) JIS G 1211-2: 2011, Iron and steel - Determination of carbon content - Part 2: Gas volumetric method after combustion (in Japanese).
- 12) JIS G 1211-3: 2018, Iron and steel - Determination of carbon - Part 3: Infrared absorption method after combustion (in Japanese).
- 13) JIS G 1211-4: 2011, Iron and steel - Determination of carbon content - Part 4: Infrared absorption method after combustion in a furnace with preheating or peak separating (in Japanese).
- 14) JIS G 1211-5: 2011, Iron and steel - Determination of carbon content - Part 5: Determination of non-combined carbon (in Japanese).
- 15) J. Li, L. Lu and M. O. Lai: Mater. Charact., 45 (2000), 83.
- 16) S. Vazehrad, J. Elfsberg and A. Diószegi: Mater. Charact., 104 (2015), 132.
- 17) T. Hanafusa, S. Mizunari and K. Mori: Bull. Hiroshima Prefect. Technol. Res. Inst. East. Reg. Ind. Res. Cent., 16 (2003), 82.
- 18) T. Nakamura and H. Sasuga: Bunseki Kagaku, 29 (1980), 824.
- 19) T. Asahi, S. Kobayashi, K. Nakayama, T. Konya, G. Fujinawa and T. Nakamura: Anal. Sci., 27 (2011), 1217.
- 20) T. Nakamura: Powder Diffr., 3 (1988), 86.
- 21) A. Ohbuchi, T. Konya and G. Fujinawa: Powder Diffr., 28 (2013), 249.
- 22) A. Ohbuchi, Y. Yamada, I. Tomatsu, H. Asakura and M. Murata: J. Tech. Assoc. Refract. Jpn., 35 (2015), 250.
- 23) S. Ichikawa, D. Fujimura, A. Ohbuchi and T. Nakamura: ISIJ Int., 56 (2016), 2228.
- 24) Z. Q. Li, C. J. Lu, Z. P. Xia, Y. Zhou and Z. Luo: Carbon, 45 (2007), 1686.
- 25) Y. Hishiyama and M. Nakamura: Carbon, 33 (1995), 1399.
- 26) R. Radhika, N. Kumar, R. Pandian, T. R. Ravindran, S. Dash and A. K. Tyagi: Surf. Coat. Technol., 253 (2014), 300.
- 27) H. M. Rietveld: J. Appl. Crystallogr., 2 (1969), 65.
- 28) T. Nakamura and H. Sasuga: Bunseki Kagaku, 22 (1973), 47.
- 29) A. Ohbuchi, M. Kitano and T. Nakamura: X-Ray Spectrom., 37 (2008), 237.
- 30) K. Saito and A. Ikushima: J. Appl. Phys., 81 (1997), 7129.
- 31) Y. Osawa, T. Namai, M. Kikuchi and A. Sato: Imono (J. Jpn. Foundarymen’s Soc.), 59 (1987), 607.
- 32) T. Nakamura and H. Sasuga: Bunseki Kagaku, 29 (1980), 467.