New Materials and Processes
Feasibility Study of Visualizing Strain Distributions Using Opal Film
2022 Volume 62 Issue 1 Pages 257-262

Details
2022 Volume 62 Issue 1 Pages 257-262
This paper presents a feasibility study of visualizing the strain distribution of structural elements using opal film. Opal film with an initial peak wavelength of 510 nm was employed in tensile and four-point bending tests to evaluate the feasibility of visualizing the strain distribution using this type of film. The experimental results of the tensile and four-point bending tests show that the peak wavelength has a linear relationship with the first invariant of the strain. The slope of the experimentally obtained relationship between these variables showed good agreement with the theoretically predicted slope. In the four-point bending test, visualization of the first invariant of the strain using opal film was successfully demonstrated, thereby confirming the feasibility of strain visualization using opal film.
In developed countries, such as the United States, European Union member states, and Japan, the amount of aged infrastructure will rapidly increase in next few decades, and completely replacing this aged infrastructure is difficult because of economic limitations. Thus, the structural health monitoring (SHM) of civil infrastructure is an important maintenance strategy to elongate the lifespan of infrastructural facilities such as bridges, towers, buildings, tunnels, dams and highways.1) Almost one century has passed since the strain gauge was developed. At present, the strain gauge is the most commonly used device to measure the strain. To effectively and economically perform SHM, a wireless strain measurement system that does not require a power source is preferable. Furthermore, a method of visualizing the strain distribution would be highly advantageous from the viewpoint of visual inspection.
The optical and non-contact technologies have been developed to meet the demand presented above. The digital image correlation (DIC) is a kind of such technologies. The DIC was proposed in 1980s, and is currently most commonly used technology for strain, stress and deformation measurement because of the progress of computer power, memory storage, digital camera and software.2,3,4) The electronic speckle pattern interferometry (ESPI) is also an optical and non-contact technologies.5,6,7) Localization of a tensile test of ductile 316 stainless steel has been measured in detail by using the in-plane ESPI.6) The sampling moiré method is also a kind of such technologies, and seems to be applicable to large scale structures such as a long bridge.8,9) New materials for strain or stress measurement have also been developed in the past decade to meet the demands presented above. Mechanochromic materials composed of organic polymer composites reversibly change color under applied elongation and compression.10) Mechanoluminescent materials composed of inorganic nano-powders repeatedly emit visible light in response to small applied stresses.11,12) Additionally, the use of materials with tunable structural colors has been proposed for strain sensing applications.13,14,15,16,17,18) The implementation of one such material, called colloidal photonic crystal film or opal film, for strain visualization via structural color change has been attempted in these previous studies. However, the change in the peak wavelength was not calibrated to the engineering strain, which was measured using strain gauges. Moreover, the change in the peak wavelength with the compressive strain has not been discussed in previous studies. The tensile and compressive strain measurement capability of materials with tunable structural colors is very important for their practical implementation in strain measurement and SHM applications.
In this paper, a feasibility study of the use of opal film for the visualization of strain distributions with tensile and compressive states is presented. Firstly, the relationship between the peak wavelength and the strain is theoretically presented. Then, a tensile test is presented to observe the change in the peak wavelength and validate the theoretical equation. Finally, a four-point bending test is presented to observe the strain distribution of specimens in tensile and compressive states using the opal film.
The opal film used in this study was fabricated using in-house coating equipment,15) and the initial peak wavelength is approximately 510 nm. The film consists of two layers: an opal photonic crystal film and a sheet. The opal photonic crystal film is composed of polystyrene particles of 200 nm in diameter and polydimethylsiloxane (PDMS) and has a thickness of approximately 10 μm. The opal photonic crystal film is coated on a black polyvinylchloride (PVC) sheet. Figure 1 illustrates the structure of the opal film and the principle of strain measurement using this film. The structural color and its change are caused by the arrayed colloidal particles. When the opal film is elongated or contracted, the distance among the particles changes, thereby causing the peak wavelength of the reflected light to change. Strains may thus be measured by observing the change in the peak wavelength of the reflected light.

Structure of opal film and the principle of how structural elongation induces a change of interspacing of particles planes.
A formula is needed to measure the strain using the opal film. Two equations, the stress–strain relationship in plane stress and the Bragg–Snell law, were used to describe the relationship between the peak wavelength and the strain. Figure 2 shows the opal film adhered to the target material with the opal film in the plane stress state. The stress–strain relationship in plane stress can be expressed as
| (1) |
| (2) |
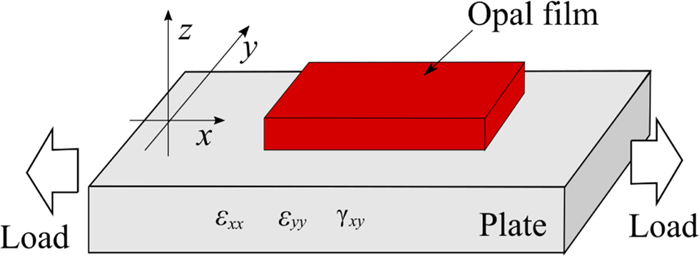
Opal film adhered to target material and their mechanical deformation. (Online version in color.)
From another point of view, the relationship between εzz and the lattice distance d can be expressed as
| (3) |
| (4) |
| (5) |
A tensile test was conducted to validate the derived relationship between the peak wavelength and the first invariant of the strain. Figure 3 shows a schematic diagram of the experiment. Test specimens are made of SS400 without heat treatment, and the parallel length, its width and thickness are 60 mm, 12.5 mm and 4 mm, respectively. The tensile test was conducted using a universal testing machine (Shimadzu Co., Ltd., AG-5000D, Kyoto, Japan). The reflection spectrum of the colloidal crystals was measured using a miniature fiber optic spectrometer (Ocean Optics, USB2000, Dunedin, Florida, USA). The incident light was aligned perpendicular to the specimen. The strain components on the surface of the test specimen were measured using a triaxial strain gauge and a strain gauge system (Kyowa Electronic Instruments Co., Ltd., NTB-500A, Tokyo, Japan). An extensometer (Shimadzu Co., Ltd., SG-25-10, Kyoto, Japan) was used to measure the elongation. Figure 4 shows a photograph of test specimens composed of SS400. An opal film with a rectangular geometry and a triaxial gauge were adhered to the front and back surfaces of the test specimen, respectively. An epoxy resin (Henkel, EA E-60HP, Germany) was used to adhere the opal film to the specimens. Since it is difficult to synchronize the spectrometer with the testing machine, the jog dial of the testing machine was used to move the crosshead. The spectroscopic measurement was conducted approximately every 200 μstrain obtained from the extensometer.

Schematic and photograph of the tensile test setup. (Online version in color.)

Photograph of test specimens adhered with opal films. (Online version in color.)
Figure 5(a) shows the experimentally obtained nominal stress–nominal strain curve, Fig. 5(b) shows the nominal stress toward strains measured using a triaxial gauge, and Fig. 5(c) shows the peak wavelength plotted against the first invariant of the strain measured using a triaxial gauge. As shown in Fig. 5(c), a nearly linear relationship between the peak wavelength and the first invariant of the strain was observed experimentally, and the theoretical results are in good agreement with the experimental results. The most crucial value in this relationship is the slope of the linear relationship between the peak wavelength and the first invariant of the strain. Table 1 summarizes the slopes obtained experimentally and using the theoretically derived relationship for three test specimens, and the results here support the validity of the theoretically derived relationship between the peak wavelength and the first invariant of the strain.

Experimental results of the tensile test using the opal film with an initial peak wavelength of 510 nm adhered to the test material using EA E-60HP. (Online version in color.)
| EA E-60HP | No. | Experimental result | Theoretical result | Difference (%) |
|---|---|---|---|---|
| 510 nm | No. 1 | −3.203E-04 | −3.416E-04 | 6.2 |
| No. 2 | −3.148E-04 | −3.391E-04 | 7.2 | |
| No. 3 | −3.384E-04 | −3.406E-04 | 0.7 | |
| Average | −3.245E-04 | − | 4.7 | |
A four-point bending test was conducted to measure the peak wavelength under compressive strain. Figures 6(a) and 6(b) shows a schematic and a photograph of the four-point bending test, respectively. The crosshead displacement was changed in 1 mm increments, and the maximum displacement was 24 mm. The distance between the load points was 40 mm, and that between the two support points was 160 mm. Figure 7 shows photographs of the test specimens used in this experiment. Test specimens were composed of SS400 without heat treatment, and their length, width, and height were 202, 15, and 17 mm, respectively. A rectangular opal film was adhered to the center of each test specimen, and a triaxial gauge was also adhered to each of the specimens to measure the components of the strain in the compressive state on the upper center of the back surface. The instantaneous adhesive (Kyowa Electronic Instruments Co., Ltd., CC-36, Tokyo, Japan) was used to adhere those. Though the epoxy resin adhesive EA E-60 HP was used in the tensile test, the cyanoacrylate adhesive CC-36, which was often used in practice, is used for the bending test. By moving the probe, the peak wavelength was measured at 25 points on the opal film. The locations of these measurement points are shown in Fig. 7(b). The jog dial of the testing machine was used to move the crosshead, and the spectroscopic measurement was performed every 3 mm of crosshead displacement.

Schematic and photograph of the four-point bending test. (Online version in color.)

Photographs of test specimen. (Online version in color.)
Figure 8 shows the experimental results of the four-point bending test. Figure 8(a) shows the load plotted against the strain measured from the upper side of the test specimen. Because of the configuration, compressive strain appeared along the length of the test specimen. Figure 8(b) shows the peak wavelength plotted against the first invariant of the strain. As shown in Fig. 8(b), the peak wavelength increased as the first invariant of the strain decreased. The experimental results were also found to show good agreement with the theoretical results. Table 2 summarizes the slope of the relationship between the peak wavelength and the first invariant of the strain for two test specimens. Although the differences between the slopes obtained in the compressive state were large in comparison with the tensile test results, these results support the validity of the relationship between the peak wavelength and the first invariant of the strain.

Experimental results of the four-point bending test and corresponding theoretical prediction (510 nm, CC-36). (Online version in color.)
| CC-36 | No. | Experimental result | Theoretical result | Difference (%) |
|---|---|---|---|---|
| 510 nm | No. 1 | −2.992E-04 | −3.373E-04 | 11.3 |
| No. 2 | −2.697E-04 | −3.404E-04 | 20.8 | |
| Average | −2.845E-04 | − | 16.1 | |
Figure 9 shows contour maps of the peak wavelength at crosshead displacements of 0, 12, and 24 mm. From Fig. 9(a), the average and standard deviation of the peak wavelength were obtained as 512 and 2.6 nm, respectively. Figures 9(b) and 9(c) demonstrate that the distribution of the peak wavelength changed as the crosshead displacement was increased. Because the upper side of the test specimen was in the compressive state, the peak wavelength on the upper side increased with increasing displacement. In contrast, the peak wavelength decreased on the lower side because the lower side was in the tensile state. The change in the peak wavelength at the middle was relatively small in comparison with those on the upper and lower sides because the middle of the specimen is near the neutral axis. Figure 10 shows photographs of the opal film after the experiment. As shown in Fig. 10, a color gradient from the upper side to the lower side can be observed with the naked eye because the strain is extremely large. According to Fig. 8, the first invariant of the strain on the compression side is approximately −40000 μstrain. Based on Figs. 5 and 9, the first invariant of strain on the tension side is approximately 60000 μstrain. Although the opal film is in the elastic region, the color change of the opal film can be confirmed with the naked eye because the strain distribution of the test specimen is large enough.

Contour maps of the peak wavelength for the four-point bending test (510 nm, CC-36). (Online version in color.)

Photographs of the opal film after the four-point bending test (510 nm, CC-36). (Online version in color.)
Through a four-point bending test, the feasibility of visualizing the strain distribution using opal film was confirmed. Comparing the DIC, the ESPI and the sampling moiré method, the installation of the opal film is easy. Since the opal film only needs to be attached, it can be expected to be used for long-term measurement of structures. For that purpose, it is necessary to investigate the weather resistance of the opal film in the future. If the strain exceeds 10000 μstrain, it seems possible to quantitatively evaluate the strain with opal film. On the other hand, it is necessary to improve the opal film in order to increase the sensitivity in the region of 10000 μstrain or less. Furthermore, in the field, it can be expected that measurement will be facilitated by using a hyperspectral camera. Further, by processing the data obtained by the hyperspectral camera, improvement in resolution of strain can be expected.
This paper presented a feasibility study of visualizing the strain distribution using opal film. Opal film with an initial peak wavelength of 510 nm was employed in tensile and four-point bending tests conducted to evaluate the feasibility of the visualization of the strain distribution using this type of film. The experimental results of the tensile test confirmed that the peak wavelength and the first invariant of the strain have a linear relationship, as theoretically predicted, and the slope of the experimentally obtained relationship showed good agreement with the theoretical slope. The results of the four-point bending test demonstrated that the peak wavelength increases with increasing compressive strain. Additionally, the slope of the abovementioned relationship obtained in the four-point bending test showed fair agreement with the theoretical slope. The visualization of the first invariant of the strain using opal film was demonstrated to be feasible in these tests. In the visualization, an optical fiber probe was successfully used to observe the color gradient resulting from the strain distribution; however, the use of a hyperspectral camera would be preferable for industrial applications. The influence of surface of material in strain measurement using the opal film is also considered as future work.
This work was supported by Japan Society for the Promotion of Science, JSPS KAKENHI grant number 26289139.