Abstract
The precipitation of nano-sized alloy carbides in steels with a large amount of strengthening can be obtained by conventional tempering of martensite or interphase precipitation occurring during isothermal ferrite transformation. In this study, a vanadium-microalloyed low carbon steel with a composition of Fe-0.1C-0.4V-1.5Mn-0.05Si (mass%) was either isothermally transformed or quenched and tempered at 923 K for various periods, to comparatively investigate the precipitation behaviors of vanadium carbide and the resultant strengthening effects in ferrite and tempered martensite. When compared under the same conditions, tempered martensite is characterized by a higher yield strength and a smaller uniform elongation than that of ferrite. The quantification of microstructural features via multiple characterization techniques demonstrates a finer crystallographic grain size, a higher dislocation density of tempered martensite compared with that of ferrite, together with a relatively coarser dispersion of nano-sized precipitates due to its lower nucleation rate and higher growth rate than interphase precipitation. The strengthening amounts of all these factors are estimated using the theoretical models, the summation of which can well reproduce the yield strength of both ferrite and tempered martensite in the microalloyed low carbon steel.
1. Introduction
Carbide precipitation is known to be the most effective way to strengthen commercial ferritic steels, by which a wide range of mechanical properties of steels can be obtained by controlling the dispersion of precipitates through appropriate design of alloy composition and process condition.1) Due to the hard and generally non-penetrable nature of alloy carbide in iron matrix,2) its strengthening mechanism is generally reported to be in an Orowan-type manner, i.e., the resistive force of precipitate particles against the dislocation movement causes the dislocations to bypass the particles with the formation of Orowan loops.3) In that case, the magnitude of precipitation strengthening is predicted to be larger with the refinement in size under a certain volume fraction of the precipitates,4) and the strategy to utilize the nano-sized alloy carbides formed by microalloying of strong carbide-forming elements has already been widely applied in steel industry.5,6)
The precipitation of nano-sized alloy carbides in microalloyed steels can be obtained in two different ways. One is the precipitation by aging in the conventional quenching and tempering process, which corresponds to the secondary hardening of bainitic and martensitic structures.7,8,9) The other one is the newly developed interphase precipitation, which occurs as a result of nucleation at the migrating interphase boundary during ferrite transformation.10,11) Recently, the contributions to strength of these two types of precipitation were comparatively studied in a vanadium (V)-microalloyed low carbon steel (Fe-0.1C-0.8Mn-0.2Si-0.3V (mass%)) by some of the present authors.12) Typical interphase precipitation of nano-sized vanadium carbide (VC) dispersed in sheets in ferritic matrix and precipitation by aging dispersed randomly in bainitic matrix were obtained by isothermal ferrite and bainite transformation at 963 K and 873 K, respectively. The coarsening of VC with isothermal holding leads to the continuous softening of ferrite. In contrast, bainite which is originally free of precipitates becomes hardened with the occurrence of VC precipitation. Due to relatively lower transformation temperature, the size of VC in bainite tends to be smaller than that in ferrite, although the direct comparison of precipitation at interphase boundary during transformation and in supersaturated matrix by aging at the same temperature still has not been made yet. After experimental quantification of grain size, dislocation density and dispersion of precipitates, it was found that the yield strength of the transformed specimens with either ferritic or bainitic structure can be well explained by considering the strength contributions of various microstructural features. Among them, the magnitude of precipitation strengthening is always overestimated by the prediction using conventional Orowan model, whereas the Ashby-Orowan model with the consideration of interaction between dislocations bypassing the particles gives more accurate prediction.4,9,13,14) In addition, Pythagorean summation rather than simple linear summation of precipitation strengthening and dislocation strengthening shows better agreement with the experimental results.12)
Based on the above findings, isothermal ferrite transformation and tempering process of martensite under the same conditions in a V-microalloyed low carbon steel were performed in this study, to make the direct comparison of interphase precipitation and age precipitation behaviors via quantification of carbide dispersion using three-dimensional atom probe (3DAP). Through the combination of multiple microstructural characterization techniques, the strength contributions of various microstructural features to the strength of ferrite and tempered martensite were quantitatively estimated and their strengthening mechanisms were discussed in detail.
2. Experimental
A V-microalloyed low carbon steel with the chemical composition of Fe-0.08C-0.43V-1.49Mn-0.05Si (mass%) was used in this study. To eliminate the Mn microsegregation, the block cut from the hot-rolled steel plate was homogenized in an Ar atmosphere at 1423 K for 345.6 ks. Small pieces of specimens with dimensions of 10 × 5 × 3 mm3 were cut from the homogenized block, and then austenitized in a vacuum furnace at 1473 K for 0.6 ks to dissolve all the added V. Afterwards, some of the specimens were directly soaked into a salt bath to perform isothermal ferrite transformation treatments at 923 K for various periods up to 172.8 ks, while the others were firstly quenched into iced water and then tempered at the 923 K in the salt bath for various periods for comparison. All these treatments were followed by water quenching to freeze the microstructure.
The specimens after heat treatments were mechanically polished by emery papers, finished by buff polishing with colloidal silica, and etched with a 3% nital solution for optical microscopy observation. Some of the specimens were electro-polished in an ethanol solution containing 6% perchloric acid at a voltage of 25 V for further microstructural observation and analysis. Electron backscatter diffraction (EBSD) measurements with an accelerating voltage of 25 kV, a current of 10 nA and a step size of 0.5 μm were performed in a scanning electron microscope (SEM: JSM-7001F) to measure the crystallographic grain size, which was defined as the average intercept length of the boundaries with misorientation larger than 2° following our previous works.9,12,13) The dispersion of nano-sized VC precipitates was analyzed using three-dimensional atom probe (3DAP: CAMECA LEAP-4000HR), for which the specimens were prepared by focused ion beam (FIB: FEI QUANTA 3D) and measured in a voltage pulse mode with a pulse fraction of 20%, a pulse rate of 200 kHz, a specimen temperature of 50 K. VC precipitates were detected from the 3DAP datasets using cluster analysis based on the maximum separation method,15) whose details can be found in our previous report.16) To ensure statistical reliability, more than 3 specimens for each condition of heat treatment with a volume more than 106 nm3 (10−21 m3) were measured. Furthermore, the dislocation density in each specimen was measured using X-ray diffractometer (XRD: Bruker D8 ADVANCE) with a Cu target (Kα1 wavelength = 0.15406 nm). The line profiles with the diffraction angle (2θ) ranging from 35° to 125° were measured with a step size of 0.01°, a tube voltage of 40 kV and a current of 35 mA. The dislocation density was quantified via analyzing 5 bcc diffraction peaks, i.e., 011, 002, 112, 022 and 113, based on the modified Warren-Averbach method.17)
Larger specimens treated under the same conditions as mentioned above were prepared separately to evaluate the resultant mechanical properties via hardness measurements and tensile tests at room temperature. The hardness of each specimen was measured by using micro-Vickers hardness testing machine (Matsuzawa AMT-X7AFS). The average hardness of 10 out of 12 measurements under the load of 9.8 N (1 kgf), with the maximum and minimum values excluded, was used. Tensile specimens with a gauge length of 4 mm, a gauge width of 1 mm and a thickness of 0.8 mm were prepared and tested using the universal testing machine (Shimadzu AG-X Plus 100 kN) at an initial strain rate of 8.3 × 10⁻⁴ s−1, for which the tensile elongations were recorded by Shimadzu video extensometer DVE-201.
3. Results
Figure 1 shows the typical microstructure of the specimens after isothermal transformation or quenching and tempering treatment. Isothermal transformation starts from the formation of ferrite at the grain boundaries of austenite (Fig. 1(a)), and becomes completed after 0.3 ks (Fig. 1(b)). In contrast, full lath martensite structure is obtained in the as-quenched condition (Fig. 1(c)). Although a small amount of cementite precipitated in tempered martensite was observed in our previous study,9) no obvious change can be observed in the optical micrograph even after prolonged tempering for 43.2 ks (Fig. 1(d)).

Figure 2 shows the variation in hardness of ferrite and martensite with isothermal holding time. Compared with the hardness of ferrite without any VC precipitates formed in the V-free steel as indicated by the dotted line,18) the occurrence of VC interphase precipitation induced by the microalloying of V significantly increases the hardness of ferrite.19) Different from the monotonous softening of ferrite, a peak in hardness corresponding to the secondary hardening of tempered martensite can be clearly observed at the holding time of 0.3 ks. In the range where these two kinds of microstructure isothermally treated for the same periods can be compared, the hardness of tempered martensite is always higher than that of ferrite.

Figures 3(a) and 3(b) show tensile stress-strain curves of ferrite and tempered martensite, respectively, where all the specimens investigated in this study represent the continuous yielding behaviors. After analyzing these tensile curves, the strength and elongation of various specimens are obtained and summarized in Figs. 4(a) and 4(b). Consistently with the hardness variation, the strength of ferrite simply becomes lower by increasing the isothermal holding time. In contrast, the strength of martensite is decreased by tempering at first, and then increased again followed by softening with prolonged holding (Fig. 4(a)). The yield strength of tempered martensite tends to be higher than that of ferrite, whereas their tensile strength is quite similar. On the other hand, the uniform elongation of ferrite indicated by arrows in Fig. 3 remains almost constant at ~9%, whereas its total elongation shows a weak increasing tendency with prolonged isothermal holding. This is the typical behavior of the ferritic steels strengthened by nano-sized alloy carbide as reported in our previous works,4,12) and is confirmed to be shared by tempered martensite as well in this study (Fig. 4(b)). The uniform elongation of tempered martensite is relatively smaller compared with that of ferrite, whereas the total elongation of tempered martensite tends to be larger especially after isothermal holding for short periods.


To compare the strength contributions of various factors in ferrite and tempered martensite, the microstructural features are quantified using multiple characterization techniques. Figure 5 shows the typical grain boundary maps of ferrite and tempered martensite measured by EBSD. Different from the normal ferrite formed in the V-free steels, the microstructure of ferrite in the present V-microalloyed steel is characterized by a large number of low-angle grain boundaries in addition to the high-angle ones.20) After the completion of ferrite transformation for 0.3 ks (Fig. 5(a)), the grain boundary distribution and grain size of ferrite as expressed by the average intercept length (d) is only slightly changed by increasing the holding time up to 172.8 ks (Fig. 5(b)). Similarly, the intercept length of tempered martensite, is also hardly influenced by the prolonged tempering (Figs. 5(c) and 5(d)). The much smaller grain size of tempered martensite (~2.5 μm) than that of ferrite (~6 μm) is effective to improve the local elongation of the V-microalloyed low carbon steel as has been reported in our previous work,18) which should be the reason for its larger total elongation shown in Fig. 4.

Figure 6 shows the three-dimensional V atom maps of ferrite and tempered martensite obtained via 3DAP analysis. The regions enriched in V as indicated by the V iso-concentration surfaces coincide with enrichment of C, and represent the dispersion of nano-sized VC precipitates.9,21) Interphase precipitation of VC dispersed in planar sheets can be observed in ferrite from the early stage of transformation, whose sheet-like dispersion becomes blurred after isothermal holding for a long time due to the coarsening of VC (Figs. 6(a)–6(d)). In contrast, precipitation of VC gradually occurs in martensite at first, followed by a similar coarsening process with prolonged tempering (Figs. 6(e)–6(i)). It is interesting to note that different from VC precipitates in ferrite, those formed in tempered martensite represented by the iso-concentration surfaces are characterized by an elongated morphology aligning along line features, especially after tempering for long periods.9) This should be caused by the coalesced VC precipitates of the same crystallographic variant formed on dislocations, where the nucleation and subsequent growth is energetically preferable.22) The quantified number density of VC precipitates and its size under the spherical-shape assumption of an equivalent volume as measured are shown in Figs. 7(a) and 7(b), respectively. In addition, the volume fraction of VC precipitates shown in Fig. 7(c) is back-calculated from the measured V content in solution after extracting the precipitated V from the 3DAP datasets. A high number density of VC is formed by interphase precipitation in the early stage of ferrite transformation, and that in martensite increases gradually in the early stage of tempering, both of which are followed by the continuous decrease due to coarsening after prolonged holding (Fig. 7(a)). On the other hand, the size of VC simply becomes larger with the increment in holding time (Fig. 7(b)). Such variation in the dispersion leads to the monotonous increment in the volume fraction of VC, and the difference between those two is that a large amount of VC is already formed by interphase precipitation during ferrite transformation, whereas the volume fraction of VC in tempered martensite increases rapidly in the later stage, approaching the equilibrium state earlier than the case of ferrite (Fig. 7(c)). When compared under the same conditions investigated in this study, VC dispersed in ferrite tends to be higher in number density and smaller in size than that in tempered martensite.
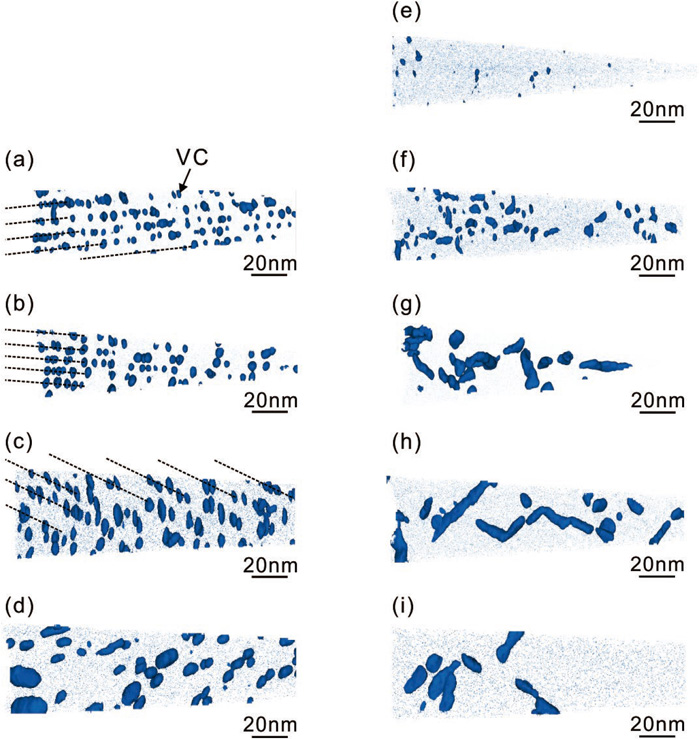

Figure 8 shows the variation in dislocation density of ferrite and tempered martensite with isothermal holding. The magnitude of dislocation density of ferrite quantified via XRD analysis in this study is much higher than that by transmission electron microscopy (TEM) observation in our previous study.12) The application of different quantification approaches should be the main reason for such discrepancy, as it is known that XRD analysis always gives the value of dislocation density higher than that by TEM.23) In addition, different from the normal grain boundary allotriomorphs formed at relatively higher transformation temperatures,12) most of the ferrite formed at 923 K in this study is characterized by a nodular morphology with a large degree of strain accommodation indicated by the substantial small-angle grain boundaries (Figs. 5(a) and 5(b)),20) which might also contribute to the relatively higher dislocation density of ferrite observed in this study. As shown in Fig. 8, the dislocation density of ferrite after the completion of transformation is hardly changed by prolonged holding. A much higher density of dislocations is formed in the as-quenched martensite, which becomes gradually lowered as a result of recovery during tempering treatment but still maintains at a higher level than that in ferrite. Either in ferrite or tempered martensite, the sluggish reduction rate in dislocation density at the later stage of isothermal holding strongly implies the suppression effects on recovery caused by the existence of nano-sized VC precipitates.9,24)

4. Discussion
4.1. Comparison of Precipitation Kinetics at Interphase Boundary and in Tempered Martensite
The dispersions of VC precipitates in ferrite formed by interphase precipitation and that in martensite formed by tempering are comparatively studied to discuss their strengthening mechanisms. The 3DAP results shown in Fig. 7 indicate the totally different precipitation kinetics of VC in those two cases. By considering the extremely short time for nucleation of VC interphase precipitation at the migrating interphase boundary, which was estimated to be ~0.01 s from the ferrite growth rate at 923 K in our previous report,25) the nucleation rate of VC interphase precipitation can be estimated to be as large as ~1026 m−3 s−1 to form a number density of ~1024 m−3 at the early stage of ferrite transformation. In contrast, VC precipitates are formed gradually in tempered martensite, and the average nucleation rate of VC in the first 60 s of tempering can be estimated to be ~1022 m−3 s−1, which is about 4 orders of magnitude lower than that of interphase precipitation.
To explain the difference in nucleation rate of VC at interphase boundary and in tempered martensite, the classical nucleation theory is considered as follows,
|
I∝N
D
V
exp(
-Δ
G
*
kT
)
=N
D
V
exp(
-f
σ
3
Δ
G
2
kT
)
| (1) |
where
I is nucleation rate (m
−3 s
−1),
N is density of nucleation site (m
−3),
DV is diffusivity of V (m
2 s
−1), Δ
G* is activation energy for nucleation (J),
k is Boltzmann constant (J K
−1),
T is temperature (K),
f is an coefficient depending on the shape and size of nucleus,
σ is interfacial energy for nucleation which is mainly determined by that between ferrite and VC (J m
−2), Δ
G is effective driving force for nucleation (J m
−3).
Figure 9(a) shows the isothermal phase diagram of the alloy used in this study, which contains the solubility lines of VC and cementite in ferrite, as well as the phase boundary between ferrite single-phase and ferrite + austenite two-phase regions. According to our previous work,21) the ferrite/austenite phase equilibria show good agreement with the prediction by negligible partition local equilibrium in this condition, and hence the driving force for VC interphase precipitation can be approximately regarded as the supersaturation of C in ferrite, represented by the arrow line in this figure as the gap between the ferrite/ferrite + austenite phase boundary and the solubility line of VC in ferrite.19) On the other hand, although martensite in as-quenched condition might contain a much higher C content as large as 0.08 mass%, precipitation of cementite should occur prior to the precipitation of VC during tempering, which reduces the solute C content in martensite matrix.26) This is confirmed by the 3DAP analysis of the alloy tempered at 923 K for 15 s as shown in Figs. 9(b) and 9(c), where the local enrichment of C with a concentration of about 25 at% corresponding to that in cementite can be clearly seen in the C atom map. In addition, different from the trivial partitioning of V, strong partitioning of Mn from matrix to cementite has already occurred after tempering for such a short time, although the average Mn content in cementite of 4.9 at% is still much lower than the equilibrium value of 14.0 at% as calculated by using Thermo-Calc with TCFE9 database. Due to the low accuracy in quantifying C content in martensite matrix directly by 3DAP analysis, the C content is estimated from the calculation using the composition of the substitutional alloy elements in cementite instead. As shown in Fig. 9(a), the C content in martensite after tempering for 15 s corresponding to the transition state towards the full equilibrium is located in between the values of paraequilibrium and orthoequilibrium, which is slightly lower than that of ferrite in equilibrium with austenite. This implies that due to the precipitation of cementite and concomitant element partitioning, the driving force for nucleation of VC in tempered martensite might be always relatively lower than that of interphase precipitation. Besides that, interphase precipitation also differs from precipitation in tempered martensite in diffusivity of V, which is mainly determined by interfacial diffusion at interphase boundary and pipe diffusion along dislocation, respectively. By using the empirical equations of boundary diffusion27) and pipe diffusion28) reported in literature, the interfacial diffusivity of substitutional elements is estimated to be 1.8 × 10⁻¹³ m2 s−1, which is higher than pipe diffusivity of 1.3 × 10⁻¹⁴ m2 s−1, when the interphase boundary thickness and dislocation core radius are assumed to be 0.5 nm. Moreover, if the V atoms are considered to be the nucleation site for VC precipitation, the higher V content at migrating ferrite/austenite interphase boundary caused by dynamic segregation of V might increase the nucleation site density.21) All the factors mentioned above enlarge the nucleation rate in Eq. (1), and thus accelerate the nucleation kinetics of VC interphase precipitation compared with that in tempered martensite. On the other hand, with the progression of ferrite transformation and advancement of ferrite/austenite interphase boundary, VC precipitates formed by interphase precipitation become embedded in ferrite matrix, whose growth rate should be mainly determined by the volume diffusion of V in ferrite. In contrast, VC precipitates nucleated along dislocations in tempered martensite can still grow with the assistance of pipe diffusion of V, which gives a much higher growth rate after nucleation and rapid precipitation kinetics as can be seen from Fig. 7. The combined effects of the sluggish nucleation and the accelerated growth of VC in tempered martensite lead to the relatively coarser dispersion than that in ferrite, which qualitatively explains the experimental results observed in this study.

Ferrite and tempered martensite in the V-microalloyed low carbon steel are found to differ from each other in crystallographic grain size (Fig. 5), dispersion of VC precipitates (Figs. 6 and 7) and dislocation density (Fig. 8). Based on the experimental results quantified in this study, the strengthening mechanisms of these two kinds of microstructure will be discussed in detail in this section.
The yield strength of the steel can be expressed as the summation of the contributions from various factors as shown in the following equation, for which precipitation strengthening and dislocation strengthening are summed in a Pythagorean manner,12)
|
σ
y
=
σ
0
+
σ
ss
+
σ
gb
+
σ
ppt
2
+
σ
dis
2
| (2) |
where
σy is yield stress (MPa),
σ0 is friction stress of single crystal pure iron (= 53.9 MPa),
29) σss,
σgb,
σppt and
σdis represent the amounts of strengthening (MPa) by solute elements in solution, grain boundaries, precipitates and dislocations, respectively.
Among them, the strength contribution from solute elements is expressed as,29)
|
σ
ss
=3 000×mass%C+83.2×mass%Si
+32.3×mass%Mn
| (3) |
Except for the case of martensite in as-quenched condition, the strengthening caused by solute C in most conditions investigated in this study is limited due to the extremely low solubility of C in ferrite or tempered martensite (< 0.01 mass%). In addition, the negligibly small strengthening ability by V in solution
30) is also ignored for simplicity, and hence Δ
σss, which is mainly determined by Mn contained in the steel with a chemical composition of Fe-0.08C-0.43V-1.49Mn-0.05Si (mass%) used in this study, is calculated to be 52.6 MPa.
The grain boundary strengthening basically follows the Hall-Petch equation, given by,
where
d is the grain size evaluated by the average intercept length, and a Hall-Petch coefficient for an ultralow carbon interstitial free steel (210 MPa
μm
1/2)
31) is used.
Following our previous reports,4,12,13,14) Ashby-Orowan model is used to estimate the strengthening amount of nano-sized VC precipitates as,
|
σ
ppt
=0.84M(
1.2Gb
2π
L
VC
)
ln(
2
3
r
VC
b
)
| (5) |
|
L
VC
=
1
2
r
VC
ρ
VC
-2
r
VC
2
3
| (6) |
where
LVC is inter-particle spacing on slip plane,
ρVC and
rVC are number density and average radius of VC precipitates, respectively,
M is Taylor factor (= 2.75),
32) G is shear modulus (= 81.6 GPa), and
b is magnitude of Burgers vector (= 0.248 nm). Compared with nano-sized VC precipitates, the strengthening induced by cementite with a size as large as ~100 nm in tempered martensite
9) is negligibly small and ignored for simplicity.
As for the dislocation strengthening, Bailey-Hirsch model expressed by the following equation is used for the estimation,
where
α is a constant (= 0.33)
33) and
ρdis is dislocation density (m
−2).
The detailed experimental results and the estimated strength contributions of various factors are summarized in Table 1, the summation of which (σy, cal) is shown in Fig. 10 to be compared with the experimentally measured yield strength obtained from tensile tests (σy, exp). Basically, the calculated yield strength of both ferrite and tempered martensite treated under different conditions show good agreement with the experimental results, which again demonstrates the validity of the strength prediction by Eq. (2).12) Compared with the case of ferrite, tempered martensite is characterized by larger amounts of strengthening contributed by finer grain size and dislocation density, whereas its precipitation strengthening tends to be smaller due to relatively coarser dispersion of VC precipitates (Table 1 and Fig. 10). Some interesting points worth mentioning is that the yield strength of as-quenched martensite is significantly overestimated if all the C is assumed to be in solid solution. This suggests that the present V-microalloyed low carbon steel might experience extensive auto-tempering due to its high Ms temperature, so that most of the solute C becomes precipitated as iron carbide during quenching.34) On the other hand, the elongated morphology of VC precipitates detected in tempered martensite might enlarge the possibility of encountering the dislocations on the slip plane at a certain volume fraction.35) This might bring a relatively larger amount of precipitation strengthening than the current estimation under the spherical-shape assumption. The bold horizontal bars shown in Fig. 10(b) show the σy, cal by roughly assuming the aspect ratio of VC precipitates formed in tempered martensite to be 5, where a 30% increment in the magnitude of precipitation strengthening is expected according to the theoretical calculation in literature.36) Since dislocation strengthening plays a major role in determining the strength of tempered martensite, the consideration of aspect ratio of VC precipitates only slightly increases the calculated yield strength and the experimental results still can be well reproduced. Hence, the above-mentioned discussion on the strengthening mechanisms in microalloyed low carbon steels is not largely influenced by the morphology of nano-sized alloy carbide.
Table 1. Quantified microstructural features and corresponding contributions to yield strength of Fe-0.1C-0.4V-1.5Mn-0.05Si alloy isothermally transformed and tempered at 923 K.
| Heat treatment condition | d/μm | ρVC/m−3 | rVC/nm | LVC/nm | ρdis/m−2 | σ0/MPa | σss/MPa | σgb/MPa | σppt/MPa | σdis/MPa | σy, cal/MPa | σy, exp/MPa |
|---|
| Ferrite | 0.3 ks | 5.3 | 8.4×10²³ | 1.1 | 21.5 | 2.9×10¹⁴ | 54 | 53 | 91 | 500 | 313 | 787 | 755 |
| 1.8 ks | 7.3 | 6.0×10²³ | 1.2 | 24.5 | 3.0×10¹⁴ | 54 | 53 | 77 | 473 | 320 | 755 | 761 |
| 10.8 ks | 5.8 | 2.2×10²³ | 1.7 | 33.5 | 2.5×10¹⁴* | 54 | 53 | 87 | 444 | 290 | 720 | 692 |
| 43.2 ks | 7.2 | 4.3×10²² | 3.1 | 56.5 | 2.5×10¹⁴* | 54 | 53 | 78 | 345 | 290 | 635 | 610 |
| 172.8 ks | 6.2 | 1.8×10²² | 3.7 | 82.1 | 2.5×10¹⁴ | 54 | 53 | 84 | 255 | 287 | 575 | 530 |
| As-quenched martensite | 2.6 | – | – | – | 1.2×10¹⁵ | 54 | 53(+225) ** | 130 | 0 | 641 | 878(+225) | 863 |
| Tempered martensite | 15 s | 2.4 | 1.8×10²³ | 0.7 | 59.4 | 7.6×10¹⁴ | 54 | 53 | 136 | 126 | 508 | 765 | 827 |
| 60 s | 2.5 | 5.0×10²³ | 0.9 | 31.0 | 6.0×10¹⁴ | 54 | 53 | 133 | 307 | 449 | 783 | 781 |
| 0.3 ks | 2.8 | 2.0×10²³ | 1.7 | 35.8 | 6.1×10¹⁴ | 54 | 53 | 125 | 404 | 452 | 838 | 868 |
| 1.8 ks | 2.7 | 1.3×10²³ | 1.9 | 42.0 | 5.3×10¹⁴ | 54 | 53 | 128 | 366 | 422 | 792 | 870 |
| 10.8 ks | 2.5 | 6.9×10²² | 2.1 | 55.9 | 5.2×10¹⁴ | 54 | 53 | 133 | 289 | 418 | 748 | 719 |
* The measurements of dislocation density by XRD have not been carried out for the specimens with asterisk, and the data are estimated via interpolation.
** The amount of solid solution strengthening in parenthesis corresponds to that of C if all the added C is in the solute state.

5. Conclusions
The precipitation behaviors of nano-sized alloy carbide and strengthening mechanisms of ferrite and tempered martensite in a V-microalloyed low carbon steel were comparatively investigated in this study. Based on the experimental results, the conclusions can be drawn as follows.
(1) Interphase precipitation of VC occurs at migrating ferrite/austenite interphase boundary during isothermal ferrite transformation, while VC precipitation with relatively sluggish nucleation but rapid growth kinetics gradually occurs by aging in tempered martensite.
(2) Compared under the same conditions, tempered martensite is characterized by a smaller uniform elongation but a higher yield strength than that of ferrite, which can be attributed to its finer grain size and higher dislocation density, regardless of the relatively coarser dispersion of VC precipitates.
(3) Yield strength of both ferrite and tempered martensite can be well reproduced by the summation of the strength contributions from various microstructural features, including solute elements in solution, grain boundaries, nano-sized VC precipitates and dislocations.
Acknowledgement
This work was financially supported by CREST Basic Research Program entitled “Creation of Innovative Functions of Intelligent Materials on the Basis of Element Strategy” funded by Japan Science and Technology Agency (JST) (2011–2015), Grant-in-Aid for JSPS Fellows No. 14J02944 (2014–2016) and Grant-in-Aid for Scientific Research (A) No. 17H01330 (2017–2019) funded by Japan Society for the Promotion of Science (JSPS). The authors also acknowledge the Iron and Steel Institute of Japan for Research Promotion Grant (2019–2020). Assoc. Prof. Naoya Kamikawa in Hirosaki University, and Mr. Kunio Shinbo in Institute for Materials Research, Tohoku University, are gratefully appreciated for their technical support in tensile tests and 3DAP measurements, respectively.
References
- 1) T. Senuma: ISIJ Int., 42 (2002), 1. https://doi.org/10.2355/isijinternational.42.1
- 2) Y. Kobayashi, J. Takahashi and K. Kawakami: Scr. Mater., 67 (2012), 854. https://doi.org/10.1016/j.scriptamat.2012.08.005
- 3) T. Gladman: Mater. Sci. Technol., 15 (1999), 30. https://doi.org/10.1179/026708399773002782
- 4) N. Kamikawa, Y. Abe, G. Miyamoto, Y. Funakawa and T. Furuhara: ISIJ Int., 54 (2014), 212. https://doi.org/10.2355/isijinternational.54.212
- 5) Y. Funakawa, T. Shiozaki, K. Tomita, T. Yamamoto and E. Maeda: ISIJ Int., 44 (2004), 1945. https://doi.org/10.2355/isijinternational.44.1945
- 6) Y. Funakawa: Mater. Trans., 60 (2019), 2086. https://doi.org/10.2320/matertrans.M2018197
- 7) E. C. Bain: Functions of the Alloying Elements in Steel, ASM, Cleveland, OH, (1939), 228.
- 8) M. Tanino and T. Nishida: Trans. Jpn. Inst. Met., 9 (1968), 103. https://doi.org/10.2320/matertrans1960.9.103
- 9) Y.-J. Zhang, C. Zhao, M. Sato, G. Miyamoto and T. Furuhara: ISIJ Int., 61 (2021), 1641. https://doi.org/10.2355/isijinternational.ISIJINT-2020-412
- 10) R. W. K. Honeycombe: Metall. Trans. A, 7 (1976), 915. https://doi.org/10.1007/BF02644057
- 11) Y.-J. Zhang, E. Chandiran, H.-K. Dong, N. Kamikawa, G. Miyamoto and T. Furuhara: JOM, 73 (2021), 3214. https://doi.org/10.1007/s11837-021-04882-w
- 12) N. Kamikawa, K. Sato, G. Miyamoto, M. Murayama, N. Sekido, K. Tsuzaki and T. Furuhara: Acta Mater., 83 (2015), 383. https://doi.org/10.1016/j.actamat.2014.10.010
- 13) S.-W. Young, M. Sato, K. Yamamitsu, Y. Shimada, Y.-J. Zhang, G. Miyamoto and T. Furuhara: Acta Mater., 206 (2021), 116612. https://doi.org/10.1016/j.actamat.2020.116612
- 14) G. Miyamoto, R. Hori, B. Poorganji and T. Furuhara: ISIJ Int., 51 (2011), 1733. https://doi.org/10.2355/isijinternational.51.1733
- 15) D. Vaumousse, A. Cerezo and P. J. Warren: Ultramicroscopy, 95 (2003), 215. https://doi.org/10.1016/S0304-3991(02)00319-4
- 16) Y.-J. Zhang, G. Miyamoto and T. Furuhara: Microsc. Microanal., 25 (2019), 447. https://doi.org/10.1017/S1431927618015374
- 17) T. Ungár and A. Borbély: Appl. Phys. Lett., 69 (1996), 3173. https://doi.org/10.1063/1.117951
- 18) E. Chandiran, Y. Sato, N. Kamikawa, G. Miyamoto and T. Furuhara: Metall. Mater. Trans. A, 50 (2019), 4111. https://doi.org/10.1007/s11661-019-05353-3
- 19) Y.-J. Zhang, G. Miyamoto, K. Shinbo, T. Furuhara, T. Ohmura, T. Suzuki and K. Tsuzaki: Acta Mater., 84 (2015), 375. https://doi.org/10.1016/j.actamat.2014.10.049
- 20) Z.-Q. Wang, Y.-J. Zhang, G. Miyamoto and T. Furuhara: Scr. Mater., 198 (2021), 113823. https://doi.org/10.1016/j.scriptamat.2021.113823
- 21) Y.-J. Zhang, G. Miyamoto, K. Shinbo and T. Furuhara: Acta Mater., 128 (2017), 166. https://doi.org/10.1016/j.actamat.2017.02.020
- 22) C. E. I. C. Ohlund, D. den Ouden, J. Weidow, M. Thuvander and S. E. Offerman: ISIJ Int., 55 (2015), 884. https://doi.org/10.2355/isijinternational.55.884
- 23) S. Takebayashi, T. Kunieda, N. Yoshinaga, K. Ushioda and S. Ogata: ISIJ Int., 50 (2010), 875. https://doi.org/10.2355/isijinternational.50.875
- 24) J. Klemm-Toole, J. Benz, S. W. Thompson and K. O. Findley: Mater. Sci. Eng. A, 763 (2019), 138145. https://doi.org/10.1016/j.msea.2019.138145
- 25) Y.-J. Zhang, G. Miyamoto, K. Shinbo and T. Furuhara: Acta Mater., 186 (2020), 533. https://doi.org/10.1016/j.actamat.2020.01.025
- 26) G. Krauss: Steel Res. Int., 88 (2017), 1700038. https://doi.org/10.1002/srin.201700038
- 27) J. Fridberg, L.-E. Torndahl and M. Hillert: Jernkontorets Ann., 153 (1969), 263.
- 28) H. Mehrer and M. Lübbehusen: Defect Diffus. Forum, 66–69 (1990), 591. https://doi.org/10.4028/www.scientific.net/DDF.66-69.591
- 29) F. B. Pickering: Physical Metallurgy and the Design of Steels, Applied Science Publishers, London, (1978), 63.
- 30) S. Takeuchi: Tetsu-to-Hagané, 55 (1969), 69 (in Japanese). https://doi.org/10.2355/tetsutohagane1955.55.1_69
- 31) S. Araki, K. Fujii, D. Akama, T. Tsuchiyama, S. Takaki, T. Ohmura and J. Takahashi: ISIJ Int., 58 (2018), 1920. https://doi.org/10.2355/isijinternational.ISIJINT-2018-130
- 32) G. Y. Chin and W. L. Mammel: Trans. Metall. Soc. AIME, 239 (1967), 1400.
- 33) Y. Tanaka, S. Takaki, T. Tsuchiyama and R. Uemori: ISIJ Int., 58 (2018), 1927. https://doi.org/10.2355/isijinternational.ISIJINT-2018-371
- 34) B. Hutchinson, J. Hagström, O. Karlsson, D. Lindell, M. Tornberg, F. Lindberg and M. Thuvander: Acta Mater., 59 (2011), 5845. https://doi.org/10.1016/j.actamat.2011.05.061
- 35) P. M. Kelly: Scr. Metall., 6 (1972), 647. https://doi.org/10.1016/0036-9748(72)90120-2
- 36) J.-F. Nie, B. C. Muddle and I. J. Polmear: Mater. Sci. Forum, 217–222 (1996), 1257. https://doi.org/10.4028/www.scientific.net/MSF.217-222.1257