Abstract
Two mechanisms inconsistent each other, a relaxation of type II internal stress and a presence of mobile dislocation, were previously proposed to describe the low elastic limit of as-quenched lath martensite steels. In this study, neutron diffraction experiments were performed to revisit the deformation behavior of lath martensite steel. Dislocations with very dense in the order of 1015 m−2 were observed in the as-quenched martensite single phase condition of a Fe–18Ni alloy. The diffraction profiles had good symmetry, showing that the inhomogeneous type II internal stresses which might be introduced in individual blocks or packets during martensitic transformation were well balanced in a bulky specimen size, and the influence to the yield stress would be very small. In a 0.22C steel, dislocations with very dense in the order of 1015 m−2 and random arrangement were also observed in the as-tempered condition. The diffraction profiles had also good symmetry. The symmetry collapsed by tensile deformation, displaying the occurrence of load sharing between the packets with the active slip systems of in- and out-of-lath-plane. The highly dense random arrangement dislocations easily moved at the beginning of deformation, then accumulated, annihilated and changed the arrangement differently depending on the orientation of the packet with respect to the deformation direction. The movement of highly dense random arrangement dislocations played an important role as a mechanism at the beginning of deformation, and can be a true feature of mobile dislocations.
1. Introduction
Lath martensite is well known as the hardest microstructure, and steels consisting of lath martensite (lath martensite steels) are paid attention for the high tensile strength steels. There are several issues in the lath martensite such as tetragonality of the crystal structure,1,2,3) kinematics of martensitic transformation4,5,6,7) and deformation behavior,8,9,10) which related with internal stresses, dislocations, lath orientation and boundary, the movement of carbon or nitrogen and so on. Some of them are still not clearly understood. This paper will focus to discuss mainly about the deformation behavior, by in situ observation using neutron diffraction of a Fe−18Ni alloy during thermal process and a 0.22C steel during tensile deformation.
The as-quenched lath martensite steel shows the stress–strain curve with a round shape; it has a low elastic limit with the high ultimate strength showing like the work-hardening.8) The dislocation densities in lath martensite steels are very high.8,9,11,12,13) The dislocation density measured by X-ray diffraction with the conventional Williamson−Hall method14,15) was however reported to be too high for the 0.2% proof stress,8) considering the Taylor relation.16) These facts suggested the possibilities of other strengthening mechanisms. Nakashima et al.8) introduced a mobile dislocation mechanism; that is, the mobile dislocations introduced by martensitic transformation do not contribute to dislocation strengthening but oppositely make the low yield stress through the generation of plastic strain. They concluded the mechanism after the observation of stress relaxation during crosshead stop at a load value relevant to the elastic limit which was half the proof stress. Their group further reanalyzed the same diffraction data using the modified Williamson−Hall/Warren−Averbach method,17,18) and found that the dislocation density in the as-quenched condition reduced to be about a half value of that analyzed using the conventional Williamson−Hall method.12) However, the dislocation density was still too high compared to the 0.2% proof stress.12)
Hutchinson et al.10) proposed a different mechanism describing that the round shape of stress–strain curve of lath martensite was due to the relaxation of inhomogeneous type II internal stress at the beginning of deformation. The internal stresses are categorized by the scale over which they self-equilibrate, or according to the method by which they are measured.19,20) Type I internal stresses, being also called as the macroscopic stresses, vary continuously over large distances, e.g., vary between the surface and inner parts of engineering parts. Type II internal stresses vary over the grain scale, including the block and packet scales. The type II stresses nearly always exist in polycrystalline materials simply from the fact that the deformabilities and thermal properties of differently oriented neighbouring grains are different. More significant type II stresses occur when the microstructure contains several phases or phase transformations take place. Type III internal stresses vary over the atomic scale, and typically includes stresses due to coherency at interfaces and dislocation stress fields. The internal stresses can be measured by the diffraction technique. The type I stresses are measured by the diffraction peak shifts. The type II stresses are mainly also from the diffraction peak shifts; i.e., the stresses evaluated from the peak shifts are the contribution from the type I and type II stresses. When the type II stresses distributed inhomogeneously in different grains, colonies or packets, they will affect also the symmetries of diffraction peaks. The type III stresses are mainly evaluated from the diffraction peak broadening. Hutchinson et al. performed synchrotron diffraction measurements on a lath martensite steel during tensile test, and found that the diffraction profile of lath martensite, which was asymmetrical before deformation, changed with the deformation. They then performed a simulation using a finite element method to explain that the change in the diffraction profile can occur due to the change in the inhomogeneous distribution of type II internal stress. The change (relaxation) of inhomogeneous type II internal stress may be easy to understand from the engineering point of view, but there are still questions on how the inhomogeneous type II internal stresses are introduced, whether the inhomogeneous type II internal stresses remain in a several hundred mm3 size specimen, and how large the values are.
The above two mechanisms are opposite to each other and confusing. On the other hand, understanding the deformation mechanism is very important for materials design and safety design. There are a lot of studies with TEM,6,11,13,21) SEM6,21,22) and EBSD21,23) on the microstructure, but mostly without internal stress observation. It is well known that the microstructure of lath martensite typically comprises several packets with different crystallographic orientations in a prior austenite grain, where the packets are formed by several blocks. The blocks are subdivided into sub-blocks with the same variant, and the smallest constituents are plate-like crystals called laths with sizes of several tens to several hundreds of nm. Fukui et al.24) observed that the load sharing occurred among different directions with respect to the lath orientation, when an FIB cutting was performed within a packet of a lath martensite. The load sharing implies the presence of inhomogeneous type II internal stresses within a single packet which mainly consists a single variant; however, there is still a question whether the stress condition still remains in a several hundred mm3 size specimen of as-quenched lath martensite consisting all possible variants. Microscale deformation experiments using specimens consisting mainly single packets revealed different yield stress values for different lath orientations; where, the yield stress value for the specimen with the active slip system of in-lath-plane was lower than that with the active slip system of out-of-lath-plane.25,26) These experiments25,26) indicate that there might be a load redistribution between packets in which the active slip systems are in- or out-of-lath-plane, respectively, when a deformation using a several hundred mm3 size specimen is conducted.
As described above, observations of stresses and dislocations together with the phase condition are necessary to be performed in situ using a several hundred mm3 size specimen during thermal processes or deformation. Neutron diffraction is one of powerful probes to do in situ observations during thermal processes27,28,29) or deformation.30,31,32,33,34) Hence, in this study, by performing in situ observations using neutron diffraction of a Fe–18Ni alloy during thermal process and a 0.22C steel during tensile deformation, we tried to revisit the deformation behavior of lath martensite.
2. Experimental Procedure
2.1. Samples
Two kinds of martensite steels were used in this study, where the details are shown in Table 1. The Fe–18Ni alloy (sample N) was used to represent the carbon-free martensite steel, while the 0.22C steel (sample C) was the carbon martensite steel. Sample N was solutionized at 1523 K for 1.8 ks and quenched. Sample C was austenitized at 1173 K for 3.6 ks and quenched, followed by a tempering process at 453–473 K for about 10.8 ks. The Ms of sample C was 683 K.35) The microstructure of as-quenched condition was reported not to change much with the tempering below 493 K.28,36)
Table 1. Sample N and sample C used in this study.
| Name | Chemical composition (in mass%) | Note |
|---|
| Sample N | Fe–17.76Ni–0.037Al–0.0012N–0.0016C | Carbon–free martensite steel |
| Sample C | Fe–0.22C–0.87Si–1.64Mn–0.024Ti–0.0015B–0.0025N | Carbon martensite steel |
A rod specimen with the diameter of 6.6 mm and the height of 11 mm was cut from sample N, and was aligned vertically at the sample position of a thermo-mechanical processing simulator27) mounted on the sample table of TAKUMI,37) the engineering materials diffractometer in J-PARC, in such a way that the center of rod specimen was to be the sample position of TAKUMI. TAKUMI equipped detector banks with scattering angles of +90° and −90°. The slit for the incident beam of 5 mm width and 6 mm heigh, and the radial collimator for the scattering beam viewing 5 mm width were used. Considering the beam divergence, therefore, almost the whole diameter of sample was measured.
The geometrical setup and a brief specification of the thermo−mechanical processing simulator can be found elsewhere.27) A thermal process was conducted to the rod specimen with the details as follows. Austenization at 1173 K for 180 s, rapid cooling with 10 K/s to 673 K and then cooling with 0.1 K/s to room temperature. The neutron diffraction data collection was performed in situ during the thermal process. The diffraction data collected at the +90° and −90° detector banks was summed together, and the diffraction patterns were then extracted per 30 s accumulation time. The Rietveld analysis using Z-Rietveld software38) was performed to evaluate the lattice parameters of austenite and martensite and the fraction of austenite or martensite.
2.3. In situ Tensile Deformation
A rod dog-bone specimen with the parallel part of 5 mm in diameter and 15 mm in length was prepared from sample C, and was aligned horizontally 45° to the incident beam to get diffraction data for the scattering vectors parallel (LD) and perpendicular (TD) to the loading direction at the +90° and −90° detector banks, respectively. The similar setup of slit and radial collimator with the in situ thermal process experiment was also adopted in this experiment; therefore, almost the whole parallel part being similar with that contributing to the applied stress was measured.
Tensile deformation was performed with the strain rate of 10−5 s−1 step by step to arbitrary strains followed by unloading. The strain was monitored by a strain gauge glued on the specimen. The neutron diffraction data collection was conducted in situ during tensile deformation. The diffraction patterns extracted for the unloaded conditions were analyzed using the Convolutional Multiple Whole Profile (CMWP) fit18,39) and the Pawley method40) to characterize dislocation and internal stress evolutions, respectively, during tensile deformation. The detailed procedure of CMWP-fit can be found elsewhere.31)
3. Results
3.1. Martensitic Transformation during Cooling in Thermal Process
Figure 1(a) shows the evolutions of temperature and volume fraction of austenite (A) with the elapsed time of sample N. The sample N became the single-A phase at 1173 K. The single-A condition was kept during the rapid cooling down to 673 K. The volume fraction of A phase started to decrease when the temperature reached 587 K and rapidly decreased with further cooling, i.e., martensitic transformation occurred. Therefore, we determined the temperature of 587 K as the Ms. The diffraction patterns at the representative temperatures (Fig. 1(b)) show the single-A phase condition before transformation (614 K), the A–martensite (M) dual-phase condition during transformation (569 K) and the single-M phase condition after transformation (298 K).

Figure 2 shows the lattice parameters of A and M phases and the volume fraction of M phase with temperature. The lattice parameter of A phase above the Ms is in a linear relation with the temperature, and the slope can be used to estimate the coefficient of thermal expansion of A phase, 2.32 × 10⁻⁵ K−1. The lattice parameter of M phase is in a linear relation with the temperature in the temperature range below 473 K, and the fitted coefficient of thermal expansion of M phase was 1.03 × 10⁻⁵ K−1. Both the coefficients of thermal expansions are in good agreement with those reported in Ref.29,41,42)

The lattice parameter of A phase in Fig. 2(a) started to deviate from the linearity to have a smaller value than the thermal expansion line. The lattice parameter of M phase in Fig. 2(c) was larger than the thermal expansion line at the beginning of martensitic transformation. These changes may display that in the A phase compressive type II internal stresses and in the M phase tensile type II internal stresses are generated during martensitic transformation. However, these lattice parameter deviations were observed in the dual phase conditions, and could not be used to directly evaluate the internal stress in the single-M phase condition at room temperature. When the sample was subsequently annealed at 793 K below the As, the lattice parameter of M phase at room temperature was smaller than that just after cooling (as-cooled). The difference in the lattice parameter between the as-cooled and that after annealing was about 0.03%. When the diffraction patterns of as-cooled and after annealing were analyzed by the CMWP fit, the dislocation densities of 1.5 × 10¹⁵ m−2 and 1.2 × 10¹⁴ m−2, respectively, were estimated. Therefore, there is a possibility that the difference in the lattice parameter is mainly affected by the large decrease of dislocation density.41) With tensile deformation of ferritic steels, it is usually difficult to achieve the dislocation density at the level of 1015 m−2.43,44) The dislocations in as-quenched Fe−18Ni alloys were reported to be randomly arranged.12,45) The diffraction profiles of M phase in the as-cooled condition showed good symmetry, and the symmetry was not changed by the annealing. The symmetry will be discussed later in section 4.
3.2. Tensile Deformation of Lath Martensite
Figure 3(a) shows a true stress–true strain curve of sample C. The curve was a kind of round shape, i.e., the proof stress was not clearly appeared. Considering the true stress value of 1.65 GPa at the applied true strain of 0.05, the elastic limit and the 0.1% proof stress evaluated from the curve, 350 MPa and 680 MPa, respectively, were both very low. The true stress–true strain taken at in situ neutron diffraction during loading using a deformation mode with the gradual tensile strain and unloading was embedded in Fig. 3(a). The specimen was unfortunately broken during reloading to increase the strain after 0.047 tensile straining. The discussion about tensile deformation of lath martensite is therefore limited for the tensile deformation up to 0.047. The diffraction patterns extracted for the unloading conditions were used for the analyses using the CMWP fit. Figure 3(b) shows a typical diffraction pattern plotted against the lattice spacing (d). Sample C contained retained A phase with a volume fraction of about 4% which was estimated by the Rietveld refinement. The fraction of A phase decreased by deformation to be about 2% after 0.047 tensile straining.

Figure 4(a) shows the diffraction profiles of M-200 for LD and TD observed before deformation. The diffraction profiles were plotted for K values, where K is 1/d. The tetragonality of M phase is easy to appear in M-200 diffraction profile. The inhomogeneous type II internal stress easily appears also in M-200 diffraction profile because of the low elastic modulus of <200> orientation. After normalizing the peak top and the background, and little-shifting the peak positions, the diffraction profiles of M-200 for LD and TD showed quite similar peak shapes having good symmetry. This condition indicates that, the tetragonality in sample C was very low and the tensile type II internal stresses and compressive ones which might exist in the individual packets, blocks or laths were in similar proportions and well balanced in a bulky sample size.

The symmetrical shapes collapsed by deformation, as shown typically in Fig. 4(b). The diffraction profile for LD showed the shoulder swelling at low K value, while that for TD showed the shoulder swelling at high K value. The difference in the asymmetry for LD and TD is difficult to be explained due to the tetragonality which should appear in the same tendency regardless of the scattering vector. The swells in the diffraction profiles can be understood due to the occurrences of peak separation by deformation. For LD, a peak having higher peak height and narrower width shifted little by deformation and that having lower peak height and wider width shifted largely to the low K value. The peak separation is described typically for LD in Fig. 5(a). For TD, vice versa, the peak having lower peak height and wider width shifted largely to the high K value. As the low K value displays the large d value, the shift to the low K value for LD displays that the peak having lower peak height and wider width bears a larger tensile stress value than the peak having higher peak height and narrower width. In the tensile loading, the stress in TD is compressive due to the Poisson effect. The shift of the peak having lower peak height and wider width to the high K value for TD was in agreement with the Poisson effect. Therefore, the peak separation in M phase can be understood due to the occurrence of load sharing between a component bearing larger stress (hard component: HC) and a component bearing smaller stress (soft component: SC).

According to the previous works,25,26,46) HC and SC can be interpreted as a packet component with out-of-lath-plane slip system having higher CRSS and a packet component with in-lath-plane slip system having lower CRSS, respectively. The schematic illustration explaining HC and SC is shown in Fig. 5(b). This interpretation is supported also by a crystallographic relationship in low carbon martensites.6,21) For example, the orientation difference of diffracted (110) plane with respect to the lath boundary (another (110)) is either 60° or 90°, and similarly diffracted (200) plane, 45° or 90°. Actually, there may be more slip systems besides HC and SC, but for simplicity they are categorized to be two. The CMWP analyses were then performed on the diffraction patterns for LD by assuming that the HC and SC existed in M phase. The fraction of HC was found to be approximately 50% and was almost unchanged for the deformation range in this study (up to 0.047 tensile strain). The residual lattice strains (type II) were evaluated from the peak positions refined from the CMWP analyses and shown in Fig. 5(c). The residual lattice strains were tensile in HC and compressive in SC, displaying well hard and soft component behavior, respectively. As HC bears larger stress than SC during loading, at the unloaded condition the stress in HC remains as tensile and that in SC compressive. The distribution of lattice strain values among different <hkl> family grains displayed well the elasto-plastic partitioning among <hkl> oriented grains.32,34,47)
Figure 6(a) shows phase lattice strains of HC and SC of M phase and A phase during loading plotted for the applied true strain. The phase lattice strain distribution reflects partitioning of load among HC, SC and A. Figure 6(b) shows contributions to the flow stress of HC, SC and A, which were evaluated by multiplying the phase lattice strains with their Young moduli and weighting their fractions. The Young moduli used in the evaluation was 197 GPa for both HC and SC, and 200 GPa for A. The phase lattice strain of A showed the largest value during plastic tensile deformation, however its contribution to the whole flow stress was less than 6% because of its small phase fraction. The contribution of HC increased while that of SC decreased with the progress of tensile deformation; therefore, HC is considered to play the most important role in the work-hardening of sample C during tensile deformation.
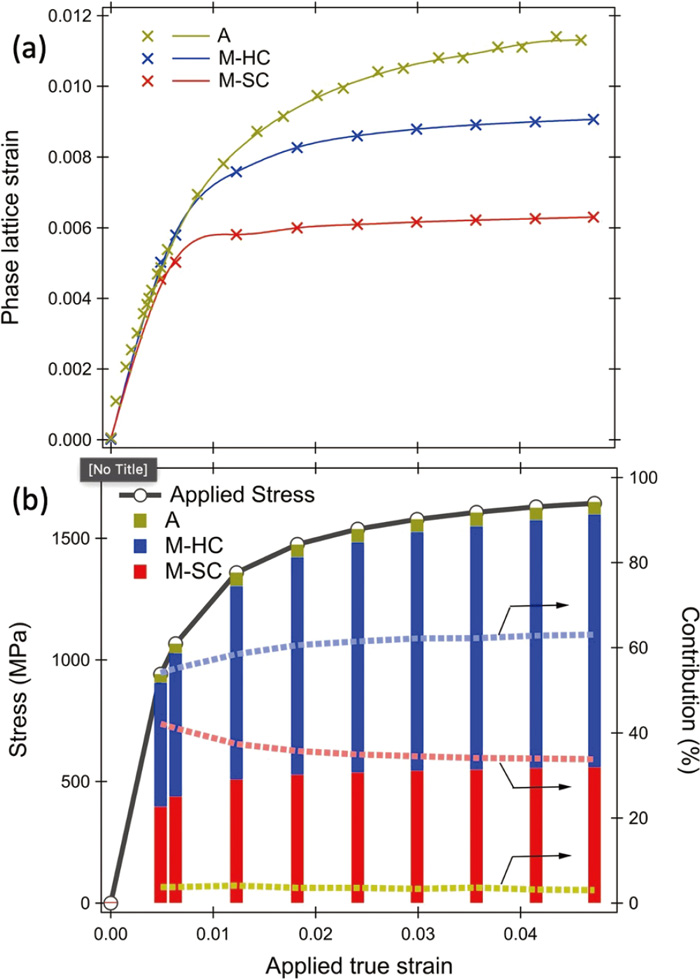
Figure 7(a) shows the dislocation densities in HC and SC plotted for the applied true strain. The dislocation density was distributed between HC and SC; where, it increased in HC while decreased in SC with the progress of tensile deformation. As the tensile deformation progresses, the accumulation of dislocation occurred in HC while the annihilation in SC. The increasing trend of dislocation density in HC and the decreasing trend of dislocation density in SC correspond well with the changes in the contributions of HC and SC to the flow stress, respectively. The distribution of dislocation density surprisingly was largely observed after tensile straining of just about 0.005 (total strain), displaying that the highly dense random arrangement dislocations can move easily at the beginning of deformation. Figure 7(b) shows the arrangement parameter of dislocation (M*) in HC, which was very high before deformation and then decreased much at the beginning of deformation to be close to 1.0. The M* in SC was high regardless of deformation. The parameter M* is a product of the effective cut-off radius of dislocation and the square root of dislocation density.18) A large or small value of M* displays that the screening of the displacement field of dislocations are weak or strong, respectively; i.e., it shows the random arrangement or dipole character, respectively. The decrease of M* value has been explained to relate to the geometrical coefficient α in the Taylor’s equation.31) The dislocations introduced by deformation in steels usually already have the M* value of about 1.0 to 1.5,43) and the M* value decreases to be much lower than 1.0 at the later part of deformation. The dislocations with random arrangement are difficult to be introduced by deformation. The work hardening of HC is therefore due to both the increases in dislocation density and in the fraction of dipole character in HC. Figure 7(c) shows dislocation character (q) which indicates dislocation type, screw or edge. For C sample, the q value of 0.2 stands for edge type and 2.5 for screw type.31) The q value before deformation was 1.7, and therefore indicates that the dislocations were a mixture of screws and edges with a larger proportion of screw-type. This mixture character of dislocations is supported also by a TEM work.48) The q value in SC was almost unchanged with deformation from the state before tensile deformation. Meanwhile, the q value in HC decreased largely at the beginning of tensile deformation, displaying that the proportion of edge dislocations increased in HC.

The results in Figs. 7(a)–7(c), can be summarized as follows: (i) Dislocations introduced during martensitic transformation by cooling were very dense in the order of 1015 m−2, randomly arranged, and consisted of screw type as the major proportion. (ii) The accumulation, annihilation and movement of dislocations behaved differently depending on the orientation of the packet with respect to the deformation direction.
4. Discussion
4.1. Internal Stress Mechanism Versus Dislocation Mechanism
There are two major mechanisms previously proposed to describe the round shape of stress–strain curve of lath martensite at the early stage of deformation; the type II internal stress relaxation10) and the presence of mobile dislocation.8,12) Hutchinson et al.10) claimed that the large internal stresses introduced during martensitic transformation, which were mainly the inhomogeneous type II internal stresses, lowered the elastic deformation limit. They made a lath microstructure model assuming that large type II internal stresses introduced by quenching remained with tensile or compressive randomly in packets or blocks, in such a way that the large tensile value of type II internal stress averagely remained. The model accordingly simulated the diffraction profile showing an asymmetrical shape with the shoulder swelling at low Bragg angle value. In the simulation, the diffraction profile became symmetrical by increasing tensile loading. This simulation may be correct, but a careful consideration is needed before accepting their proposed deformation mechanism. First of all, there was no experimental data about the type II internal stresses with averagely large tensile value remained in the as-quenched martensite steels including in Hutchinson’s report.10) The detailed mechanism how the type II internal stresses with averagely large tensile value remained in lath martensite was also not discussed. Moreover, all measured 200 diffraction profiles shown in Hutchinson’s report were asymmetrical with the shoulders swelling at low Bragg angle values, regardless of the loading condition. The asymmetry of diffraction profiles might come from the sample itself and/or the instrument profile. However, the analysis that they performed mainly focused only on the shapes at the full width at half maximum (FWHM) on the 200 diffraction profiles only. If an analysis with considering both the full shape of diffraction profile and the instrument profile was performed, and the stress values could be quantitatively extracted and compared with the simulation model, it will be convincing.
Type II internal stresses may be generated inhomogeneously in individual blocks as reported by Fukui et al.24) The type II internal stresses within a packet were reported to distribute in compression and tension in the directions parallel and perpendicular to the lath orientation, respectively, with the values were at about the same level.24) Considering that various variants are formed with the same probability during martensitic transformation by quenching, the type II internal stresses must however be balanced to zero in a bulky sample size as used in this study or mechanical testing in many other studies. Figure 8 shows diffraction profiles of 200 and 211 reflections of sample N, observed in the as-cooled condition and after annealing at 793 K. The carbon content in sample N was very low, and the effect of tetragonality in diffraction profiles including 200 reflection was considered to be very small. The diffraction profiles in Fig. 8 were well fitted using a single contribution of Voigt function, showing that they have good symmetry. The diffraction profiles in the as-cooled condition were broad. Let us assume that there are very few dislocations, and consider as a substitute the presence of type II internal stress inhomogeneity here. If the tensile type II internal stress averagely remains with a larger portion, the diffraction profile should be asymmetrical with the shoulder swelling at large d value. The good symmetry of the diffraction profiles in the as-cooled condition shows, however, that though the inhomogeneous type II internal stresses may remain in individual blocks, they exist in the same probability to be cancelled out each other in a range of several hundred mm3 bulky size. As the type II internal stresses are averagely zero in a bulky size, their effects to the flow stress must be very small. As mentioned in section 3.1, the lattice parameter of sample N in the as-cooled condition was reduced by annealing for about 0.03%. This change in the lattice parameter was judged from the peak shift not from the profile asymmetry, since the diffraction profiles showed good symmetry in Fig. 8. The value of 0.03% may be considered as the elastic strain introduced by quenching, which is relevant to a tensile stress value of about 60 MPa by the Hooke’s law and a Young modulus of 200 GPa; but, the stress value is too low to consider the low elastic limit of lath martensite. However, the discussion about the stress interpretation in the as-cooled condition should be revisited, considering that the presence of very dense dislocations may be accompanied with the high density of cavities, and there were no other constituents accommodating compressive stresses for balance.

A careful inspection of Fig. 4 gives also some hints about the inhomogeneous type II internal stress. If the presence of internal stresses affects the elastic limit and the flow stress, the shapes or symmetry conditions of diffraction profiles observed during loading or at unloaded conditions after deformation at plastic region must change. As the low elastic limit or yield stress in the tensile deformation is discussed, the tensile component of type II internal stress should decrease after plastic deformation. Consequently, the diffraction profile for LD at unloaded condition after plastic deformation should have a shoulder at high d value or low K value with a sharper shape than the profile before deformation, because the diffraction profile before deformation had good symmetry (see Fig. 4(a)). The diffraction profile for LD in Fig. 4(b), however, showed oppositely the shoulder swelling at low K value while the sharp shoulder at high K value. The experimental diffraction profiles in Fig. 4(b) do not support the simulation done by Hutchinson et al.;10) therefore, our study was unable to confirm their proposed mechanism and model.
Type I internal stresses may remain depending on the position due to the different cooling rate, where commonly the compressive one remains at the surface and the tensile one in the inner part by cooling.19,20,49) For example, the residual stress by quenching from 1273 K in the inner part of a rod steel with diameter of 10 mm was about +200 MPa.20) The presence of this kind of stress may affect the elastic limit. However, the type I internal stress depends on the size and also the mechanical treatment. Considering that the specimen diameter was 5 mm, the type I internal stress in the specimen of sample C must be not so large.
Nakashima et al.8) observed a large relaxation of applied stress during crosshead stop at a load value relevant to the elastic limit which was about half the yield strength, in an as-quenched lath martensite steel. In other materials, normally, with a stress value of half the yield strength, there is no stress relaxation during crosshead stop.8,50) They then claimed that the stress relaxation was due to the presence of mobile dislocations which was introduced by quenching and easily moved at the beginning of deformation. The stress relaxation during crosshead stop is often observed in the plastic deformation regime,50,51) which is mainly initiated by the dislocation movement.51,52,53) The internal stress may be also relaxed during the stress relaxation process, but it occurs at the later part with the decreasing the density of mobile dislocations.53) The stress relaxation at the elastic limit of the as-quenched lath martensite reported by Nakashima et al.8) is therefore difficult to be explained by only the relaxation of type II stresses without the dislocation movement.
4.2. Dislocation Behavior in HC and SC
As deformation progresses, the dislocation density decreased in SC and increased in HC, and was followed by the condition that the q value was kept large in SC and decreased in HC. These results can be interpreted as follows. Dislocations with mainly the screw components were introduced by deformation. Screw dislocations can move in any direction, and therefore annihilate relatively easily even when they are far apart from each other.9) Edge dislocations have either to glide on slip planes or climb for annihilating, and therefore can annihilate only within short distances.9) In SC, screw dislocations move in a relatively long distance, so that they may interact with the pre-existing dislocations introduced by transformation and also the dislocations with plus and minus movements may collide. These may cause annihilation and then the decrease in the dislocation density. While in HC, screw dislocations may pile-up at the block boundaries, and then may generate secondary dislocations with the edge types. The clarifications using other methods such as TEM and ECCI are, however, still necessary to be performed in future.
5. Conclusions
Two mechanisms which were inconsistent each other, the relaxation of type II internal stress and the presence of mobile dislocation, were previously proposed to describe the low elastic limit of as-quenched lath martensite steels. The in situ observations using neutron diffraction of a Fe–18Ni alloy during thermal process and a 0.22C steel during tensile deformation were performed to revisit the deformation behavior of lath martensite steel. The results and the discussion in this study are re-summarized as follows.
(1) From the thermal process experiment of the Fe–18Ni alloy, the obtained results were as follows. The dislocations with very dense in the order of 1015 m−2 were observed in the as-cooled martensite single phase condition. The diffraction profiles had good symmetry in the as-cooled condition or after annealing, showing that the inhomogeneous type II internal stresses which might be remained in individual blocks or packets were well balanced in a bulky specimen size. The role of type II internal stress relaxation in the deformation behavior of lath martensite steel is therefore considered to be very small.
(2) From the tensile deformation experiment of the 0.22C steel, the obtained results were as follows. Dislocations with very dense in the order of 1015 m−2 and random arrangement were also observed in the as-tempered condition. The diffraction profiles had also good symmetry. The symmetry collapsed by tensile deformation, displaying the occurrence of load sharing between the packets with the active slip systems of in- (SC) and out-of-lath-plane (HC). The highly dense random arrangement dislocations easily moved at the beginning of deformation, then accumulated, annihilated and changed the arrangement differently depending on the orientation of the packet with respect to the deformation direction. The partitioning of dislocation density and type II internal stress during tensile deformation occurred between SC and HC. The strain hardening occurred in HC.
(3) The stress relaxation was reported to occur during crosshead stop at the stress of half the yield stress in an as-quenched lath martensite steel.8) Therefore, we considered that the origin of stress−strain curve with a round shape or the low elastic limit of the as-quenched lath martensite is mainly due to the presence of highly dense dislocations with random arrangement, which easily move during deformation. The highly dense random arrangement dislocations that are introduced by quenching in lath martensite steel can be the true feature of the mobile dislocations.
Acknowledgments
The authors acknowledge Prof. Y. Tomota, Prof. T. Ungár, Prof. S. Sato, Dr. T. Chiba and Prof. S. Hata for the valuable discussion, Prof. G. Miyamoto and Prof. Z. Shi for providing samples used in this study. Neutron diffraction experiments were performed at BL19 in the Materials and Life Science Facility of J-PARC under proposals 2019I0019 and 2019P0600. This work was partially supported by JSPS Kakenhi (18H05479, 20H02426, 21K14418).
References
- 1) A. L. Roitburd and G. V. Kurdjumov: Mater. Sci. Eng., 39 (1979), 141. https://doi.org/10.1016/0025-5416(79)90055-7
- 2) S. Kajiwara and T. Kikuchi: Acta Metall. Mater., 39 (1991), 1123. https://doi.org/10.1016/0956-7151(91)90200-K
- 3) V. A. Lobodyuk, Y. Y. Meshkov and E. V. Pereloma: Metall. Mater. Trans. A, 50 (2019), 97. https://doi.org/10.1007/s11661-018-4999-z
- 4) M. Hayakawa and M. Oka: Acta Metall., 31 (1983), 955. https://doi.org/10.1016/0001-6160(83)90124-4
- 5) G. B. Olson: Scr. Metall., 21 (1987), 1023. https://doi.org/10.1016/0036-9748(87)90243-2
- 6) S. Morito, X. Huang, T. Furuhara, T. Maki and N. Hansen: Acta Mater., 54 (2006), 5323. https://doi.org/10.1016/j.actamat.2006.07.009
- 7) K. Ullakko and V. G. Gavriljuk: Acta Metall. Mater., 40 (1992), 2471. https://doi.org/10.1016/0956-7151(92)90316-7
- 8) K. Nakashima, Y. Fujimura, H. Matsubayashi, T. Tsuchiyama and S. Takaki: Tetsu-to-Hagané, 93 (2007), 459 (in Japanese). https://doi.org/10.2355/tetsutohagane.93.459
- 9) T. Ungár, S. Harjo, T. Kawasaki, Y. Y. Tomota, G. Ribárik and Z. Shi: Metall. Mater. Trans. A, 48 (2017), 159. https://doi.org/10.1007/s11661-016-3845-4
- 10) B. Hutchinson, P. Bate, D. Lindell, A. Malik, M. Barnett and P. Lynch: Acta Mater., 152 (2018), 239. https://doi.org/10.1016/j.actamat.2018.04.039
- 11) S. Morito, J. Nishikawa and T. Maki: ISIJ Int., 43 (2003), 1475. https://doi.org/10.2355/isijinternational.43.1475
- 12) D. Akama, T. Tsuchiyama and S. Takaki: ISIJ Int., 56 (2016), 1675. https://doi.org/10.2355/isijinternational.ISIJINT-2016-140
- 13) X. Huang, S. Morito, N. Hansen and T. Maki: Metall. Mater. Trans. A, 43 (2012), 3517. https://doi.org/10.1007/s11661-012-1275-5
- 14) G. K. Williamson and W. H. Hall: Acta Metall., 1 (1953), 22. https://doi.org/10.1016/0001-6160(53)90006-6
- 15) G. K. Williamson and R. E. Smallman: Philos. Mag., 1 (1956), 34. https://doi.org/10.1080/14786435608238074
- 16) G. I. Taylor: J. Inst. Met., 62 (1938), 307.
- 17) T. Ungár, I. Dragomir, Á. Révész and A. Borbély: J. Appl. Crystallogr., 32 (1999), 992. https://doi.org/10.1107/S0021889899009334
- 18) T. Ungár, J. Gubicza, G. Ribárik and A. Borbély: J. Appl. Crystallogr., 34 (2001), 298. https://doi.org/10.1107/S0021889801003715
- 19) P. J. Withers and H. K. D. H. Bhadeshia: Mater. Sci. Technol., 17 (2001), 355. https://doi.org/10.1179/026708301101509980
- 20) S. Harjo, Y. Tomota and M. Ono: Acta Mater., 47 (1998), 353. https://doi.org/10.1016/S1359-6454(98)00300-0
- 21) H. Kitahara, R. Ueji, N. Tsuji and Y. Minamino: Acta Mater., 54 (2006), 1279. https://doi.org/10.1016/j.actamat.2005.11.001
- 22) A. Stormvinter, A. Borgenstam and P. Hedström: Solid State Phenom., 172–174 (2011), 61. https://doi.org/10.4028/www.scientific.net/SSP.172-174.61
- 23) G. Miyamoto, N. Iwata, N. Takayama and T. Furuhara: Acta Mater., 58 (2010), 6393. https://doi.org/10.1016/j.actamat.2010.08.001
- 24) D. Fukui, N. Nakada and S. Onaka: Acta Mater., 196 (2020), 660. https://doi.org/10.1016/j.actamat.2020.07.013
- 25) Y. Mine, K. Hirashita, H. Takashima, M. Matsuda and K. Takashima: Mater. Sci. Eng. A, 560 (2013), 535. https://doi.org/10.1016/j.msea.2012.09.099
- 26) H. Ghassemi-Armaki, P. Chen, S. Bhat, S. Sadagopan, S. Kumar and A. Bower: Acta Mater., 61 (2013), 3640. https://doi.org/10.1016/j.actamat.2013.02.051
- 27) A. Shibata, Y. Takeda, N. Park, L. Zhao, S. Harjo, T. Kawasaki, W. Gong and N. Tsuji: Scr. Mater., 165 (2019), 44. https://doi.org/10.1016/j.scriptamat.2019.02.017
- 28) Z. M. Shi, W. Gong, Y. Tomota, S. Harjo, J. Li, B. Chi and J. Pu: Mater. Charact., 107 (2015), 29. https://doi.org/10.1016/j.matchar.2015.06.040
- 29) Y. Wang, Y. Tomota, T. Ohmura, S. Morooka, W. W. Gong and S. Harjo: Acta Mater., 184 (2020), 30. https://doi.org/10.1016/j.actamat.2019.11.051
- 30) S. Harjo, T. Kawasaki, N. Tsuchida, S. Morooka and W. Gong: ISIJ Int., 61 (2021), 648. https://doi.org/10.2355/isijinternational.ISIJINT-2020-503
- 31) S. Harjo, T. Kawasaki, Y. Tomota, W. Gong, K. Aizawa, G. Tichy, Z. Shi and T. Ungár: Metall. Mater. Trans. A, 48 (2017), 4080. https://doi.org/10.1007/s11661-017-4172-0
- 32) S. Harjo, N. Tsuchida, J. Abe and W. Gong: Sci. Rep., 7 (2017), 15149. https://doi.org/10.1038/s41598-017-15252-5
- 33) S. Harjo, S. Kubota, W. Gong, T. Kawasaki and S. Gao: Acta Mater., 196 (2020), 584. https://doi.org/10.1016/j.actamat.2020.07.016
- 34) T. Yamashita, N. Koga, T. Kawasaki, S. Morooka, S. Tomono, O. Umezawa and S. Harjo: Mater. Sci. Eng. A, 819 (2021), 141509. https://doi.org/10.1016/j.msea.2021.141509
- 35) Z. Shi, K. Liu, M. Wang, J. Shi, H. Dong, J. Pu, B. Chi, Y. Zhang and L. Jian: Mater. Sci. Eng. A, 535 (2012), 290. https://doi.org/10.1016/j.msea.2011.12.088
- 36) H. Uchima, M. Kumagai, J. Shimbe, A. Tanabe, Y. Mizuno and Y. Onuki: ISIJ Int., 62 (2022), ISIJINT. https://doi.org/10.2355/isijinternational.ISIJINT-2021-443
- 37) S. Harjo, T. Ito, K. Aizawa, H. Arima, J. Abe, A. Moriai, T. Iwahashi and T. Kamiyama: Mater. Sci. Forum, 681 (2011), 443. https://doi.org/10.4028/www.scientific.net/MSF.681.443
- 38) R. Oishi-Tomiyasu, M. Yonemura, T. Morishima, A. Hoshikawa, S. Torii, T. Ishigaki and T. Kamiyama: J. Appl. Crystallogr., 45 (2012), 299. https://doi.org/10.1107/S0021889812003998
- 39) G. Ribárik, T. Ungár and J. Gubicza: J. Appl. Crystallogr., 34 (2001), 669. https://doi.org/10.1107/S0021889801011451
- 40) G. S. Pawley: J. Appl. Crystallogr., 14 (1981), 357. https://doi.org/10.1107/S0021889881009618
- 41) C. Garcia-Mateo, F. G. Caballero, C. Capdevila and C. Garcia de Andres: Scr. Mater., 61 (2009), 855. https://doi.org/10.1016/j.scriptamat.2009.07.013
- 42) M. Villa, F. B. Grumsen, K. Pantleon and M. A. J. Somers: Scr. Mater., 67 (2012), 621. https://doi.org/10.1016/j.scriptamat.2012.06.027
- 43) S. Sato, A. Kuroda, K. Satoh, M. Kumagai, S. Harjo, Y. Tomota, Y. Saito, H. Todoroki, Y. Onuki and S. Suzuki: Tetsu-to-Hagané, 104 (2018), 201 (in Japanese). https://doi.org/10.2355/tetsutohagane.TETSU-2017-082
- 44) Y. Y. Tomota, S. Sato and S. Harjo: Tetsu-to-Hagané, 103 (2017), 73 (in Japanese). https://doi.org/10.2355/tetsutohagane.TETSU-2016-085
- 45) S. Harjo, T. Kawasaki and S. Morooka: Adv. Exp. Mech., 2 (2017), 112. https://doi.org/10.11395/aem.2.0_112
- 46) S. Nambu, M. Michiuchi, Y. Ishimoto, K. Asakura, J. Inoue and T. Koseki: Scr. Mater., 60 (2009), 221. https://doi.org/10.1016/j.scriptamat.2008.10.007
- 47) J. Quinta da Fonseca, E. C. Oliver, P. S. Bate and P. J. Withers: Mater. Sci. Eng. A, 437 (2006), 26. https://doi.org/10.1016/j.msea.2006.04.057
- 48) A. Shibata, S. Morito, T. Furuhara and T. Maki: Acta Mater., 57 (2009), 483. https://doi.org/10.1016/j.actamat.2008.09.030
- 49) S. Sen, B. Aksakal and A. Ozel: Int. J. Mech. Sci., 42 (2000), 2013. https://doi.org/10.1016/S0020-7403(99)00063-6
- 50) S. Harjo, Y. Tomota, P. Lukáš, D. Neov, M. Vrána, P. Mikula and M. Ono: Acta Mater., 49 (2001), 2471. https://doi.org/10.1016/S1359-6454(01)00147-1
- 51) M. A. Choudhry and M. Ashraf: J. Alloy. Compd., 437 (2007), 113. https://doi.org/10.1016/j.jallcom.2006.07.079
- 52) U. Martin, U. Mühle and H. Oettel: Mech. Time-Depend. Mater., 2 (1998), 1. https://doi.org/10.1023/A:1009770805261
- 53) K. Okazaki and Y. Aono: Int. J. Mater. Res., 68 (1977), 368. https://doi.org/10.1515/ijmr-1977-680510

