Abstract
Flash ironmaking technology (FIT) is a potential alternative ironmaking process reducing energy consumption and environmental pollution. The newly proposed counter-current flash ironmaking process has a more reasonable temperature and concentration distribution, while the high dust rate cannot be avoided. In this study, a counter-current swirling configuration was introduced to improve the dust control performance. A comprehensive computational fluid dynamics (CFD) model, including gas-particle motion, chemical reactions, particle-wall sticking, slag movement, and wall reaction, was adopted to investigate the velocity vector, temperature, species distribution under the counter-current swirling flow. The effects of initial particle velocity (IPV) and swirl angle velocity (SAV) were analyzed as the crucial parameters. The results show that an annular updraft-center downdraft structure is formed by swirling flow, and the particles are pushed to the wall under the centrifugal force, adhere to the high-temperature wall, and flow down slowly with the molten slag. In the non-swirl cases, the increase of IPV can effectively inhibit the particles escaping ratio from 62.5% to 22.4% and increase the amount ratio of particles leaving the bottom directly with a lower reduction degree. Therefore, necessary swirling flow enhances the high probability of adhesion when the SAV over a varying critical value related to IPV. Also, the long residence time in the molten slag effectively increases the reduction degree of captured particles from 94.3% to 100%. The comprehensive reduction degree of particles increased from 83.3% to 87.3% in a single-cycle reaction.
1. Introduction
Flash ironmaking technology (FIT) is a potential alternative ironmaking process with high-temperature reductive gas and small-sized ore particles.1) Due to the excellent reactivity of gas-particles contact under entrained-flow bed conditions, the particles can be reduced to a higher reduction degree in a few seconds. This breakthrough in the reaction rate brings many advantages, such as reaction efficiency, mineral adaptability, and energy consumption.2,3)
There are two main types of reactors in the previous research for the flash ironmaking process. The first one is a high-temperature drop tube reactor (HDTR) with pre-prepared reductive gas, and the flow state is usually low-speed downstream or upstream laminar flow.4,5) The second one is based on fuel-oxygen flame generating heat and reducing gas at the same time, such as H2–O2,6) CH4–O2,7) coal-O2,8,9) and biomass-O2.10) These oxidation-reduction coupling reactors usually take a downstream jet as the flow pattern to ensure a stable and continuous reaction. However, previous researches have proved that the reduction potential distribution is unreasonable, leading to the low utilization ratio of reductive gas.9,11) In the absence of gas reusing system, the low utilization rate of reducing gas will cause extremely high consumption and brings great difficulties for engineering application.
Therefore, some researchers put forward the concept of counter-current flash ironmaking reactor and verified the advantages of counter-current reactor, including the higher reduction degree and gas utilization.12) However, the particles escaping from the top are unavoidable and closely related to the upstream gas velocity. Therefore, inhibiting particle escaping has become a fundamental problem in developing the counter-current reactor. The swirling flow was expected to increase the adhesion of the particles and prolong the residence time.
Swirling flow is widely used in engineering fields, such as flash copper smelting,13) dust collector,14) and cyclone furnace.15) Many researchers have studied swirling patterns by experimental or numerical methods. Kitoh et al.16) investigate the swirling flow in a straight pipe. Centrifugal stabilizing/destabilization effect skewness and history effect were considered; the flow has three regions: wall, annular, and core. In addition to studying basic flow patterns, chemical reaction processes involving heat and mass transfer have also been widely studied. Chterev et al.17) investigate the flame shapes and flow configurations in a swirl-stabilized dump combustor. At least three flame stabilization locations are presently associated with the annulus’s inner and outer shear layers and the stagnation point of the vortex breakdown region.
Swirling flow usually has a complex turbulence structure, and some early turbulent models cannot deal with this problem well. The reactor-level numerical model based on complex reaction engineering can be established based on developed computer calculation ability and basic theory. Ozalp et al.18) investigate the Lagrangian characterization of multi-phase turbulent flow in a solar reactor using a three-dimensional CFD analysis. Higher tangential velocities help maintain a stronger swirl, which keeps the screening flow close to the reactor window. Xu et al.19) studied the influence of swirling flows on pulverized coal gasifiers. The burner swirl number (SN) should be between 0.66 and 0.9 to guarantee gasifier performance and membrane wall safety in this study. In the application scenarios represented by the gas separator, swirl combustion reactor and swirl gasifier, experiments/simulation are widely used to study related problems.20,21,22) The application of circumferential velocity can usually improve the particle residence time, increase the wall collision and shorten the reactor structure, which has advantages for some specific chemical reaction processes.
In this paper, the swirling flow was expected to reduce the dust ratio and prolong the particle residence time. A comprehensive CFD model was established based on the classical Eulerian-Lagrangian method (E-LM), complete reaction kinetics,23,24) and reasonable particle sticking law. The secondary development by user-defined functions (UDF) was conducted to enhance the calculation and post-treatment of commercial software. Therefore, the counter-current furnace was investigated by our CFD model, and the influence of swirling can be considered. The initial particles velocity (IPV) and swirl angular velocity (SAV) are recognized as important boundary conditions, and the results were carefully analyzed. Also, the non-swirl cases were compared with swirl cases to figure out the effect and advantages of swirling flow.
2. Equations
2.1. Physical Model & Boundary Conditions
An idealized physical model is introduced, as shown in Fig. 1. The particles fall from the center of the furnace top with an initial particle velocity (IPV), and the reductive gas flows upstream from the gas inlet. In the process of gas-particle countercurrent flow, the falling particles may be forced upward and leave from the gas outlet, or they may leave directly from the gas inlet, which was dependent on the flow characteristics.
The gas flow velocity can be divided into axial velocity and rotational velocity. The axial velocity ua remains unchanged as 1 m/s, which is larger than the terminal velocity of particles. The swirling flow is represented by swirl angular velocity (SAV) (rad/s), and the circumferential velocity uc can be calculated by swirl angular velocity times radius. The two-dimensional swirl axisymmetric mesh was adopted in this study, representing the accurate results of the highly symmetrical process.
In this study, the IPVs and SAVs were variables, while the reductive gas and ore amount was fixed as 1740 Nm3/h and 1.44 t/h. The inlet gas was generated in the bottom settler, and the swirling flow can be realized by deflecting three nozzles on the side wall. However, the gas generation process was not included into this work. In the previous works, different fuels including coal, biomass, CH4 and H2 was investigated as gas generation resource and coupled with FIT. Different fuels have different combustion mechanisms and gas compositions.6,7,8,9,10) It is assumed that the upper cavity of the settler can be used as the location of gas generation, which is outside the computational zone. Therefore, the gas generation process was not considered in this study, and a simplified gas composition with pure H2: CO ratio was directly used as Fig. 1 shown. The ore composition was listed in Table 1. R-R distribution was adopted to fit the particle diameters, and the average particle diameter is equal to 68 μm.
Table 1. Chemical components of hematite fine.
| Sample | Chemical composition (wt. %) |
|---|
| Fe2O3 | SiO2 | MgO | CaO | Al2O3 |
|---|
| Hematite powder | 93.69 | 3.27 | 1.51 | 0.07 | 1.46 |
The basic framework in this study is the classical gas-particle flow, which E-LM can well treat. A two-dimensional Reynolds-averaged Navier-Stokes (RANS) model was adopted to calculate the steady flow. For the sake of simplicity, the formula under the E-LM framework is no longer repeated but was summarized as shown in Table 2. According to the conservation of mass, momentum, and energy, these formulas have been derived by predecessors and widely verified in CFD studies. It should be noted that the mass of particles will only change due to mass resources, such as chemical reactions, so no additional governing equation of mass conservation is required. In the particle motion equation, gravity FG, buoyancy FB, and drag FD are recognized as the most important forces for the in-flight particle motion. The gravity and buoyancy is body force, which always point in the direction and opposite direction of gravity separately. While, the drag force is dependent on the relative gas-particle velocity, and force the particle change the direction and velocity to follow the gas flow. Different drag coefficient expression can be used to calculate the drag force according to the particle characteristic. For the sparse granular phase, the force between particles is relatively weak, so the spherical drag model can be directly used. It is mainly affected by the gas flow state, which can be written as follows:19)
|
C
D
={
24
Re
(
Re<0.1
)
3.69+
22.73
Re
+
0.0903
R
e
2
(
0.1<Re<1.0
)
1.222+
29.1667
Re
-
3.8889
R
e
2
(
1<Re<10
)
0.6167+
46.5
Re
-
116.67
R
e
2
(
10<Re<100
)
0.3644+
98.33
Re
-
2 778
R
e
2
(
100<Re<1 000
)
0.357+
148.62
Re
-
47 500
R
e
2
(
1 000<Re<5 000
)
0.46-
490.546
Re
+
578 700
R
e
2
(
5 000<Re<10 000
)
0.591-
1 662.5
Re
+
5 416 700
R
e
2
(
10 000<Re
)
| (1) |
where
Re is the Reynold number calculated by the local velocity of the gas. However, it should be noticed that other gas-particle forces can also affect particle motion, such as thermophoresis
FT, pressure-dependent
FP, Saffman lift
FL, and virtual mass force
FV. However, compared with the drag force under high velocity and the gravity of ore particles in this study, these forces are relatively weak and have not been considered. On the other hand, the particle-particle force, such as elastic force
FE and van der Wales force
FW should be considered in a dense discrete phase and not included in this study. This is because the particle load in the entrained flow bed, or flash ironmaking furnace here, is much smaller than that in the fluidized bed, and the volume proportion of particles is less than 1%. In this situation, the interaction of particles can be ignored in most of the previous works.
4,5,19)
Table 2. Summary of governing equations of gas-particle flow.
| Classification | Governing equations |
|---|
| Continuous fluid |
| 1. Mass conversion |
∂
∂
x
i
(
ρ
u
i
)
=
S
m
|
| 2. Momentum conversion |
∂
∂
x
j
(
ρ
u
i
u
j
)
=-
∂p
∂
x
i
+
∂
∂
x
j
(
τ
ij
-ρ
u
i
′
u
j
′
¯
)
+ρ
g
i
+
F
i
|
| 3. Heat conversion |
∂
∂
x
i
(
ρ
u
i
h
g
)
=
∂
∂
x
i
(
k
eff
∂T
∂
x
i
)
+
Q
r
+
S
h
|
| Discrete particle |
| 1. Momentum conversion |
d
u
i,p
dt
=
F
G
+
F
B
+
F
D
|
|
F
D
=
C
D
⋅
π
d
p
2
4
⋅
ρ
(
u
i
-
u
i,p
)
2
2
|
|
m
p
c
p,
d
d
T
p
dt
=h
A
p
(T-
T
p
)-
d
m
p
dt
Δ
r
H
reac
+
ε
p
A
p
σ(
T
4
-
T
p
4
)
|
| 2. Heat conversion |
Nu=2.0+0.6R
e
1
2
P
r
1
3
=
h
g
d
p
k
g
|
The current movement of particles is mainly affected by gravity and drag. Since the initial particles move downward, they will maintain a downward trend at the beginning. Then, they may be entrained upward and become fly ash in the outlet gas under the effect of upward flow. Another possibility is that the particles avoid the central high-speed gas flow, maintain a downward trend, and leave from the lower gas inlet. In this study, the third possibility is that the particles are captured in the liquid wall film, and then they are no longer subject to the drag force. The liquid surface falls slowly under gravity and shear force and finally flows out of the gas inlet. Before being captured by the liquid film, the particles may repeatedly experience the rising and falling process. The uncertainty of the flow field, especially the turbulent pulsating velocity, enhances the occurrence of different possibilities.
2.3. Homogeneous & Heterogeneous Reactions
The possible materials included H2, CO, H2O, CO2, Fe2O3, Fe3O4, FeO, Fe, and gangue in the current reaction system. The reactions between species can be divided into ore reduction reactions by H2/CO, water gas shift reaction (WGSR), and reverse water gas shift reaction (rWGSR).
The reduction degree X represents the reduction process of ore particles according to the residual oxygen content.
where
X is the reduction degree of hematite particles, Δ[
O] is the reduced mass fraction of oxygen lost, and [
O]
i is the initial mass fraction of oxygen in the ferrous oxides.
Assuming the gangue components were inert during the reduction process, the critical reduction degree could be written as followings:9)
|
X=
m
p,0
-
m
p,t
m
p,0
×
w
[O]
,
| (3) |
where
mp,0 is the initial particle weight (kg),
mp,t is the reduced particle weight (kg), and
w[O] is the oxygen element mass fraction in the ferrous oxides.
The detailed reactions and kinetic formula are listed in Table 3. These expressions can be found in the previous works.5,24,25,26,27) The previous work adopted one-step reduction from hematite to metal iron because the different reduction stages are hard to be the distinguished. However, the existing FeO observed during the flash ironmaking cannot be quantified by this way. Therefore, a compromise method was adopted: the possible step-by-step reaction formula were listed, and the unified reduction degree variation expression was adopted. It ensures that the overall reduction degree change is consistent with Sohn’s experimental data, and the real-time content of intermediate FeO is obtained. If the detailed kinetic expression of each reaction step was determined under the flash condition, the reaction description will undoubtedly be more accurate.
Table 3. Summary of homogeneous & heterogeneous reactions.
5,24,25,26,27)| Number | Reaction Formula | Reaction Rate |
|---|
| 1 | 3Fe2O3+H2=2Fe3O4+H2O | when ore in pure H2/H2O atmosphere |
| 2 | Fe3O4+H2=3FeO+H2O |
dX
dt
=4.41×
10
7
e
-
214 000
RT
(1-X)×(
p
H
2
-
p
H
2
O
K
e
)
×α
|
| 3 | FeO+H2=Fe+H2O | when ore in H2/CO mixture |
| 4 | Fe3O4+H2=3Fe+H2O |
dX
dt
=
[
1+(-0.0004T+7.004)⋅
p
co
p
co
+
p
H
2
]⋅
dX
dt
|
H
2
×α
|
| 5 | Fe2O3+CO=Fe3O4+CO2 |
dX
dt
=1.91×
10
7
e
-
231 000
RT
(1-X)×(
p
CO
-
p
C
O
2
K
e
)
×α
|
| 6 | Fe3O4+CO=FeO+CO2 |
| 7 | FeO+CO=Fe+CO2 |
| 8 | Fe3O4+CO=Fe+CO2 |
| 9 | CO+H2O=CO2+H2 |
dn
dt
=9.87×
10
5
e
-
112 000
RT
×(
p
CO
p
H
2
O
)
|
| 10 | CO2+H2=CO+H2O |
dn
dt
=2.3×16
e
-
397 500
RT
×(
p
C
O
2
p
H
2
)
|
The reduction degree, temperature and gas pressure can be obtained directly from the model, but the equilibrium constant need the further derivation according to the following Eq. (4), and the detailed value was listed by Qu et al.29)
where Δ
Gθ is the free Gibbs free energy variation before and after the reactions.
α is a newly introduced efficiency factor, which is set as 1 at first.
2.4. Particle Sticking and Wall Reactions
Since the molten particles sticking to the wall would considerably influence the reactor performance, it should be clarified whether particles sticking occurred or not. The different morphologies, compositions, temperature, kinetic energy, and surface tension can affect the results. A sticking/rebound criterion was proposed and introduced into our CFD model. As shown in Fig. 2, the slag layer will be deposited on the refractory brick and flow down slowly. The rebounded particles will lose part of their tangential momentum and go back to the gas phase. However, the adhesive particles will stick to the slag, flow downward at a certain speed (set as 0.03 m/s), and continue the gas-particle reaction in a reductive atmosphere to be metallic iron. Due to the lack of wall reactions studies, the form of particles floating on the surface of the slag in Fig. 2 is temporarily considered a simplified treatment, and the efficiency factor (α = 0.5) is introduced into the gas-particle reaction formula in Table 3 to consider the decreased particle reaction area.

As listed in Table 4, particle morphologies are divided into four types: un-melted, iron-wrapped, soft-melted, and slag-wrapped forms, according to whether the slag iron is layered and whether the particles are melted. According to the experimental conditions, we can roughly establish the relationship between particle morphology, reduction degree, and temperature. The experimental processes can be found in our previous work.28) The methods of electron microscope, element surface scanning, and chemical titration of reduction degree were combined to deduce the morphology variation. The particle morphologies in the similar studies are also referred.24,25,30,31) The significant slag-iron stratification also makes it easy to judge the reduction process of single particles. Therefore, we proposed a rough framework for the further mathematical modeling.
Table 4. Summary of morphology and experimental conditions.
24,25,28,30,31)Different particle criteria can be adopted based on the morphology, as shown in Table 5. Since the detailed modeling was elaborated before, the derivation process was not repeated here. In summary, two different criteria can be selected. The first is the Weber number criterion,32) and the second is the critical viscosity criterion.33) In un-melted and iron-wrapped form, the viscosity of the particle itself is low. Adhesion mainly depends on the particle kinetic energy and the particle/slag surface tension. When the speed is high, the particles are easy to rebound; otherwise, adhesion occurs. According to the temperature difference between particles and slag, different calculation methods of surface tension are selected. The particles have appeared spherical after soft melting in soft-melted and slag-wrapped form, so they have considerable fluidity and viscosity. Urbain’s viscosity model was used to calculate the particle viscosity,34) and adhesion occurred if the viscosity was over a critical viscosity (μc = 8 pa·s).
Table 5. Summary of stick/rebound criteria.
32,33,34) | Un-melted | Iron-wrapped | Soft-melted | Slag-wrapped |
|---|
| Description |
We=
Particle Kinetic
Surface Tension
=
ρ
p
υ
p
2
d
p
σ
sp
σ
sp
={
σ
p
-0.5
σ
s
(
T
slag
>
T
cυ
&&
T
p
>
T
cυ
)
σ
p
(
T
slag
>
T
cυ
&&
T
p
>
T
cυ
)
σ
s
(
T
slag
<
T
cυ
&&
T
p
>
T
cυ
)
-1(
T
slag
<
T
cυ
&&
T
p
<
T
cυ
)
|
log(μ/T)=a+
10
3
b
T
-ln a=0.2693⋅b+13.9751
b=
b
0
+
b
1
⋅N+
b
2
⋅
N
2
+
b
3
⋅
N
3
b
i
=b
b
i1
+b
b
i2
*aa+b
b
i3
*aa*aa
aa=
[A
l
2
O
3
]+[F
e
2
O
3
]
[FeO]+[CaO]+[MgO]+[A
l
2
O
3
]+[F
e
2
O
3
]
|
| Judgement | We<1 | We>1 | Wes<1 | Wes>1 | μp<8 pa·s | μp>8 pa·s | μs<8 pa·s | μs>8 pa·s |
| Determine | Stick | Rebound | Stick | Rebound | Stick | Rebound | Stick | Rebound |
*N is the SiO2 content in the glass, bbi1,bbi2,bbi3 is the parameter determined by Urbain et al.34)
3. Numerical Details
The commercial software package ANSYS 19.1 was used in this research to generate a suitable mesh (ICEM) and provide a basic Eulerian-Lagrangian framework (Fluent). User-defined functions (UDFs) are widely used to realize chemical reaction, sticking criterion, and particle motion. Multi-process cluster servers are used to speed up the calculation. Also, high-order discrete schemes, such as QUICK, two-order upwind schemes, were adopted to suppress the pseudo-diffusion problem. The grid independence verification was already conducted, and a good agreement was ensured with different grids. Because the actual reactor has not been established, the numerical simulation cannot be verified by experiments at this moment. However, this study still has considerable credibility based on well-verified research on fluid dynamics, reaction kinetics, and particle adhesion mechanism.
In this study, swirl angular velocity (SAV) and initial particle velocity (IPV) are selected as investigated variables, and the working cases are summarized in Table 6.
Table 6. Summary of operation cases.
| Swirl angular velocity | Initial particle velocity (m/s) |
|---|
| 2 m/s | 5 m/s | 10 m/s | 20 m/s | 40 m/s |
|---|
| 0 rad/s | Case-1 | Case-8 | Case-15 | Case-22 | Case-29 |
| 1 rad/s | Case-2 | Case-9 | Case-16 | Case-23 | – |
| 2 rad/s | Case-3 | Case-10 | Case-17 | Case-24 | – |
| 3 rad/s | Case-4 | Case-11 | Case-18 | Case-25 | – |
| 4 rad/s | Case-5 | Case-12 | Case-19 | Case-26 | – |
| 5 rad/s | Case-6 | Case-13 | Case-20 | Case-27 | – |
| 6 rad/s | Case-7 | Case-14 | Case-21 | Case-28 | Case-30 |
4. Results & Discussion
4.1. Swirl and Non-swirl Cases
Case-15 (SAV = 0 rad/s, IPV = 10 m/s) and Case-21 (SAV = 6 rad/s, IPV = 10 m/s) were chosen as the base-cases with non-swirling and swirling flow separately. Other variables were kept consistent to compare the influence of swirling flow. Firstly, the flow pattern of the turbulent structure was changed by swirl entrained gas, as shown in Figs. 3(a) and 3(b). Under the non-swirl cases, an upward velocity peak at the lower part is in the center, and there is a downward annular flow around, which is consistent with the annular core structure of the previous counter-current reactor.35)

However, in the swirl case, the peak value of the upward velocity in the bottom space presents a circular distribution, and the downward flow in the center extends close to the gas inlet. According to the axial velocity change of the central line in Fig. 3(c), the central flow direction at the lower part of the furnace body (h<3.1 m) is opposite. The swirl case reduces the possibility of the particles hitting the upstream flow, and they were sent to a lower position. However, at the bottom uniform horizontal height (h = 2 m), the peak gas velocity under swirl cases is faster than the non-swirl one, as shown in Fig. 3(d), which may harm particle falling.
At the same time, the gas distribution also shows high consistency between non-swirl and swirl cases at a higher position of the furnace, no matter the horizontal or vertical direction (h = 4 m and h = 6 m). Therefore, the differences are concentrated in the lower part of the furnace body.
Figure 4 shows the temperature and species distribution of these two cases. In the non-swirl flow, the opposed collision between low-temperature particles and high-temperature gas forms the high gradience of temperature. There is also an apparent temperature gradient between the two jets and the surrounding fluid in the radial direction. However, in swirl cases, the heat and cold flow are staggered, and the temperature gradient is more uniform in the axial or radial direction. Compared with the reductive components and temperature, the high reduction potential gas position is consistent with the high-temperature region.

Figure 5 shows the particle distribution characteristics between non-swirl and swirl cases. The comparison of contours shows that the concentration distributions are similar in the upper part, showing the high value in the center and near the wall. First, the axial particle concentration in swirl cases is higher in the lower height (h = 3 m) than in non-swirl cases. However, the absolute value difference is slight according to the quantitative analysis in Fig. 5(c). Currently, the particle concentration is lower than 0.2 kg/m3, and the volume fraction of the discrete phase does not exceed 0.01%. The highest concentration peak of the centerline is at the inlet and then gradually decreases, and the maximum concentration is 13.6 kg/m3, but the volume fraction after conversion is about 0.227%, which still belongs to the category of sparse discrete phase.

However, the particle concentration distribution on the wall shows a different law in Fig. 5(d). The first peak of particle concentration appears at the height of 4 m. The initial kinetic energy is exhausted at this position, and particles begin to spread to the surrounding, which causes a significant peak of particle concentration near the wall. With the particles dropping, the particle concentration near the wall in the non-swirl cases gradually decreases, but the swirl case has a second higher peak. The swirling flow greatly increases the probability of particles colliding with the wall in this area. At the same time, according to the adhesion characteristics of the particles, the high-temperature area is prone to higher adhesion probability. As a result, most particles stick to the wall, and the particle concentration increases rapidly.
As shown in Table 7, the critical results of the two cases were summarized, divided into gas-related and particle-related items. Lower temperature (1223.78 K) and reductive species (H2 = 0.3052 and CO = 0.4315) of top gas were observed in the swirl case compared with the non-swirl case. It reflects the higher utilization rate of reductive gas, defined as the ratio of oxidative species (H2O/CO2) and the sum (H2+H2O/CO+CO2).
Table 7. Comparison between critical parameters for non-swirl and swirl cases.
| Non-swirl case | Swirl case |
|---|
| Gas Phase |
| Temperature | 1235.98 | 1223.78 |
| Mass (kg/s) | 0.41708 | 0.42166 |
| Volume (Nm3/h) | 1765.122 | 1746.162 |
| CO | 0.4350 | 0.4315 |
| CO2 | 0.0650 | 0.0685 |
| H2 | 0.3116 | 0.3052 |
| H2O | 0.1884 | 0.1948 |
| Particle |
| Reduction degree (%) | 83.3 | 87.30 |
| Mass fraction of particles escaping | 78.2 | 78.7 |
| Reduction degree | 94.33 | 99.99 |
| Mass fraction of particles trapped | 21.8 | 21.3 |
| Reduction degree | 34.68 | 27.19 |
The reduction degree X is the most critical index for particle-related data. The swirl case owns a higher reduction degree of 87.30% than 83.3% in the non-swirl case. The reason should be attributed to the two aspects. Firstly, the particles that escaped from the bottom become more due to sticking to the wall. Secondly, the sticky particles move slowly with slag flow, which leads to a longer residence time.
4.2. Effect of Initial Particle Velocity
The initial particle velocity (IPV) has an important influence on particle trajectories and concentration distribution. The effects of IPVs in non-swirl and swirl cases are investigated, respectively. According to particle trajectories in Fig. 6, the higher IPV brings a stronger downstream flow, effectively transporting the particle to a lower position. It also suppresses the particle escaping from the top.

To further clarify the particle whereabouts, parts of particles stuck to the slag and then fell into the bottom were distinguished from the others leaving the bottom directly. Therefore, the three kinds of particles are summarized in Fig. 7. In non-swirl cases, the dust ratio was reduced as expected from 62.0% to 21.5%, while the particle amount leaving from the bottom increased significantly from 0% to 79.5% and then kept unchanged when IPV was over 10 m/s. Compared with particles dropping with slag, the particle leaving the bottom has a short residence time, leading to a low reduction. The amount of particles dropping with slag first rises then falls to zero, which means higher IPVs reduce wall sticking in non-swirl cases.

Figure 7(b) shows the corresponding variation of swirl cases with different IPVs. The dust ratio varied from 59.8% to 20.3% in the non-swirl cases. However, the particle leaving from the bottom was suppressed—most particles drop with slag even in the high-IPV cases. Therefore, in swirl cases, higher IPV is always beneficial before IPV over 10 m/s but keeps unchanged with further increasing.
Figure 8(a) shows the mass concentration variation in the axis with IPV increasing. The absolute value of the peak particle concentration was reduced from 20 kg/m3 to less than 5 kg/m3 when the initial particle velocity was equal to 40 m/s. At the same time, the peak position also shifts downward, and the distribution on the axis is uniform. High-speed incidence is beneficial to the dispersion of particles and inhibits the adhesion between particles, which is harmful to continuous reactions.
However, the near-wall particle concentration in Fig. 8(b) shows that the first peak moved downward from 6.5 m to about 3.8 m, and the absolute value has increased from 0.5 kg/m3 to 1.7 kg/m3. The second peak of particle concentration on the wall is caused by swirling flow. As the IPVs increase, the peak moves to a height lower than 1 m, and the absolute concentration increases significantly. However, when IPV exceeds 10 m/s, there is no significant difference in the absolute value of the peak.
4.3. Effect of Swirl Number
The pre-text comparison between non-swirl (SAV = 0 rad/s) and swirl cases (SAV = 6 rad/s) was conducted, but the swirl intensity has not been thoroughly studied. A fixed initial particle velocity (IPV = 10 m/s) was chosen, and SAV was adjusted to investigate the relative influence. The widely used swirl number (SN) is introduced to describe swirling intensity,19) which was defined as follows:
|
SN=
1
d/2
∫
0
d/2
ρwu
r
2
dr
∫
0
d/2
ρ
u
2
rdr
,
| (5) |
where
u,
w, and
d are the axial velocity, the tangential velocity, and the upstream tube diameter, respectively. Since the tangential velocity
w at the gas inlet can be calculated by the fixed swirl angular velocity Ω, the SN in this study can be transferred as:
|
SN=
1
d/2
∫
0
d/2
ρΩu
r
3
dr
∫
0
d/2
ρ
u
2
rdr
=
Ωur
2
.
| (6) |
Figure 9 shows the different velocity vectors with increasing SN. The swirling flow enhances the axial velocity in the low-SN cases (SN<1.0), while the conversion occurs when the SN is between 1.0 and 1.5. The velocity peak in the radial direction moved outward when the SN kept increasing. Comparing the last two cases, there is no significant difference in the flow pattern, which shows the upper limit of swirling flow. The gradually enhanced swirling flow also can be observed in Fig. 9(b).
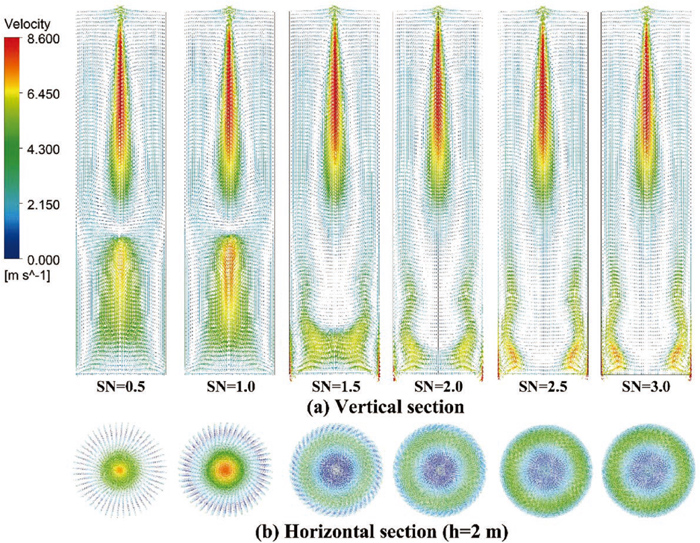
The significantly changed flow pattern also has a particular impact on particle motion. Figure 10 shows the detailed effect of swirl intensity under the different IPV cases. The transition of particle adhesion or directly escaping occurs at a critical point. According to the flow pattern and particle statistics, this mutation is related to the flow transition process. At the same time, this critical point of SAV also increased with increasing IPVs. For example, the critical value of SAV is 2 rad/s (SN=1) when IPV=10 m/s, but the critical value is 3 rad/s (SN = 2). In low-IPV cases, the particles escaping from the top declined slowly. However, it can hardly be observed in the last two cases, as shown in Figs. 10(c) and 10(d).

In conclusion, when high IPVs are selected to suppress the particle escaping from the top, it must cooperate with swirling flow (SAV>critical value) to suppress particle escaping from the bottom with a low reduction degree. However, in the low-IPV cases, the effect of swirling flow on increasing adhesion is slight because the proportion of direct escaping of particles is already low to zero.
Similarly, the cases with fixed IPVs are selected to compare critical parameters, including particle-related reduction degree and gas-related utilization rates, as shown in Fig. 11. The reduction degree of particles in low-SAV cases is significantly lower than that in high-SAV cases. Because of the particles sticking to the wall, the reduction degree of particles collected at the bottom increases significantly with the enhanced swirling flow. However, the blue line represents that the reduction degree of escaping particles dropped. It may be attributed to the enhancement of upstream flow in the turbulent structure.

Figure 11(b) shows the temperature and species of top gas with the SAVs increased from 1 rad/s to 6 rad/s. The temperature regularly decreased from 1237 K to 1224 K, and CO/H2 utilization ratio increased to 13.7% and 39.0%, respectively. It should be noted that from the perspective of mass conservation, the increase of particle reduction and gas-phase utilization represent the transfer of oxygen, which should be consistent. However, in the process of CFD-DPM calculation, the iterative process often lags, which is especially significant for the rigid chemical reaction calculation. Smaller time intervals and higher iteration frequency can suppress this situation, and the limited data fluctuation is acceptable.
5. Conclusion
In this paper, an idealized counter-current reactor structure for flash reduction ironmaking is constructed. By introducing the sticking criterion and establishing a comprehensive CFD model, the effects of initial particle velocity (IPV) and swirl angular velocity (SAV) on the gas-phase distribution, particle motion, and process parameters are emphatically investigated. The results show that the bottom swirl mainly affects the bottom flow field distribution (h<4 m). In swirl cases, an annular upstream flow is formed by swirling while the central flow is still downward. At the same time, the particles are pushed to the wall under centrifugal force, adhered to the high-temperature wall, and flow down slowly with the molten slag.
The increasing IPV can effectively inhibit the dust ratio from 62.5% to 22.4% and reduce the particle concentration from 20 kg/m3 to less than 5 kg/m3 when the initial particle velocity was equal to 40 m/s, reducing the possibility of particle-particle sticking. However, the particles may leave the bottom of the reactor directly, resulting in the lack of enough reaction time. Therefore, the swirling flow should be introduced into the counter-current turbulent flow, especially at high IPVs over 5 m/s.
By adjusting the tangential velocity in the swirl direction, the particles stick to the wall under the action of centrifugal force, effectively increasing the reduction of captured particles from 94.3% to 100%. The comprehensive reduction degree of particles increased from 83.3% to 87.3%. The temperature regularly decreased from 1237 K to 1224 K, and CO/H2 utilization ratio increased to 13.7% and 39.0%. Particles escaping from the top usually have a low reduction degree and should be captured with low-temperature top gas.
Acknowledgment
The authors acknowledge the financial support from the China Postdoctoral Science Foundation, No. 2021TQ0108, and Fundamental Research Funds for the Central Universities, No. JKB01211715. The authors declare that they have no conflict of interest.
References
- 1) H. Sohn and Y. Mohassab: J. Sustain. Metall., 2 (2016), 216. https://doi.org/10.1007/s40831-016-0054-8
- 2) H. Sohn: Metals, 10 (2020), 54. https://doi.org/10.3390/met10010054
- 3) H. Y. Sohn, Y. Mohassab, M. Elzohiery, D. Fan and A. Abdelghany: Applications of Process Engineering Principles in Materials Processing, Energy and Environmental Technologies, Springer, Cham, (2017), 15. https://doi.org/10.1007/978-3-319-51091-0_2
- 4) D. Fan, Y. Mohassab, M. Elzohiery and H. Y. Sohn: Metall. Mater. Trans. B, 47 (2016), 1669. https://doi.org/10.1007/s11663-016-0603-3
- 5) D. Fan, H. Sohn and M. Elzohiery: Metall. Mater. Trans. B, 48 (2017), 2677. https://doi.org/10.1007/s11663-017-1053-2
- 6) H. Sohn and S. Perez-Fontes: Int. J. Hydrog. Energy, 41 (2016), 3284. https://doi.org/10.1016/j.ijhydene.2015.12.013
- 7) A. Abdelghany, D. Fan, M. Elzohiery and H. Sohn: Steel Res. Int., 90 (2019), 1900126. https://doi.org/10.1002/srin.201900126
- 8) Y. Yang, L. Guo, D. Li and Z. Guo: Appl. Therm. Eng., 171 (2020), 115067. https://doi.org/10.1016/j.applthermaleng.2020.115067
- 9) Y. Yang, D. Li, L. Guo, Z. Wang and Z. Guo: Appl. Therm. Eng., 168 (2020), 114899. https://doi.org/10.1016/j.applthermaleng.2020.114899
- 10) X. Wang, G. Fu, W. Li and M. Zhu: ISIJ Int., 61 (2021), 1450. https://doi.org/10.2355/isijinternational.ISIJINT-2020-566
- 11) Y. Yang, L. Guo, Q. Bao and Z. Guo: 11th Int. Symp. on High-Temperature Metallurgical Processing, Springer, Cham, (2020), 67. https://doi.org/10.1007/978-3-030-36540-0_7
- 12) Y. Yang, Z. Shen, J. Xu and H. Liu: JOM, 74 (2022), 1499. https://doi.org/10.1007/s11837-021-05003-3
- 13) D. Higgins, N. Gray and M. Davidson: Miner. Eng., 22 (2009), 1251. https://doi.org/10.1016/j.mineng.2009.07.005
- 14) M. Pillei, T. Kofler and M. Kraxner: 17th Int. Symp. on Application of Laser Techniques to Fluid Mechanics, (Lisbon), Springer-Verlag, Berlin, (2014), 3.
- 15) K. Meijer, C. Guenther and R. Dry: Proc. 1st Int. Conf. on Energy Efficiency and CO2 Reduction in the Steel Industry, Stahlinstitut VDEh, Düsseldorf, (2011).
- 16) O. Kitoh: J. Fluid Mech., 225 (1991), 445. https://doi.org/10.1017/S0022112091002124
- 17) I. Chterev, C. W. Foley, D. Foti, S. Kostka, A. W. Caswell, N. Jiang, A. Lynch, D. R. Noble, S. Menon, J. M. Seitzman and T. C. Lieuwen: Combust. Sci. Technol., 186 (2014), 1041. https://doi.org/10.1080/00102202.2014.882916
- 18) N. Ozalp and A. Kanjirakat: Int. J. Hydrog. Energy, 35 (2010), 4496. https://doi.org/10.1016/j.ijhydene.2010.02.065
- 19) J. Xu, Q. Liang, Z. Dai and H. Liu: Fuel Process. Technol., 172 (2018), 142. https://doi.org/10.1016/j.fuproc.2017.12.012
- 20) B. Wang, D. Xu, K. Chu and A. Yu: Appl. Math. Model., 30 (2006), 1326. https://doi.org/10.1016/j.apm.2006.03.011
- 21) A. Valera-Medina, M. Gutesa, H. Xiao, D. Pugh, A. Giles, B. Goktepe, R. Marsh and P. Bowen: Int. J. Hydrog. Energy, 44 (2019), 8615. https://doi.org/10.1016/j.ijhydene.2019.02.041
- 22) P. Mikaniki, S. Najafi and H. Ghassemi: Chin. J. Chem. Eng., 27 (2019), 765. https://doi.org/10.1016/j.cjche.2018.10.001
- 23) Y. Wang, L. Cao, Z. Cheng, B. Blanpain and M. Guo: Metals, 11 (2021), 1297. https://doi.org/10.3390/met11081297
- 24) F. Chen, Y. Mohassab, T. Jiang and H. Sohn: Metall. Mater. Trans. B, 46 (2015), 1133. https://doi.org/10.1007/s11663-015-0332-z
- 25) F. Chen, Y. Mohassab, S. Zhang and H. Sohn: Metall. Mater. Trans. B, 46 (2015), 1716. https://doi.org/10.1007/s11663-015-0345-7
- 26) B. Smith R. J., M. Loganathan and M. Shantha: Int. J. Chem. React. Eng., 8 (2010), 1. https://doi.org/10.2202/1542-6580.2238
- 27) F. Bustamante, R. M. Enick, A. V. Cugini, R. P. Killmeyer, B. H. Howard, K. S. Rothenberger, M. V. Ciocco, B. D. Morreale, S. Chattopadhyay and S. Shi: AIChE J., 50 (2004), 1028. https://doi.org/10.1002/aic.10099
- 28) Y. Yang, Q. Bao, L. Guo, Z. Wang and Z. Guo: Int. J. Miner. Metall. Mater., 29 (2022), 228. https://doi.org/10.1007/s12613-020-2210-1
- 29) Y. Qu, Y. Yang, Z. Zou, C. Zeilstra, K. Meijer and R. Boom: ISIJ Int., 55 (2015), 149. https://doi.org/10.2355/isijinternational.55.149
- 30) Y. Qu, Y. Yang, Z. Zou, C. Zeilstra, K. Meijer and R. Boom: ISIJ Int., 55 (2015), 952. https://doi.org/10.2355/isijinternational.55.952
- 31) Y. Qu, L. Xing, L. Shao, Y. Luo and Z. Zou: Powder Technol., 355 (2019), 26. https://doi.org/10.1016/j.powtec.2019.06.048
- 32) L. Chen, S. Yong and A. Ghoniem: Fuel Process. Technol., 112 (2013), 106. https://doi.org/10.1016/j.fuproc.2013.02.010
- 33) A. Brink, D. Lindberg, M. Hupa, M. de Tejada, M. Paneru, J. Maier, G. Scheffknecht, A. Pranzitelli and M. Pourkashanian: Fuel Process. Technol., 141 (2016), 210. https://doi.org/10.1016/j.fuproc.2015.08.039
- 34) G. Urbain, Y. Bottinga and P. Richet: Geochim. Cosmochim. Acta, 46 (1982), No. 6, 1061. https://doi.org/10.1016/0016-7037(82)90059-X
- 35) C. Wu, Y. Cheng and Y. Jin: Chem. Eng. Technol., 32 (2009), 482. https://doi.org/10.1002/ceat.200800563


