Regular Article
Characteristics and Formation Mechanism of Complex TiN Inclusions in 20CrMnTi Gear Steel
2022 Volume 62 Issue 11 Pages 2266-2275

Details
2022 Volume 62 Issue 11 Pages 2266-2275
In this paper, in order to study the effect of oxides on the formation of complex TiN inclusions in 20CrMnTi steel, based on the two end quenching specimens with different components, the characteristics of complex TiN inclusions and oxides were observed and analyzed, and the formation mechanism of complex TiN inclusions was discussed. The results indicate the compositions of core oxides are regularly distributed in the MgAl2O4–TiOx composition line for different complex TiN inclusions, and the difference is the TiOx content. The complex TiN inclusions can be divided into two types, Type 1 and Type 2, based on the compositions of core oxides. For Type 1, TiOx content of core oxides are below 52%, while for Type 2, TiOx content of core oxides are over 52%. The core oxides of Type 1 have bigger size at the range of 1–3 µm, and lower nucleation capability for TiN inclusions. The core oxides of Type 2 have smaller size at the range of 0.5–2 µm, and higher nucleation capability for TiN inclusions. For Type 1, the MgAl2O4–TiOx oxides preexisting in molten steel are the heterogeneous nucleation cores of TiN inclusions during solidification. For Type 2, the tiny oxides newly formed during solidification are the nucleation cores of TiN inclusions. By controlling the characteristics of oxides, the characteristics of TiN inclusions can be controlled, which provides a new idea for the control of TiN inclusions in 20CrMnTi gear steel.
Gear steel is an important material for manufacturing industrial gear parts, among which 20CrMnTi gear steel is widely used because of its reliable performance and low price, and still has a large output in China. Hardenability is one of the important indicators to measure the quality of gear steel, and controlling appropriate hardenability and narrow hardenability bandwidth is the essential condition for producing high quality gear steel. For traditional gear steel, grain coarsening is easy to happen in the process of carburizing, lead to larger fluctuation of hardenability, and affects the quality of the finished product gear. A number of studies1,2,3) showed that after adding Ti into steel, it can form numbers of tiny and distributed dispersively carbonitride with high temperature thermal stability, and the grain coarsening temperature can be raised to above 1100°C, which is advantageous to the stability control of hardenability.
Under the current Ti content for 20CrMnTi gear steel, Ti is easy to combine with N and form coarse TiN inclusions during solidification. The size, quantity and distribution of TiN inclusion have obvious influence on the performance of the steel,4,5) especially TiN inclusions with large size has a great adverse effect on the fatigue and impact performance of steel.6,7) So it is important to reduce the size of the TiN inclusions and make their distribution more uniform in steel. A number of researchers8,9,10,11,12,13,14) have studied the precipitation and growth of TiN inclusion by experiments or model calculation, but these studies are mostly about TiN inclusions in casting billet or rolled material. The research about TiN inclusions in the end quenching specimen is rare, which is important to identify the characteristics of TiN inclusions in steel after rolling and heat treatment.
A number of studies found that TiN can grow on the surface of the oxide and form oxide-core complex TiN inclusions. Some researchers15,16,17) found that single MgO and Al2O3 can be acted as nucleation core of TiN inclusions, and some researchers18,19) found that MgAl2O4 can be the nucleation core of TiN inclusions. Fujimura et al.20) clarified that Mg–Al–Ti–O oxide can be the nucleation core of TiN inclusions. Hou et al.21,22,23) found “Ti2O3+TiN” structure of complex inclusions, and clarified the core Mg–Al–Ti–O oxide of complex TiN inclusion is MgAl2O4–TiOx oxide in fact. These studies mainly about complex TiN inclusions in stainless steel with over 0.1%Ti, and the research about complex TiN inclusions in steel with Ti content below 0.1% is rare. In addition, the study about the relationship of size and composition between core oxide and complex TiN inclusions is also rare.
In this paper, based on the two end quenching specimens of 20CrMnTi steel with different components, the characteristics of complex TiN inclusions and oxides were compared and analyzed, and the formation mechanism of complex TiN inclusions was discussed. The study aims at helping researchers have a new understanding about heterogeneous nucleation of TiN inclusions.
The experimental materials used in this study are two hardenability test samples of 20CrMnTiH finished steel from an industrial enterprise, whose production process was as follows: Electric Arc Furnace (EAF)—Ladle Furnace (LF)—Vacuum Degassing (VD)—Continuous Casting (CC)—Rolling—Normalizing—Quenching. The samples were taken from rolled bars with the diameter of 60 mm, then normalizing at 920°C and quenching at 880°C. The overall appearance and cross section of samples are as shown in Fig. 1. Two comparative samples with different components were selected for present study, named A and B, respectively.

Sketch of end-quench sample. (a) Overall appearance, (b) Cross section.
The average compositions of the samples were tested by ARL8860 direct reading spectrometer and chemical analysis method, and the test results are shown in Table 1. The mass fraction of total Al in A and B is 0.02% and 0.036%, respectively. And the mass fraction of Ca in A and B is 7 ppm and 5 ppm, respectively. For A sample, Al and Ca both acts as deoxidizing agents owing to lower Al content and higher Ca content compared to B sample. For B sample, Al acts as the main deoxidizing agent owing to higher Al content. In this study, the deoxidation modes in two sample are determined through Al, Ca content and characteristics of the oxides described in Part 3.2. In addition, the mass fraction of Ti in A and B is 0.046% and 0.063%, respectively.
| C | Mn | Si | S | Cr | Ti | N | Als | Alt | Ca | Mg | O | |
|---|---|---|---|---|---|---|---|---|---|---|---|---|
| A | 0.25 | 0.90 | 0.32 | 0.004 | 1.25 | 0.046 | 0.0045 | 0.019 | 0.020 | 0.0007 | 0.0004 | 0.0012 |
| B | 0.21 | 0.90 | 0.28 | 0.003 | 1.23 | 0.063 | 0.0052 | 0.033 | 0.036 | 0.0005 | 0.0003 | 0.0012 |
The complex TiN inclusions and oxides in two samples were observed and analyzed using FEI Quanta MLA250 scanning electron microscopy (SEM) equipped with energy-dispersive X-ray spectroscopy (EDS). When complex TiN inclusions in two samples were analyzed using SEM-EDS, the compositions of wrapped TiN and core oxides were measured separately. The sizes and areas of complex TiN inclusions were measured using Image-Pro Plus 6.0 software. In this study, over one hundred complex TiN inclusions were observed and analyzed in A or B sample. Next, the INCA inclusions automatic analysis system was used to analyze characteristics of inclusions within a certain area in two samples. The scanning area covered an area of 5 mm × 5 mm, and the minimum size of scanned inclusions was set as 0.5 μm. Then, an inclusion growth model was established to calculate the sizes of complex TiN inclusions with different sizes of core oxides, in order to study the relationship between them. Finally, the commercial thermodynamic calculation software FactSage 8.0 was used to analyze the formation mechanism of complex TiN inclusions in A and B samples.
Figure 2 shows the typical morphologies of complex TiN inclusions in A and B sample. The core (black area in Fig. 2) of complex inclusions were oxide inclusions, and were surrounded by the TiN phase. In the study, the complex TiN inclusions were divided into two types, Type 1 and Type 2, based on the compositions of core oxides.

Typical morphologies of complex TiN inclusions. (a)(c) A sample, (b)(d) B sample. (Online version in color.)
The specific compositions of core oxides were identified using EDS, then these data were plotted in MgO–Al2O3–TiOx ternary phase diagram, and the result is shown in Fig. 3. The MgO–Al2O3–TiOx phase diagram was calculated under an oxygen partial pressure of 10−14 Pa at 1600°C using thermodynamic calculation software. It is found that the composition points of core oxides are regularly distributed in the MgAl2O4–TiOx composition line, which means these core oxides are mainly MgAl2O4–TiOx oxides, and the difference is the content of TiOx. For Type 1, the compositions of core oxides are mainly distributed in L+Tisp phase region, while for Type 2, the compositions of core oxides are distributed in liquid oxide phase region. For Type 1, the TiOx content of core oxides are below 52%, while for Type 2, the TiOx content are over 52%. The finding is consistent with the research results of Hou et al.,23) and in our study we found few “TiOx+TiN” structure of complex inclusions because of lower Ti content in steel. Here, whether it is located in the liquid oxide phase region is the main classification criterion, and the 52% TiOx content was chosen as a dividing line based on the reason. In addition, it is found some compositions of core oxides in A sample are deviated from the MgAl2O4–TiOx composition line and close to Al2O3–TiOx axis line. According to the energy spectrum, it is found that there is a little Ca element in these core oxides and MgO content decreases compared to normal MgAl2O4–TiOx oxide. It is deduced that the Ca element reduces MgO in the oxide, which also indicates Ca element plays a role to deoxidize in A sample.

The compositions of core oxides of complex TiN inclusions (Annotation: Tisp. means MgAl2O4–TiOx oxide, Sp. means MgAl2O4 oxide, Liquid means liquid TiOx-enriched Mg–Al–Ti–O oxide, TiOx means Ti-containing oxide). (Online version in color.)
It needs to be noticed that when compositions of core oxides are measured, the EDS signal may contain additional signals from wrapping TiN inclusions. Then smaller core oxide may contain larger Ti content, which will mislead to larger TiOx content of the core oxide. Considering there is N element in EDS analysis result of core oxide, it may be a useful method that using Ti content minus N content as final Ti content of core oxide. However, some N atoms can dissolve in Ti-containing oxide,21,24,25,26) so it is difficult to determine how much N content in core oxide coming from wrapping TiN inclusion. In addition, the measured result of N content in core oxide may have bigger error because N is ultra-light element. So, the method of using Ti content minus N content as final Ti content of core oxide is not reliable. Considering these reasons and to simplify the statistical process, the N content in core oxide is not considered and the Ti detected is fully identified as Ti content of core oxide in this study. We believe the composition of core oxide can be accurately measured using more advanced and sophisticated equipment in future.
The size distribution of complex TiN inclusions are shown in Fig. 4. For Type 1, the sizes distributed in 1–4 μm account for 72%, while for Type 2, the sizes distributed in 1–4 μm account for 61%. The number percentage of over 5.5 μm for sizes of Type 2 is 12%, while for Type 1 that is only 2%. The mean sizes of Type 1 and Type 2 are 3.4 μm and 3.8 μm, respectively. The standard deviations of Type 1 and Type 2 are 0.9 μm and 1.2 μm, respectively. That means the overall size of Type 2 is a little bigger than Type 1.

The size distribution of complex TiN inclusions.
The size distribution of core oxides for Type 1 and Type 2 TiN inclusions are shown in Fig. 5. For Type 2, the core oxide sizes distributed in 0.5–1.5 μm account for 87%, while for Type 1, the sizes distributed in 0.5–1.5 μm account for 40%. The number percentage of over 1.5 μm for core oxide sizes of Type 1 is 60%, while for Type 2 that is only 13%. The mean sizes of core oxides for Type 1 and Type 2 are 1.7 μm and 1.0 μm, and the standard deviations of them are 0.6 μm and 0.4 μm, respectively. That means most of core sizes of Type 2 is smaller than Type 1. It is found that the overall size of core oxide for Type 2 is smaller than Type 1, but the overall size of complex TiN inclusions for Type 2 is bigger than Type 1.

The size distribution of core oxides.
The relationship between core oxide size and TiOx content is shown in Fig. 6. In order to better compare the characteristics of Type 1 and Type 2, the main distribution areas of the points are drawn in the figures, the average values and standard deviations of different parameters are calculated and drawn in the figures. It is found that for Type 1, the average TiOx content is 30%, and for Type 2, the average TiOx content is 65%. The TiOx content of Type 1 inclusions are lower and their overall size is bigger, while the TiOx content of Type 2 inclusions are higher and their overall size is smaller.

Relationship between core oxide size and TiOx content. (Online version in color.)
The proportion of complex TiN inclusions in A and B sample is shown in Fig. 7. There are 33.3% Type 1 and 66.7% Type 2 of TiN complex inclusions in A sample, while in B sample, the proportion of Type 1 and Type 2 is 79.2% and 20.8%, respectively. That means the main type of complex TiN inclusions for A sample is Type 2, and it is Type 1 for B sample. Furthermore, the characteristics of oxides in A and B samples were analyzed.

The proportion of complex TiN inclusions in A and B sample.
The morphologies and compositions of oxides are shown in Fig. 8. It is found that the oxides are mainly Ca–Mg–Al–O oxides in A sample, which further proves Al and Ca both acts as deoxidizing agents. While in B sample, main type of oxides is Ti-containing MgAl2O4 oxide, which further indicates Al acts as main deoxidizing agent. In addition, the sizes of Ti-containing MgAl2O4 of B sample are all in the range of core oxide sizes.
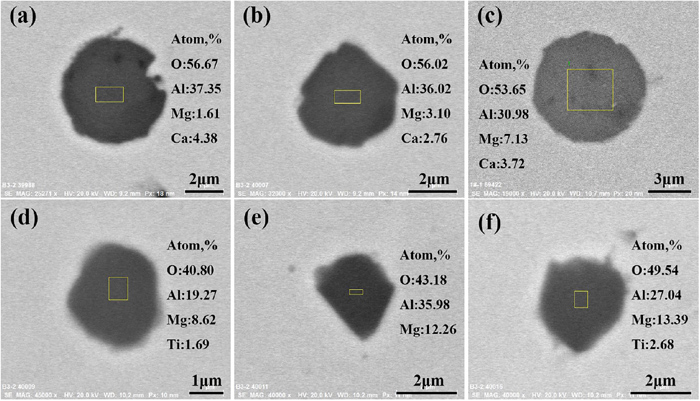
The morphologies and compositions of oxides. (a)–(c). A sample, (d)–(f) B sample. (Online version in color.)
The composition distribution of oxides for A and B sample in MgO–Al2O3–Ti3O5 and CaO–MgO–Al2O3 phase diagram are shown in Fig. 9. It is found that in MgO–Al2O3–Ti3O5 phase diagram, the compositions of oxides in B sample are almost all on the MgAl2O4–TiOx composition line, while the composition of oxides in A sample are close to the corner of Al2O3. In CaO–MgO–Al2O3 phase diagram, the compositions of oxides in B sample are all close to the MgAl2O4 composition point, while the compositions of oxides in A sample are close to CaO–Al2O3 composition line. That means the oxides in A and B sample are mainly Ca–Mg–Al–O and MgAl2O4–TiOx, respectively.

The composition distribution of oxides in (a) MgO–Al2O3–Ti3O5 phase diagram, (b) CaO–MgO–Al2O3 phase diagram. (Online version in color.)
In this part, the sizes of complex TiN inclusions in oxides with different size were calculated using traditional inclusion growth model, in order to study the relationship between complex TiN inclusion size and core oxide size. During solidification, the formation reaction of TiN and its Gibbs energy is shown in Eqs. (1) and (2).11)
| (1) |
| (2) |
The activity coefficients of Ti and N are calculated using Eqs. (3), (4), (5).13) The activity interaction coefficients of Ti and N with other elements are shown in Table 2.
| (3) |
| (4) |
| (5) |
| C | Si | Mn | P | S | Cr | Al | Ti | N | |
|---|---|---|---|---|---|---|---|---|---|
| Ti | −0.165 | 0.05 | 0.0043 | −0.0064 | −0.11 | 0.055 | 0.004 | 0.013 | −1.8 |
| N | 0.13 | 0.047 | −0.021 | 0.045 | 0.007 | −0.047 | −0.028 | −0.53 | 0 |
The temperature of the solidification interface,27) liquidus and solidus temperature are calculated using Eqs. (6), (7), (8). The solution parameters of liquidus and solidus temperature are shown in Table 3.
| (6) |
| (7) |
| (8) |
| C | Si | Mn | Cr | P | S | Ti | Al | N | O | |
|---|---|---|---|---|---|---|---|---|---|---|
| mL,j | 90 | 6.2 | 1.7 | 1.8 | 28 | 40 | 2.9 | 3 | 90 | 80 |
| mS,j | 415.3 | 12.3 | 6.8 | 1.4 | 124.5 | 183.9 | 4.3 | 4.1 | 0 | 160 |
Where,
The segregation concentration of Ti and N can be calculated using Eqs. (9) and (10).13) The equilibrium partition coefficients, liquid and solid phase diffusion coefficients of Ti and N are shown in Table 4.
| (9) |
| (10) |
| kj | DS/(cm2/s) | DL/(cm2/s) | |
|---|---|---|---|
| Ti | 0.33 | 0.15*exp(−250956/RT) | 3.1 × 10⁻³*exp(−11500/RT) |
| N | 0.48 | 0.91*exp(−168490/RT) | 3.25 × 10⁻³*exp(−11500/RT) |
Where,
The growth of TiN during solidification can be calculated by Eqs. (11), (12), (13).28,29) The Eq. (13) means the mass balance during growth.
| (11) |
| (12) |
| (13) |
Where, r(t) means radius of TiN inclusions at time t, r0 means the radius of the core oxide, MTiN and MFe mean the molar mass of TiN and molten steel, ρTiN and ρFe mean the density of TiN and molten steel, DL,[N] means the diffusion coefficient of N in the liquid phase, Ceq,[N] means the mass fraction of N in equilibrium with TiN, τ means local solidification time, Rc means the cooling rate, which equals to 1 K/s in this calculation, L means the radius of unit molten steel sphere around a single TiN inclusion, which can be calculated using Eqs. (14), (15), (16).28,29)
| (14) |
| (15) |
| (16) |
Where, Nυ means the numbers of TiN inclusions per unit volume of steel, NA means the numbers of TiN inclusions per unit area, di means the diameter of every TiN inclusion, d* means harmonic mean value of diameter of TiN inclusion. In this study, according to the results of INCA inclusions automatic analysis system, the numbers of TiN inclusions per unit volume of steel are 1.33 × 104 mm−3 and 3.15 × 104 mm−3, respectively.
The relationship between complex TiN inclusion size and core oxide size for Type 1 and Type 2 inclusions is shown in Fig. 10. The minimum size shown in the Fig. 10 is the case which there is no TiN phase, and the maximum size is the calculated size after full solidification in model. It is found that the sizes of complex TiN inclusions increase with the sizes of core oxides. For Type 1, the sizes of complex TiN inclusions and core oxides are mostly in the range of calculated result, and the relationship between them is close to calculated result. For Type 2, most of complex TiN inclusion sizes exceeds the range of calculated result, and it requires further analysis.

Relationship between complex TiN inclusion size and core oxide size. (Online version in color.)
In the study, the ratio of area of wrapped TiN inclusion and core oxide is defined as nucleation capability of core oxide, according to the study of Lu.30) The schematic diagram of area measurement for complex TiN inclusions is shown in the Fig. 11. The equation of nucleation capability is defined as Eq. (17).
| (17) |

Schematic diagram of area measurement for complex TiN inclusions.
The relationship between area of wrapped TiN and core oxide size is shown in Fig. 12. It is found that for Type 1 inclusions, areas of wrapped TiN are mainly 1–15 μm2, while for Type 2 inclusions, areas of wrapped TiN are in the range of 1–30 μm2. The average values of wrapped TiN area for Type 1 and Type 2 are 7 μm2 and 14 μm2, respectively. The wrapped TiN areas of Type 2 are twice as large as that of Type 1. This result indicates Type 2 has a stronger ability to grow TiN phase in the periphery.

Relationship between area of wrapped TiN and core oxide size. (Online version in color.)
The relationship between nucleation capability and core oxides size is shown in Fig. 13. The nucleation capabilities for core oxides of Type 1 and Type 2 are 4 and 18, respectively. The core oxides of Type 2 show higher nucleation capability than oxides of Type 1. In addition, it is found that the nucleation capabilities of core oxides decrease with their sizes increase.

Relationship between nucleation capability and core oxide size. (Online version in color.)
The relationship between nucleation capability and TiOx content is shown in Fig. 14. The nucleation capabilities of core oxides increase with their TiOx content. The core oxides of Type 1 have lower TiOx content and lower nucleation capability, while the core oxides of Type 2 have higher TiOx content and higher nucleation capability.

Relationship between nucleation capability and TiOx content of core oxide. (Online version in color.)
In the previous statement, it is found the oxides in A and B sample are mainly Ca–Mg–Al–O and MgAl2O4–TiOx, respectively, and the core oxides of complex TiN inclusions are mainly MgAl2O4–TiOx oxides. For B sample, these existed MgAl2O4–TiOx oxides can be the heterogeneous nucleation core of TiN inclusions during solidification process. But for A sample, these Ca–Mg–Al–O oxides cannot be the nucleation core of TiN inclusions. The formation mechanism of MgAl2O4–TiOx core oxide in A sample needs further analysis.
Thermodynamic calculation software with the FactPS, FToxid and FSstel databases was used to calculate the equilibrium precipitation process of inclusions in A and B sample. The composition we used is shown in Table 1, and the main phases in calculated results are shown in Fig. 15. The results indicate that TiN inclusions begin to precipitate at 1475°C during solidification, whether for A or B sample. Before the precipitation of TiN inclusions, the oxides in A sample are mainly CaTiO3 and liquid oxide containing a variety of components, while in B sample, the oxides are mainly CaTiO3 and MgAl2O4–TiOx. The CaTiO3 phase gradually decreases and finally disappear during solidification. Through Figs. 15(c) and 15(d), it is found that the liquid oxide was enriched in TiOx content, and TiOx content in liquid oxide of A are higher than that of B. On the one hand, for B sample, the results of thermodynamic calculation are consistent with results analyzed by SEM-EDS. On the other hand, for A sample, we initially considered that the TiOx-enriched liquid oxide can be the heterogeneous nucleation core of TiN inclusions during solidification. But the formation mechanism of liquid oxide requires further analysis.

Thermodynamic calculation of oxides and TiN inclusions in A and B samples. (a) A, (b) B, (c) the composition of liquid oxide in A, (d) the composition of liquid oxide in B. (Online version in color.)
The study of Park31) indicates that with the increase of Al content in steel, the composition of spinel phase was changed continuously from Mg–Ti–O to MgAl2O4. That can explain the oxides in B sample are mainly MgAl2O4–TiOx because of higher Al content in our study. According to the study of Ren,32) the TiOx content in Mg–Al–Ti–O oxide increases with Ti content in steel, and Mg–Al–Ti–O oxides with high TiOx content become liquid at 1600°C finally. The Ti content of B sample is higher than that of A sample, but the TiOx content of core oxides in B samples is lower than A samples. For A sample, Ca element also acted as a deoxidizing agent owing to lower Al content. According to the results of Zhang,33) a higher calcium treatment level more easily modifies inclusions into liquid oxides in low Ti content steel. So, we thought Ca content affected the formation of MgAl2O4–TiOx oxide in the study.
Furthermore, the effect of Ca content on the MgAl2O4–TiOx oxide was analyzed. Thermodynamic calculation software was used to calculate the formation of inclusions in equilibrium precipitation process under different Ca content. The FactPS, FToxid and FSstel databases were chosen, and the calculated system was 0.23C-1.2Cr-0.05Ti-0.03Al-0.0004Mg-0.0012O-0.005N-Fe (mass%). The main phases of calculated results are shown in Fig. 16. According to Fig. 16(a), under the condition without Ca, MgAl2O4–TiOx oxides will translate into MgAl2O4 oxides spontaneously during solidification. With Ca content increases, the existing temperature region of MgAl2O4–TiOx oxides is moving into the lower temperature zone. At high temperature zone before full solidification of molten steel, MgAl2O4–TiOx oxides gradually decrease, and liquid oxides increase with Ca content increases.

Effect of Ca content on the formation of MgAl2O4–TiOx oxide. (a) Ca=0 ppm, (b) Ca=2 ppm, (c) Ca=4 ppm, (d) Ca=6 ppm. (Online version in color.)
Under the condition with 2 ppm and 4 ppm Ca, MgAl2O4–TiOx oxides stably exist during solidification and can be the nucleation core of TiN inclusions. This is the situation occurred in B sample, and the MgAl2O4–TiOx oxides preexisting in molten steel are the heterogeneous nucleation cores of TiN inclusions during solidification. This is the formation mechanism of Type 1 complex TiN inclusions. Under 6 ppm Ca content, the formation of MgAl2O4–TiOx oxides is suppressed during solidification, while TiOx-enriched liquid oxides increase with temperature decrease. In the precipitation process of TiOx-enriched liquid oxides, new TiOx-enriched MgAl2O4–TiOx oxides begin to form and become the heterogeneous nucleation cores of TiN inclusions. Owing to local solidification rate is fast, these newly formed MgAl2O4–TiOx oxides have no time to grow up, so their sizes are tiny. And because of high TiOx content, this tiny MgAl2O4–TiOx oxides have higher nucleation capability. This is the formation mechanism of Type 2 complex TiN inclusions. In addition, there is some difference between composition of TiOx-enriched liquid oxide and TiOx-enriched MgAl2O4–TiOx, and it needs further study to identify the formation mechanism of TiOx-enriched MgAl2O4–TiOx oxide during solidification in future.
Through this study, we have deeper understanding about heterogeneous nucleation of TiN inclusions. The formation of oxides has an influence on the formation of complex TiN inclusions. Through controlling characteristics of oxides in 20CrMnTi steel, the characteristics of TiN inclusions can be controlled.
In this paper, based on the two end quenching specimens of 20CrMnTi steel with different components, the characteristics of complex TiN inclusions and oxides were compared and analyzed, and the formation mechanism of complex TiN inclusions was discussed. The conclusions are summarized as follows.
(1) In 20CrMnTi gear steel, the compositions of core oxides are regularly distributed in the MgAl2O4–TiOx composition line for different complex TiN inclusions, and the difference is the TiOx content. These complex TiN inclusions can be divided two types, Type 1 and Type 2, based on the compositions of core oxides. The core oxides of Type 1 have lower TiOx content below 52%, and core oxides of Type 2 have higher TiOx content above 52%.
(2) The overall size of core oxide for Type 2 is smaller than Type 1, but the overall size of Type 2 is a little bigger than Type 1. It is owing to the core oxides of Type 2 show higher nucleation capability than core oxides of Type 1. The average values of wrapped TiN area for Type 1 and Type 2 are 7 μm2 and 14 μm2, respectively. The wrapped TiN areas of Type 2 are twice as large as that of Type 1. The nucleation capabilities for core oxides of Type 1 and Type 2 are 4 and 18, respectively.
(3) The formation of oxides has an influence on the formation of complex TiN inclusions. For Type 1, the MgAl2O4–TiOx oxides preexisting in molten steel are the heterogeneous nucleation cores of TiN inclusions during solidification. For Type 2, the tiny oxides newly formed during solidification are the nucleation cores of TiN inclusions. By controlling the characteristics of oxides in steel, the characteristics of complex TiN inclusions can be controlled.
The authors were grateful for support from the National Natural Science Foundation of China (No. 51874034). The authors also appreciate the Xining Special Steel Co. Ltd. for the technical help.
On behalf of all authors, the corresponding author states that there is no conflict of interest.