Abstract
COURSE50, CO2 Ultimate Reduction System by Innovative technology for cool Earth 50, is the national project for reduction of CO2 emission from steelworks in Japan. Three steel companies and one engineering company join this project supported by NEDO (New Energy and industrial technology Development Organization). The target of COURSE50 is reduction of CO2 emission from steel works over 30%, 20% by CCS (Carbon Capture and Storage) and 10% over by operation of blast furnace. In order to realize the reduction of CO2 emission form blast furnace over 10%, H2 utilization technology has been developing using 12 m3 experimental blast furnace. The experiments have been taking place form 2016. From 2016 to 2017, 10% reduction of CO2 emission achieved by using three methods, gaseous reductant injection from tuyeres, gaseous reductant injection from shaft tuyeres, and high reducibility sinter charging. In order to improve the reduction CO2 emission technology, hydrogen-based gaseous reductants were used form 2018. Five campaigns were taken placed from 2018 to 2020. An unprecedented amount of H2 gas in the world was injected in the experimental blast furnace. As a result, it is clarified that direct reduction rate was fell and H2 reduction rate was raised straightly as amount of H2 input was increased. Also, the reduction rate of CO2 emission was affected by the amount of hydrogen injection. About 16% of CO2 emission was reduced with 359 Nm3/t-HM of H2 injection.
1. Introduction
Global efforts are continuously being made to combat global warming. The Kyoto Protocol1) was an international treaty which was adopted in 1997 and entered into force in 2005. The main goal of the Kyoto Protocol was to control emissions of the main human-emitted greenhouse gases. During the Protocol’s first commitment period, Cool Earth 502) was proposed in 2007 to reduce global CO2 emissions 50% by 2050. Cool Earth 50 was planned to be a framework that would continue towards the goals set forth in the Kyoto Protocols. On November 42016, the new and even more ambitious international framework “Paris Agreement”3) for reducing greenhouse gas emissions after 2020 came into effect. In Japan, it was declared that realization of a carbon-free society that would eliminate greenhouse gas emissions as a whole by 2050 in October 2020, and “Green Growth Strategy Through Achieving Carbon Neutrality in 2050” was presented by METI (Ministry of Economy, Trade and Industry).4) Moreover, it was announced that the greenhouse gas emission reduction target for 2030 would be 46% compared to 2013 at a meeting of Global Warming Prevention Headquarters on April 22, 2021.5)
Because CO2 emissions from iron and steel making sector is one of the biggest part in the world and in Japan,6,7) reduction of it is urgently needed. Various technological developments for global environmental conservation are being carried out8) overseas and in Japan. For example, hydrogen injection into the blast furnace has been testing in Germany.9) In China, 430 m3 blast furnace was built and oxygen injection operation has been testing, and hydrogen injection test also be planed.10,11) In Japan, the oxygen blast furnace has been developing.12,13) Also, HBI charge is announced for reducing CO2 emission from blast furnace.14)
COURSE50,15) CO2 Ultimate Reduction System by Innovative technology for Cool Earth 50, is the national project for reduction of CO2 emission from steelworks in Japan. The project started in 2008fy, the year after Cool Earth 50 proposal. Five Steel making companies and one engineering company in Japan join this project supported by NEDO (New Energy and industrial technology Development Organization). The target of COURSE50 is the reduction of CO2 emission from steel works over 30%, 20% by CCS (CO2 Capture and Storage) and over 10% by operation of blast furnace.16,17) From 2008fy to 2012fy, elementary technologies have been developed (Phase I–STEP 1). From 2013fy to 2017fy, the combination of hydrogen reduction improvement in blast furnace and CCS technology has been developed using 12 m3 experimental blast furnace with CAT30 (CO2 adsorption Test plant 30) (Phase I–STEP 2). As a result, 10% of carbon consumption in blast furnace was achieved. The details of this development are described in previous paper.18,19)
From 2018fy, in order to realize the reduction of CO2 emission form blast furnace over 10%, hydrogen utilization technology has been developing by injecting more amount of H2 containing gaseous reactant into the experimental blast furnace (Phase II-STEP 1).
The effect of hydrogen in the blast furnace atmosphere has been studying.20,21,22,23,24,25,26,27) However, the studies that observed data in the blast furnace with the huge amount of hydrogen injection operation is few. In this paper, the results of campaigns taken placed in 2018fy to 2020fy were reported. The influence of hydrogen containing gaseous reductant injection on blast furnace operation is discussed. Also, the change of temperatures and gas concentration distributions in the experimental blast furnace under the large amount of hydrogen injection operation is discussed.
2. Concept of COURSE50 Blast Furnace
The comparison of ordinary blast furnace with COURSE50 blast furnace is shown in Fig. 1. When the ordinary blast furnace is analyzed, the reduction reaction breakdown in her is 60% of CO reduction, 10% of H2 reduction, and 30% direct reduction.8,28) Though the reduction of Fe2O3 proceeds in the order of Fe2O3 → Fe3O4 → FeO → Fe, 67% of oxygen in the iron oxide is removed by the reduction of FeO. Therefore, the equations and reaction heats in the blast furnace can be discussed simply as Eqs. (1), (2), (3). In addition, reduction (1) and (2) mainly proceed in the temperature range where reaction (3) actively progresses.
|
FeO+CO=Fe+C
O
2
+17 288 kJ/kmol
| (1) |
|
FeO+
H
2
=Fe+
H
2
O-23 834 kJ/kmol
| (2) |
|
FeO+C=Fe+CO-155 011 kJ/kmol
| (3) |
The technique of reduce carbon consumption by 10% in COURSE50 blast furnace is that the replacement of direct reduction in about 10% to H2 reduction by injection of H2 containing gaseous reductant. Though both direct reduction and H2 reduction are endothermic reaction, the endothermic volume of direct reduction is much larger than that of H2 reduction, therefore RAR (Reduction Agent Ratio) can be reduced by the replacement of direct reduction with H2 reduction. As a result, CO2 emission reduction from blast furnace can be achieved.
For example, the comparison of heat balance between ordinary blast furnace and COURSE50 blast furnace that carbon consumption reduces by 10% is shown in Fig. 2. As seen in Fig. 2, the heat for reduction decreases because the direct reduction rate decreases, and the hydrogen redaction rate increases. Thus, carbon consumption can decrease. In addition, the heat for decomposition increases in COURSE50 blast furnace because COG decomposition heat is needed when COG is injected into the blast furnace. Also, the sensible heat of top gas decreases in COURSE50 blast furnace because top gas temperature is allowed to decrease in this case.

To realize the concept of COURSE50 blast furnace, the combination of three methods shown in Fig. 3(a), coke oven gas (COG) injection from tuyeres, gaseous reductant injection from shaft tuyeres, and high reactivity sinter charging, has been examined in Phase I-STEP2.16,17,18,19) In Phase II-STEP1, injection of higher concentration hydrogen containing gaseous reductant from the tuyeres shown in Fig. 3(b) has been confirming.
3. Experiments
3.1. Experimental Blast Furnace17)
The schematic view of 12 m3 experimental blast furnace built in 2016 is shown in Fig. 4. She is a bell-less type blast furnace with one tap hole and three tuyeres. There is one double pipe in each tuyere for injecting PC and gaseous reductant. sinter, lumpy ore, auxiliary materials for controlling slag component, and lump coke, which are discharged form raw material hoppers, are transferred to the top of her by a conveyor belt, then they are charged layer by layer by a distribution chute like actual blast furnaces. About 1273 K blast and oxygen is blown from the hot stove through the tuyeres and about 4 t of molten iron and slag are tapped off every 2 hours. There are three horizontal probes and a vertical one as measuring devices for collecting gases and measuring temperature inside her. Moreover, sinter, lumpy ore, and lump coke in her can be extracted during operation by horizontal probes.
3.2. Experimental Operations
3.2.1. Operation Conditions
The experimental operations conditions are shown in Table 1. These conditions and each CO2 emission reduction results were estimated by 3-dimensional unsteady mathematical model,29,30) which considers the mass balance, energy balance, and momentum balance that correlate with the gases-solids-liquids phase. These conditions were designed so that the pig iron temperature was 1723 K constant, and the productivity was 34 t/d constant. The flame temperature also tried to design 2373 K constant, but slightly fluctuated.
Table 1. Operation conditions simulated by 3-dimensional unsteady mathematical model.
| Conditions | A | B | C | D | E | F | G |
|---|
| COG* (Nm3/h) | 0 | 119 | 0 | 119 | 0 | 0 | 0 |
| H2 (Nm3/h) | 0 | 0 | 143 | 170 | 310 | 360 | 445 |
| Total H2 input (Nm3/t-HM) | 61 | 154 | 159 | 276 | 277 | 304 | 359 |
| Blast volume (Nm3/h) | 1857 | 1188 | 1320 | 904 | 975 | 962 | 336 |
| Blast temp. (K) | 1273 | 1273 | 1273 | 1273 | 1273 | 1273 | 1273 |
| O2 (Nm3/h) | 77 | 182 | 170 | 259 | 229 | 235 | 257 |
| O2 enrichment (%) | 3.1 | 10.5 | 9.0 | 20.0 | 16.8 | 15.0 | 18.5 |
| Flame temperature (K) | 2377 | 2374 | 2367 | 2364 | 2364 | 2371 | 2370 |
| Productivity (t/d) | 34 | 34 | 34 | 34 | 34 | 34 | 34 |
| Reduction rate of C consumption (%) | – | 3.0 | 5.7 | 10.7 | 12.0 | 13.7 | 15.7 |
Condition A was ordinary operation. Condition B and C, and condition D and E were almost the same total amount of H2 input, which means sum of H2 derived from injected gaseous reductant and those derived from coke and pulverized coal. Under condition B, 119 Nm3/h of COG was injected to introduce 154 Nm3/t-HM of H2 into the experimental blast furnace. Meanwhile, 143 Nm3/h of hydrogen gas was injected under condition C in order to introduce 159 Nm3/t-HM of H2 into her. Also, 119 Nm3/h of COG and 143 Nm3/h hydrogen gas mixture was injected under condition D, and 310 Nm3/h hydrogen gas was injected under condition E, in order to introduce about 277 Nm3/t-HM H2 into her. Conditions F and G are both for hydrogen injection. The total amount of H2 input of condition F was 304 Nm3/t-HM, and that of condition G was 359 Nm3/t-HM. The estimated CO2 emission reduction was 15.7% in condition G with 445 Nm3/h hydrogen gas injection.
3.2.2. Operation
The length of one campaign was designed as 32 days. After blowing in, the operation took place under condition A. The temperature of the hearth of the experimental blast furnace gradually increased in first eight days. When the temperature almost stopped rising, the operation was judged to be stable. Then, temperatures and gases concentrations distributions in the experimental blast furnace were measured by the horizontal and vertical probes. Also, the mixture of sinter, lumpy ore, and coke in the experimental blast furnace were extracted by horizontal probes during operations. After that, the operation condition was changed to the next one immediately. In that state, the operation was stabilized in two days, and then the same measurements were taken place. This cycle was repeated four times in one campaign. When all prepared conditions were finished, the experimental blast furnace was shut down and cooled in N2 atmosphere immediately.
3.2.3. Measurement Items
The pig iron temperature and chemical compositions of pig and slag were checked every tap for controlling the experimental blast furnace conditions by adjusting the blast and air volumes and coke ratio. The temperature and gases concentrations distributions in her were measured by the horizontal and vertical probes. Also, the extracted mixtures by horizontal probes were separated into sinter, lumpy ore, and coke, and then the chemical components of each were analyzed.
3.2.4. Evaluation Method for Carbon Consumption Reduction
After the campaign was finished, data of a stable 24 h period in each operation condition were extracted. The mass balances and the heat balances for those periods were calculated and the carbon consumption per ton of pig iron were obtained.
3.2.5. Estimation Method for H2O Distribution in Experimental Blast Furnace
The amount of the produced H2O at each measuring point of the vertical probe was calculated as described below. This calculation stands on these ideas; the total moles of H2 and H2O is the same as the moles of H2 in the bosh gas even if H2 was used for any reactions, the moles of N2 at the measuring point i is the same as that of N2 in the bosh gas because N2 never be used for any reactions in her, and all gas concentrations in cross section of her were assumed to be uniform. At first, flow rates of CO, H2, and N2 in the bosh gas were estimated using flow rates of blast, enriched oxygen, and PC carrier gas, the moisture in the blast, and the chemical assay of coke and PC. Then, the whole gas flow rate at a measuring point i of vertical probe was calculated by N2 concentration of measuring point i and the N2 flow rate in the bosh gas as described in Eq. (4). After that, H2 flow rate at measuring point i could be calculated described as Eq. (5) because H2 concentration at that measuring point and its whole gas flow rate were known. Finally, H2O flow rate could be calculated by subtracting of H2 flow rate at each measuring point from H2 flow rate in the bosh gas.
|
V
i
=
V
N
2
bosh
%
N
2
i
100
| (4) |
|
V
H
2
i
=
V
i
%
H
2
i
100
| (5) |
|
V
H
2
O
i
=
V
H
2
bosh
-
V
H
2
i
| (6) |
where,
i: measuring point,
Vi: whole gas flow rate at
i (Nm
3/h),
V
X
i
,
V
X
bosh
: volume of gas X at measuring point
i, or in the bosh gas (Nm
3/h), %X
i, %X
bosh: concentration of gas X at measuring point
i, or in the bosh gas (%).
4. Experimental Results
4.1. Operation Transitions
An example of the operation transitions is shown in Fig. 5. Although an unprecedented amount of hydrogen gas in the world was injected from the tuyeres, it was possible to continue almost stable operation for 32 days. As shown in Fig. 5, when the total amount of H2 input increased, the rate of H2 indirect reduction increased. Also, the rate of direct reduction was decreased, though the rate of CO indirect reduction was almost constant.
4.2. Effect of H2 Injection on Reduction and CO2 Emission
Figure 6 shows the relationship between the total amount of H2 input with the changes in the ratios of the direct reduction rate, CO indirect reduction rate, and H2 indirect reduction rate. In order to confirm reproducibility, some conditions were taken place several times. As seen in Fig. 6, the reproducibility was extremely high. When the total amount of H2 input was risen, the direct reduction rate was fallen linearly and significantly. It means that the direct reduction had been replaced by the hydrogen reduction as the concept described in chapter 2. On the other hand, CO reduction rate also decreased slightly though it would be kept constant in the concept.

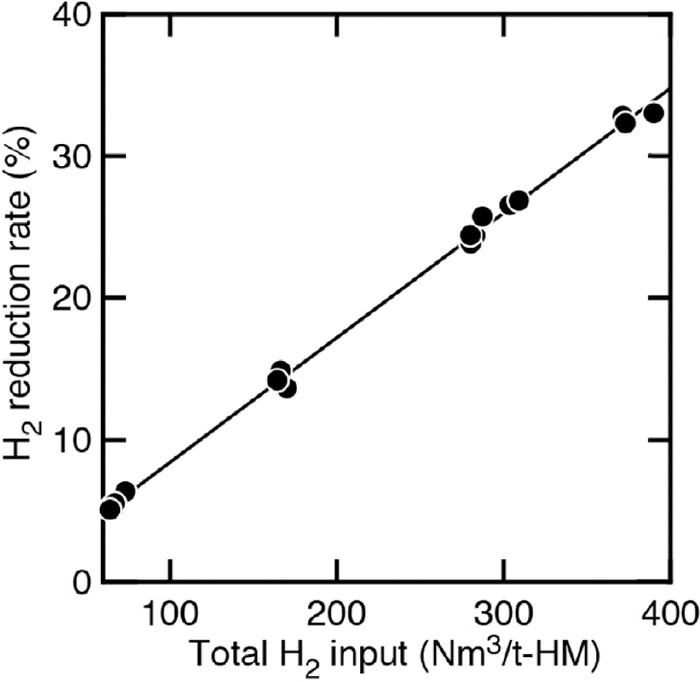
The relationship between the total amount of H2 input and H2 indirect reduction rate is shown in Fig. 7. As shown in this figure, there is a positive correlation between the total amount of H2 input to the blast furnace with H2 indirect reduction rate, and the linearity was better than in Fig. 6. It is believed that the amount of hydrogen reduction will increase as the total amount of H2 input increases.
The relationship between the total amount of H2 input and specific carbon consumption reduction rate is shown in Fig. 8. The simulation results calculated by 3-dimensional unsteady mathematical model were also plotted in it. As shown in this figure, simulation results were good agreement with observed ones. Also, when the total amount of H2 input increases, the specific carbon consumption reduction rate increases linearly. Moreover, when the total amount of H2 input is the same, the specific carbon consumption reduction rate was higher in the order of hydrogen gas injection, mixed gas of hydrogen gas and COG injection, and COG only injection. It is because that the decomposition heat of COG and the increase of O2 enrichment to keep the flame temperature constant affected CO2 emission reduction.31) The increase of O2 enrichment causes the decrease of the blast volume because the productivity is 34 t/d constant, so that the total gas volume blown into the blast furnace decreases and the sensible heat of blown gas decreases. Therefore, the carbon combustion amount in front of the tuyere increases to compensate the decrease of the sensible heat, so that the effect of reducing carbon consumption by H2 containing gaseous reactant injection decreases.

According to Fig. 8, when the total amount of H2 input to the blast furnace was 359 Nm3/t-HM with hydrogen gas injection, the CO2 emissions from the blast furnace could be reduced by about 16% as predicted by 3-dimentional unsteady mathematical model.
4.3. Influence of Hydrogen Gas Injection on Change of Condition in Blast Furnace
The influence of hydrogen gas injection on temperature transitions in the experimental blast furnace is shown in Fig. 9. In this figure, the positions where the temperature was at 627 K and 827 K, and the temperatures at 2 m from the tuyere are also indicated. The double-headed arrows in Fig. 9 indicate where the temperature gradients were very small, and the average temperatures within those areas are shown. In addition, the only hydrogen gas injection conditions are indicated in it because the temperature transitions of COG injection and the mixture of COG and hydrogen gas injection were almost the same as those of hydrogen gas injection when the total amounts of H2 were the same. When the amount of H2 input increased, the temperature in shaft decreased, and the positions of 627 K to 827 K tended to lower and the length between them tended to longer. In particular, under condition G, the temperature from about 5.5 m to 6.5 m from the tuyere became about 338 K, i.e., dew-point temperature. Also, the temperatures at 2 m from the tuyere tended to lower. Moreover, there was one place where the temperature rise was stagnated under condition A, C, E, and F, but under condition G, the temperature rise seemed be stagnant at two places, around 2.5 to 3.5 m and around 5 m from the tuyere, as shown in Fig. 9 v).

The vertical probe can detect only one point in cross section, so 3-dimensional temperature distributions under condition A and G estimated by 3-dimensional unsteady mathematical model were compared in Fig. 10. It can be seen that the temperature drop in the shaft under condition G was also expected in the preliminary simulation.
To deepen the understanding of the data measured by the vertical probe, CO/(CO+CO2) and H2/(H2+H2O) were plotted on the equilibrium diagram and indicated in Fig. 11. In the following description, CO concentration refers to CO/(CO+CO2), and H2 concentration refers to H2/(H2+H2O). Figure 11 i) is the graph of condition A. In this figure, there is a CO concentration range that is almost the same as the Fe–FeO–C equilibrium line between about 1223 K and about 1327 K, where the reaction
is reaches at equilibrium. This is the so-called chemical reserve zone. According to
Fig. 11, the chemical reserve zones in condition C, E, F, G seem 1173–1323 K, 1173–1223 K, 1123–1273 K, and 1073–1223 K individually.
Also, there are temperature ranges that are almost constant though CO concentrations increase. These are the so-called high temperature thermal reserve zones, which correspond to the temperatures in Fig. 9. indicated by the double-headed arrows. In addition, there is a H2 concentration range that is almost the same as the Fe–FeO–H equilibrium line, where the reaction
is reached at equilibrium.
Figure 11 ii) to v) indicate the CO and H2 concentration transitions of condition C, E, F, and G. The following is a comparison of the CO concentration transitions under condition A and other conditions. As the amounts of H2 injection increased, the starting temperatures of the chemical reserve zone tended to decrease and the temperature ranges of them tended to become short as seen in Fig. 11 ii), iii), and v), but the shapes of CO concentration transitions were similar. Also, the higher temperatures of the chemical reserve zone and the temperatures of the thermal reserve zone are almost the same, so that it can be said that the temperatures of the thermal reserve zone have also decreased. By the way, CO and H2 concentration transitions of condition F could only be measured up to 1273 K as seen in Fig. 11 iv). However, the tendency of CO concentration transition seems to be very similar to that of condition E (Fig. 11 iii)), because the chemical reserve zone started around 1200 K and ended at about 1273 K, both were lower than those of condition A. Therefore, the shape of CO concentration of condition F over 1273 K should be similar to that of condition E.
On the other hand, though they were all hydrogen injection conditions, H2 concentration transitions of condition G is slightly different from those of condition C, E, and F. There was a H2 concentration rage that was almost the same as FeO–Fe–H equilibrium line in condition C and E like condition A. The difference between condition A and C or E, was that H2 concentration in condition C and E changed continuously along the FeO–Fe–H equilibrium line above about 1273 K. Unfortunately, the vertical probe became out of order over 1473 K so that the temperature where H2 concentration increased over equilibrium H2 concentration was unknown. In addition, under condition F, H2 concentration transition was similar to that of condition E under 1273 K, so it is believed that the H2 concentration of condition F should change along the FeO–Fe–H equilibrium line above about 1273 K like condition E. However, H2 concentration transition under condition G did not move along the FeO–Fe–H equilibrium line as shown in Fig. 10 v).
In order to understand the influence of the amount of H2 injection on H2 concentration transition on the equilibrium diagram, the equilibrium constant k of water gas shift reaction described as Eq. (12) is calculated by Eq. (11).
|
k=
P
H
2
e
P
C
O
2
e
P
H
2
O
e
P
CO
e
| (11) |
where,
P
X
e
: equilibrium partial pressure of gas X, (X=CO, CO
2, H
2, H
2O)
|
H
2
O+CO=
H
2
+C
O
2
| (12) |
The observed partial pressures of CO, CO2, H2, and H2O are used instead of equilibrium partial pressures of them in Eq. (11) and results are compared with the theoretical value32) in Fig. 12. According to Fig. 12, condition A and G reached equilibrium around 1273 K, but observed k under other conditions were lower than the theoretical data so that Eq. (12) proceeded toward to the right.

In addition, comparison of average reduction rates of sinter which were collected by horizontal probe at 2 m from the tuyere is shown in Fig. 13. The sinters were collected at 5 locations in radial direction, so the average reduction rates are shown in this figure and error bars are added. As shown in this figure, it can be seen that the average reduction rates did not depend on the total amount of H2 input. The highest average reduction rate was under condition E, and its temperature at 2 m from the tuyere was also highest according to Fig. 9. Though the total input H2 increased, the average reduction rates decreased in the order of conditions E, F, and G. The temperatures at 2 m from the tuyere of condition F and G are also lower than that of E shown in Fig. 9. It is believed that the reduction of sinter would stagnate when the total amount of H2 increased due to the delay in temperature rise. The lowest average reduction rate was under condition C, but this reason may be due to the re-oxidation of sample.

5. Discussions
5.1. Water Gas Shift Reaction under the Large Amount of Hydrogen Injection Operation
Itaya22) et al. reported that the water gas shift reaction reached equilibrium in Chiba No. 1 blast furnace according to the observed data measured by the vertical probe. The operation condition in Chiba No. 1 BF is considered to be similar to that of condition A, the water gas shift reaction reached equilibrium in condition A, too. Also, Shigemi28) reported that when the hydrogen concentration in the bosh gas is increased, hydrogen is used for FeO reduction (Eq. (2)) and the water gas reaction, which the Eq. (12) moves left side, and C gasification by CO2 decreases, so that the direct reduction (Eq. (3)) decreases but FeO reduction by CO (Eq. (1)) is kept constant. According to Fig. 6, the results of the experimental blast furnace indicate the same tendency though CO reduction rate slightly decreased. However, according to Fig. 12, Eq. (12) should be moves right side and it is different from Shigemi. The phenomenon observed in the experimental blast furnace is believed like that: When the water gas reaction is promoted and H2O is produced, C gasification by H2O will also be promoted. According to the chemical equations, sum of water gas reaction and C gasification by H2O becomes C gasification by CO2. It means production of CO is promoted. As a result, PCO will increase. PH2O is also high because hydrogen concentration in bosh gas is high so that the reduction of FeO by H2 is promoted, therefore observed equilibrium constant of water gas shift reaction becomes lower than the theoretical one.
5.2. Change of Condition in the Blast Furnace under the Large Amount of Hydrogen Injection Operation
According to Figs. 9, 10, 11, 12, the increase of amount of the hydrogen injection affected the temperature distribution and H2 concentration transition in the blast furnace. Also, the amount of total H2 input seemed to affect whether Fe–FeO–H2 equilibrium area would be formed or not. In other words, when the total amount of H2 increased, the temperature in the blast furnace decreased, so that the reduction speed of the sinter would decrease. Furthermore, when Fe–FeO–H2 equilibrium area formed from 1273 K to 1473 K, the reduction of FeO by H2 did not proceed ostensibly so that the reduction rate of sinter at 2 m from the tuyere could not increase. However, H2 reduction rate in the experimental blast furnace increased linearly with the increase of total amount of H2 input as shown in Fig. 7. It means that the reduction of H2 would be promoted under 2 m from the tuyere. If reduction stagnation occurred due to a delay in temperature rise, the risk of the smelting reduction in the hearth might increase so that the stable operation will be difficult. Kajikawa et al.33) reported similar situation with the low RAR operation; for example, top gas temperature became 346 K, a delay in temperature rises and forming several parts of temperature rise stagnation were observed. They also predicted that the stable operation would be difficult if inadequately reduced sinter due to the delay in reduction was charged into the hearth or if the cohesive zone approached closer to the tuyeres. The same phenomenon may occur if the hydrogen injection increases above 359 Nm3/t-HM into the experimental blast furnace.
In addition, as shown in Fig. 9, the range of 673–873 K became longer as the amount of H2 input increased. Iwanaga34) reported that sinter degradation occurs severely at 673–873 K. Therefore, excessive hydrogen gas injection might cause deterioration of the air permeability of the shaft.
6. Conclusions
The influence of the injection of hydrogen contained reductant gas on CO2 emission form blast furnaces was studied using 12 m3 experimental blast furnace. The obtained results are as follows:
(1) There is a positive correlation between the total amount of H2 input to the blast furnace with H2 indirect reduction rate.
(2) According to the simulation, if the total amount of H2 input to the blast furnace is 359 Nm3/t-HM, the CO2 emissions from the blast furnace can be reduced by about 16%. This result was demonstrated by a 32-day experimental operation using a 12 m3 experimental blast furnace.
(3) It was observed that as the amount of hydrogen injection from the tuyeres increased, the temperature in the experimental blast furnace decreased and the reduction of sinter stagnated. According to these results, it is believed that the hydrogen injection of 359 Nm3/t-HM into the experimental blast furnace may the limitation of stable operation, that is, the limit of keeping the pig iron temperature and productivity constant.
Acknowledgments
We are grateful to NEDO for their support. Our study has been carried out as a national contract research project development of technologies for an environmentally harmonized steelmaking process under COURSE50 commissioned by them.
References
- 1) For example, United Nations Framework Convention on Climate Change: What is the Kyoto Protocol?, https://unfccc.int/kyoto_protocol, (accessed 2022-08-09).
- 2) For example, Ministry of Foreign Affairs of Japan: Invitation to Cool Earth 50 (Summary), https://www.mofa.go.jp/policy/environment/warm/coolearth50/speech0705.html, (accessed 2022-08-09).
- 3) For example, United Nations Framework Convention on Climate Change: The Paris Agreement, https://unfccc.int/process-and-meetings/the-paris-agreement/what-is-the-paris-agreement, (accessed 2022-01-04).
- 4) Ministry of Economy, Trade and Industry: Green Growth Strategy Through Achieving Carbon Neutrality in 2050, https://www.meti.go.jp/press/2020/12/20201225012/20201225012-1.pdf, (accessed 2022-01-11).
- 5) Prime Minister of Japan and His Cabinet: The Prime Minister in Action, https://japan.kantei.go.jp/99_suga/actions/202104/_00026.html, (accessed 2022-05-13).
- 6) H. Ritchie and M. Roser: Our World in Data, https://ourworldindata.org/emissions-by-sector, (accessed 2022-05-13).
- 7) National Institute for Environmental Studies: Greenhouse gas emissions in FY2019 (confirmed figures) <Summary>, https://www.nies.go.jp/whatsnew/jqjm1000000xcmba-att/jqjm1000000xcmy6.pdf, (accessed 2022-05-13).
- 8) T. Ariyama: Tetsu-to-Hagané, 105 (2019), 567 (in Japanese). https://doi.org/10.2355/tetsutohagane.TETSU-2019-008
- 9) thyssenkrupp: Press release, https://www.thyssenkrupp.com/en/newsroom/press-releases/world-first-in-duisburg-as-nrw-economics-minister-pinkwart-launches-tests-at-thyssenkrupp-into-blast-furnace-use-of-hydrogen-17280.html, (accessed 2022-01-04).
- 10) PKU PIONEER: Oxygen Blast Furnace of China’s Steel Mill Achieves 35% Enriched-Oxygen Smelting, https://www.vpsatech.com/Oxygen-Blast-Furnace-of-China-Steel-Mill-Achieves-35-Enriched-Oxygen-Smelting.html, (accessed 2022-10-26).
- 11) W. Zhang, J. Dai, C. Li, X. Yu, Z. Xue and H. Saxén: Steel Res. Int., 92 (2021), 2000326.
- 12) K. Takahashi, T. Nouchi, M. Sato and T. Ariyama: Tetsu-to-Hagané, 102 (2016), 365 (in Japanese).
- 13) Y. Kawashiri, T. Nouchi and H. Matsuno: Tetsu-to-Hagané, 104 (2018), 467 (in Japanese).
- 14) Kobe Steel, Ltd.: KOBELCO Group’s CO2 Reduction Solution for Blast Furnace Ironmaking, https://www.kobelco.co.jp/releases/files/20210216_1_01.pdf, (accessed 2022-01-04).
- 15) The Japan Iron and Steel Federation: COURSE 50, https://www.course50.com/, (accessed 2021-05-07).
- 16) S. Tonomura, K. Araki, K. Hase, Y. Ujisawa, K. Nishioka and N. Ishiwata: 8th Int. Cong. on Science and Technology of Ironmaking (ICSTI 2018), (Vienna), ASMET, Leoben, (2018), 190.
- 17) K. Kakiuchi, Y. Ujisawa, K. Sunahara, S. Tomisaki, H. Demi and M. Sasaki: 8th Int. Cong. on Science and Technology of Ironmaking (ICSTI 2018), (Vienna), ASMET, Leoben, (2018), 182.
- 18) K. Nakano, Y. Ujisawa, K. Kakiuchi, K. Nishioka, K. Sunahara, Y. Matsukura, H. Yokoyama, H. Sakai and R. Sugitani: 8th Int. Cong. on Science and Technology of Ironmaking (ICSTI 2018), (Vienna), ASMET, Leoben, (2018), 217.
- 19) K. Nakano, H. Sakai, Y. Ujisawa, K. Kakiuchi, K. Nishioka, K. Sunahara, Y. Matsukura and H. Yokoyama: ISIJ Int., 62 (2022), 2424.
- 20) K. Wada, K. Kodama and A. Sigemi: Tetsu-to-Hagané, 47 (1961), 1617 (in Japanese). https://doi.org/10.2355/tetsutohagane1955.47.11_1617
- 21) M. Tokuda, H. Yoshikoshi and M. Ohtani: Tetsu-to-Hagané, 56 (1970), 1899 (in Japanese). https://doi.org/10.2355/tetsutohagane1955.56.14_1899
- 22) H. Itaya, T. Fukutake, K. Okabe and T. Nagai: Tetsu-to-Hagané, 62 (1976), 472 (in Japanese). https://doi.org/10.2355/tetsutohagane1955.62.5_472
- 23) M. Ishigaki, R. Takahashi and Y. Takahashi: Bull. Res. Inst. Miner. Dressin. Metall., 38 (1982), 35.
- 24) F. Shen, R. Takahashi and J. Yagi: Tetsu-to-Hagané, 76 (1990), 523 (in Japanese). https://doi.org/10.2355/tetsutohagane1955.76.4_523
- 25) T. Murayama, K. Higashi, K. Imanishi and Y. Ono: Tetsu-to-Hagané, 78 (1992), 998 (in Japanese). https://doi.org/10.2355/tetsutohagane1955.78.7_998
- 26) H. Ono-Nakazato, T. Yonezawa and T. Usui: ISIJ Int., 43 (2003), 1502. https://doi.org/10.2355/isijinternational.43.1502
- 27) Y. Kashiwaya and K. Ishii: ISIJ Int., 59 (2019), 643. https://doi.org/10.2355/isijinternational.ISIJINT-2018-470
- 28) A. Shigemi: Seisen Handbook (Ironmaking Handbook), Chijin Shokan Co., Ltd., Tokyo, (1979), 229 (in Japanese).
- 29) K. Takatani, T. Inada and Y. Ujisawa: ISIJ Int., 39 (1999), 15. https://doi.org/10.2355/isijinternational.39.15
- 30) K. Nishioka, T. Orimoto and H. Sakai: CAMP-ISIJ, 28 (2015), 613, CD-ROM.
- 31) C. Kamijo, Y. Matsukura, H. Yokoyama, K. Sunahara, K. Kakiuchi, K. Nakano and H. Sakai: Nippon Steel Tech. Rep., (2021), No. 417, 22.
- 32) The Japan Institute of Metals and Materials: Lecture: Contemporary Metallography, Process Metallurgy Edition, Vol. 4, Metallurgical Physical Chemistry, The Japan Institute of Metals and Materials, Miyagi, (1985), 65.
- 33) S. Kajikawa, R. Yamamoto, R. Nakajima, S. Kishimoto and T. Fukushima: Tetsu-to-Hagané, 68 (1982), 2361 (in Japanese). https://doi.org/10.2355/tetsutohagane1955.68.15_2361
- 34) Y. Iwanaga: Tetsu-to-Hagané, 68 (1982), 740 (in Japanese). https://doi.org/10.2355/tetsutohagane1955.68.7_740


