Regular Article
Interaction Coefficients of Cu and Sn with Mn in Molten Iron at 1873 K
2022 Volume 62 Issue 12 Pages 2599-2609

Details
2022 Volume 62 Issue 12 Pages 2599-2609
Regarding the depletion of high-grade iron ore and an increase in steel scrap, a new ironmaking process that can utilize both low-grade iron ores and steel scraps is expected. When steel scrap is used as an iron source, tramp elements, such as Cu and Sn, are dissolved in hot metal. The tramp elements can affect the hot metal composition due to the thermodynamic interaction between tramp elements and other alloying elements. However, the thermodynamic interaction between Cu and Sn with Mn has not been known enough. In this work, the interaction coefficients between Cu and Sn with Mn were measured at 1873 K by a chemical equilibration technique using the liquid immiscibility of Fe and Ag as follows:


Moreover, the effects of scrap ratio (iron mass ratio of scrap to scrap and sinter) on hot metal and molten slag composition were thermodynamically analyzed considering the interaction coefficients measured in this work. When the scrap ratio was increased, the copper and tin contents of hot metal were increased, leading to the increase in the Mn content of the hot metal. However, the Mn content of hot metal was decreased by increasing the scrap ratio because the input amount of MnO was reduced.
Reducing CO2 emissions is one of the most critical issues for the Sustainable Development Goals (SDGs). Due to the increasing demand for steel products in developing countries, iron ore consumption has increased. In the developed countries, steel products have been accumulated in the society, and the products are recovered as steel scraps after their service life. Therefore, high-grade iron ore has been depleted,1,2) and steel scrap is increasing. In Japan, 1.39 billion tonnes of steel products have been accumulated in the society until 2018,3) and 26 million tonnes of the steel products, which is 2% of the steel stock, were recovered as steel scraps.4) When the accumulation of steel products proceeds in the future, steel scrap will increase and exceed the crude steel production from natural iron resources by 2050.5) Accordingly, a new ironmaking process is expected to utilize iron ores and steel scraps.6) To achieve carbon neutrality utilizing steel scrap, a concept of a new iron and steel making system was proposed, which is called SMART.7,8,9) In SMART, steel scrap is used as an iron source together with iron ores in the ironmaking process combined with a recycling system of CO2. Packed Bed Type Partial Smelting Reduction Process (PSR)9) is a promising ironmaking process that can utilize iron ores and steel scraps. Figure 1 shows the schematic of PSR. In PSR, iron ores, steel scraps, and coke are charged into a converter-type low-height shaft furnace equipped with tuyeres. Oxygen gas or air is introduced from the tuyeres, and reduction of iron ores and melting of steel scrap are simultaneously performed.9,10) On the other hand, the steel scraps recovered from society contain impurity elements called tramp elements that are difficult to remove from molten iron by the current refining method. Daigo et al.11) reported that Cu, Sn, Ni, and Cr, which are the tramp elements, are often contained in steel scraps and inevitably dissolved in molten iron. Therefore, it is essential to control the thermodynamic activity of the elements, considering the coexistence of tramp elements.12,13,14)

Schematic illustration of a PSR furnace (packed bed type partial smelting reduction process). (Online version in color.)
In the previous report,15) an analysis model was developed to simulate the slag–metal reaction equilibrium considering the impurity elements in the steel scrap. The effects of the scrap ratio (iron mass ratio of scrap to scrap and sinter) on the hot metal and slag compositions were thermodynamically analyzed. Tramp elements in molten iron, which the slag cannot oxidize, will affect the redox equilibrium of other impurity elements due to the thermodynamic interaction between the tramp elements and other impurities. The author has measured interaction coefficients, which indicate the thermodynamic interactions of B, Co, and Ni with Cu12) and of Mo, B, Ni, Ti, and Nb with Sn.13) Tsuchiya et al.16) proposed the discrimination method among conditions at the lower part of the blast furnace by distribution ratios of Si, Mn, and S between slag and hot metal, and Orimoto17) estimated the temperature of the slag at the bottom of the blast furnace from the redox equilibrium of Mn. The redox equilibrium of Mn in the ironmaking process provides valuable information to know the thermal conditions in the furnace. Therefore, the thermodynamic interactions of tramp elements with Mn are essential. However, the interaction coefficients of Cu and Sn with Mn have not been reported. Therefore, those effects were ignored in the previous analysis. In this work, the interaction coefficients of Cu and Sn with Mn were measured at 1873 K. Furthermore, the measured values were applied to the analysis model developed by the authors,15) and the effects of using scrap on the composition of the hot metal and slag were thermodynamically analyzed.
The interaction coefficients between Cu and Sn with Mn were measured at 1873 K by a chemical equilibration technique using the liquid immiscibility of Fe and Ag.18) Fe–Al–Mn alloy and Fe–Mn alloy were prepared from electrolytic iron and Mn regent in advance in a high-frequency induction furnace. The prepared alloys were cut and taken to the equilibrium experiments. The experimental conditions are listed in Table 1. In Table 1, “Sample” and “Initial mass” indicate the alloy used in the experiments and the total mass of the elements in the initial samples, respectively. The total mass of Fe and Ag was 10.0 or 7.0 g. Mn contents were controlled to be 0, 0.1, 0.3, 0.5, 1, 3, or 5 mass% by adjusting the amounts of Fe–Mn–Al alloy, Fe–Mn alloy, and electrolytic iron. The target contents of Cu and Sn were 0, 0.1, 0.3, 0.5, 1, 3, and 5 mass% and 0, 0.1, 0.2, 0.3, 0.4, and 0.5 mass%, respectively. To prevent the Al2O3 crucible from being reduced by Mn and the Mn contents from decreasing, Al was added into the Fe–Mn alloy in the experiments of No. 1–12, 28–47. The Al content of alloy was 0.2 mass%. Furthermore, in the experiments of No. 10–15, 42–50, the activity of MnO was maintained by adding 0.3 to 0.5 g of MnO–Al2O3 mixture so that the Fe phase was saturated with both Al2O3–MnO·Al2O3 phases. The MnO–Al2O3 mixture was prepared in the following procedures; Al2O3 and MnO regent powders were mixed in the ratio of 65mass%Al2O3-35mass%MnO, and the mixture was kept at 1873 K in argon for 24 h using an electric resistance furnace. Figure 2 shows a schematic diagram of the experimental apparatus and arrangement of materials. Three samples, contained in three alumina crucibles (o.d.: 15 mm, i.d.: 12 mm, height: 100 mm), were heated to 1873 K in a mullite tube (o.d.: 70 mm, i.d.: 60 mm, height: 1000 mm) in an electric resistance furnace. A larger alumina crucible (o.d.: 45 mm, i.d.: 38 mm, height: 100 mm) was used as an outer crucible. A carbon holder was placed on the alumina holder as a lid. The alloys and reagents were heated under argon to 1873 K and held for 5 h or 10 h to attain equilibrium. Subsequently, the alloys were withdrawn from the furnace and immediately quenched in water. The samples were carefully cut for chemical analyses. The Mn, Cu, Sn, and Al contents of the Fe and Ag phases were analyzed using Inductively Coupled Plasma Atomic Emission Spectroscopy (ICP-AES).
| No. | M | Sample | MnO·Al2O3 (g) | Initial mass (g) | Experimental results (mass%) | Calculated mass (g) | |||||||||||
|---|---|---|---|---|---|---|---|---|---|---|---|---|---|---|---|---|---|
| Fe phase | Ag phase | ||||||||||||||||
| Ag | Fe | Al | Mn | M | Al | Mn | M | Al | Mn | M | Al | Mn | M | ||||
| 1 | Fe–Mn–Al | – | 10.003 | 9.970 | 0.022 | 0.011 | – | 0.023 | 0.049 | – | 0.003 | 0.060 | – | 0.003 | 0.011 | – | |
| 2 | – | 10.003 | 9.949 | 0.021 | 0.033 | – | 0.026 | 0.147 | – | 0.004 | 0.184 | – | 0.003 | 0.033 | – | ||
| 3 | – | 10.005 | 9.931 | 0.020 | 0.054 | – | 0.025 | 0.247 | – | 0.004 | 0.303 | – | 0.003 | 0.055 | – | ||
| 4 | – | 10.007 | 9.878 | 0.022 | 0.108 | – | 0.028 | 0.475 | – | 0.010 | 0.533 | – | 0.004 | 0.100 | – | ||
| 5 | – | 10.004 | 9.638 | 0.017 | 0.353 | – | 0.002 | 1.476 | – | 0.004 | 1.564 | – | 0.001 | 0.299 | – | ||
| 6 | – | 10.007 | 9.401 | 0.016 | 0.590 | – | 0.002 | 2.552 | – | 0.004 | 2.517 | – | 0.001 | 0.492 | – | ||
| 7 | – | 10.002 | 9.909 | 0.022 | 0.108 | – | 0.029 | 0.460 | – | 0.008 | 0.571 | – | 0.004 | 0.103 | – | ||
| 8 | – | – | 10.004 | 9.757 | 0.027 | 0.358 | – | 0.052 | 1.569 | – | 0.013 | 1.766 | – | 0.006 | 0.330 | – | |
| 9 | – | 10.001 | 9.863 | 0.029 | 0.619 | – | 0.072 | 2.722 | – | 0.014 | 2.880 | – | 0.009 | 0.556 | – | ||
| 10 | 0.299 | 7.001 | 6.868 | 0.014 | 1.001 | – | 0.002 | 5.288 | – | 0.006 | 4.749 | – | 0.001 | 0.696 | – | ||
| 11 | Fe–Mn–Al + Fe | 0.302 | 7.005 | 6.935 | 0.007 | 0.500 | – | 0.001 | 2.478 | – | 0.000 | 2.523 | – | 0.000 | 0.349 | – | |
| 12 | 0.301 | 7.001 | 6.969 | 0.004 | 0.251 | – | 0.001 | 1.221 | – | 0.003 | 1.385 | – | 0.000 | 0.182 | – | ||
| 13 | Fe–Mn + Fe | 0.505 | 7.004 | 9.962 | – | 0.979 | – | 0.002 | 4.540 | – | 0.000 | 4.358 | – | 0.000 | 0.758 | – | |
| 14 | 0.493 | 7.001 | 9.983 | – | 0.457 | – | 0.001 | 1.854 | – | 0.000 | 2.073 | – | 0.000 | 0.330 | – | ||
| 15 | 0.502 | 7.004 | 9.983 | – | 0.131 | – | 0.001 | 0.463 | – | 0.000 | 0.592 | – | 0.000 | 0.088 | – | ||
| 16 | Cu | Fe + Al | – | 7.003 | 7.003 | 0.010 | – | 0.026 | 0.001 | – | 0.109 | 0.000 | – | 0.247 | 0.000 | – | 0.025 |
| 17 | – | 6.998 | 7.003 | 0.010 | – | 0.075 | 0.002 | – | 0.317 | 0.000 | – | 0.708 | 0.000 | – | 0.072 | ||
| 18 | – | 7.005 | 7.006 | 0.010 | – | 0.123 | 0.001 | – | 0.519 | 0.000 | – | 1.161 | 0.000 | – | 0.118 | ||
| 19 | – | 7.003 | 7.006 | 0.009 | – | 0.248 | 0.000 | – | 1.029 | 0.000 | – | 2.362 | 0.000 | – | 0.237 | ||
| 20 | – | 7.003 | 7.006 | 0.009 | – | 0.741 | 0.000 | – | 2.923 | 0.001 | – | 6.958 | 0.000 | – | 0.692 | ||
| 21 | – | 7.005 | 7.003 | 0.010 | – | 1.238 | 0.001 | – | 4.569 | 0.002 | – | 10.946 | 0.000 | – | 1.087 | ||
| 22 | Sn | Fe + Al | – | 7.000 | 6.999 | 0.010 | – | 0.034 | 0.000 | – | 0.050 | 0.000 | – | 0.424 | 0.000 | – | 0.033 |
| 23 | – | 7.001 | 6.997 | 0.010 | – | 0.069 | 0.000 | – | 0.110 | 0.000 | – | 0.826 | 0.000 | – | 0.066 | ||
| 24 | – | 7.002 | 7.001 | 0.010 | – | 0.135 | 0.000 | – | 0.222 | 0.000 | – | 1.589 | 0.000 | – | 0.127 | ||
| 25 | – | 7.002 | 6.999 | 0.011 | – | 0.204 | 0.000 | – | 0.340 | 0.000 | – | 2.435 | 0.000 | – | 0.194 | ||
| 26 | – | 6.997 | 6.998 | 0.010 | – | 0.273 | 0.000 | – | 0.460 | 0.000 | – | 3.260 | 0.000 | – | 0.260 | ||
| 27 | – | 7.004 | 6.996 | 0.010 | – | 0.339 | 0.000 | – | 0.581 | 0.000 | – | 3.820 | 0.000 | – | 0.308 | ||
| 28 | Cu | Fe–Mn–Al | – | 10.003 | 9.973 | 0.022 | 0.011 | 0.139 | 0.018 | 0.047 | 0.422 | 0.003 | 0.060 | 0.907 | 0.002 | 0.011 | 0.133 |
| 29 | – | 10.005 | 9.875 | 0.022 | 0.108 | 0.138 | 0.019 | 0.453 | 0.392 | 0.008 | 0.538 | 0.880 | 0.003 | 0.099 | 0.127 | ||
| 30 | – | 10.000 | 9.636 | 0.017 | 0.353 | 0.138 | 0.002 | 1.427 | 0.380 | 0.004 | 1.569 | 0.881 | 0.001 | 0.294 | 0.125 | ||
| 31 | – | 10.004 | 9.401 | 0.016 | 0.590 | 0.1385 | 0.001 | 2.459 | 0.379 | 0.005 | 2.500 | 0.879 | 0.001 | 0.481 | 0.124 | ||
| 32 | – | 10.000 | 9.967 | 0.022 | 0.011 | 0.352 | 0.024 | 0.046 | 1.043 | 0.005 | 0.058 | 2.387 | 0.003 | 0.010 | 0.343 | ||
| 33 | – | 10.001 | 9.951 | 0.021 | 0.033 | 0.353 | 0.010 | 0.137 | 1.060 | 0.000 | 0.183 | 2.421 | 0.001 | 0.032 | 0.347 | ||
| 34 | – | 10.003 | 9.901 | 0.053 | 0.108 | 0.353 | 0.137 | 0.465 | 0.990 | 0.043 | 0.582 | 2.340 | 0.018 | 0.104 | 0.332 | ||
| 35 | – | 10.005 | 9.654 | 0.048 | 0.354 | 0.352 | 0.113 | 1.547 | 0.984 | 0.032 | 1.817 | 2.279 | 0.014 | 0.331 | 0.323 | ||
| 36 | – | 10.004 | 9.464 | 0.048 | 0.594 | 0.353 | 0.131 | 2.757 | 0.974 | 0.039 | 2.954 | 2.318 | 0.016 | 0.556 | 0.324 | ||
| 37 | – | 10.007 | 9.822 | 0.029 | 0.360 | 0.132 | 0.033 | 1.557 | 0.390 | 0.009 | 1.779 | 0.888 | 0.004 | 0.331 | 0.127 | ||
| 38 | – | 10.004 | 9.794 | 0.029 | 0.615 | 0.132 | 0.006 | 2.556 | 0.359 | 0.000 | 2.715 | 0.893 | 0.001 | 0.522 | 0.124 | ||
| 39 | – | 9.999 | 9.969 | 0.022 | 0.022 | 0.353 | 0.019 | 0.081 | 1.061 | 0.004 | 0.099 | 2.344 | 0.002 | 0.018 | 0.340 | ||
| 40 | – | 10.003 | 9.951 | 0.025 | 0.033 | 0.352 | 0.039 | 0.142 | 1.053 | 0.010 | 0.179 | 2.371 | 0.005 | 0.032 | 0.342 | ||
| 41 | – | 10.002 | 9.930 | 0.029 | 0.054 | 0.353 | 0.049 | 0.233 | 0.995 | 0.011 | 0.303 | 2.368 | 0.006 | 0.053 | 0.336 | ||
| 42 | 0.503 | 10.002 | 9.808 | 0.020 | 1.429 | 0.353 | 0.002 | 5.441 | 0.915 | 0.001 | 5.302 | 2.283 | 0.000 | 1.064 | 0.318 | ||
| 43 | Fe–Mn–Al + Fe | 0.501 | 10.002 | 9.850 | 0.015 | 1.072 | 0.353 | 0.002 | 3.993 | 0.903 | 0.000 | 4.214 | 2.341 | 0.000 | 0.815 | 0.323 | |
| 44 | 0.502 | 10.001 | 9.963 | 0.004 | 0.286 | 0.353 | 0.000 | 0.884 | 0.900 | 0.001 | 1.131 | 2.256 | 0.000 | 0.201 | 0.315 | ||
| 45 | Sn | Fe–Mn–Al | 0.301 | 7.000 | 6.861 | 0.014 | 1.000 | 0.339 | 0.002 | 5.312 | 0.610 | 0.000 | 4.907 | 3.636 | 0.000 | 0.708 | 0.296 |
| 46 | Fe–Mn–Al + Fe | 0.301 | 7.002 | 6.927 | 0.007 | 0.501 | 0.340 | 0.001 | 2.490 | 0.595 | 0.000 | 2.621 | 3.862 | 0.000 | 0.356 | 0.312 | |
| 47 | 0.303 | 7.000 | 6.972 | 0.004 | 0.250 | 0.339 | 0.000 | 1.068 | 0.588 | 0.000 | 1.214 | 3.801 | 0.000 | 0.159 | 0.307 | ||
| 48 | Fe–Mn + Fe | 0.502 | 7.005 | 9.948 | – | 0.978 | 0.339 | 0.002 | 4.269 | 0.582 | 0.000 | 4.088 | 3.577 | 0.000 | 0.711 | 0.309 | |
| 49 | 0.497 | 7.004 | 9.969 | – | 0.456 | 0.339 | 0.001 | 1.922 | 0.581 | 0.000 | 2.058 | 3.461 | 0.000 | 0.336 | 0.300 | ||
| 50 | 0.501 | 7.000 | 9.996 | – | 0.130 | 0.339 | 0.000 | 0.480 | 0.562 | 0.000 | 0.557 | 3.706 | 0.000 | 0.087 | 0.316 | ||

Schematic of the experimental apparatus and arrangement of materials. (Online version in color.)
The experimental results are summarized in Table 1. “Calculated mass” is the total mass of the elements in both Fe and Ag phases after the experiments. It was found that the mass of Al was significantly decreased. In contrast, that of Mn was slightly decreased compared with “Initial mass”, which indicates that the reaction between Mn and alumina crucible was successfully suppressed. Because the Al content of the Ag phase was relatively low, in the range from 0.00 to 0.04 mass%, the effect of Al in the Ag phase was ignored in the following analysis. The partition ratios L of Mn, Cu, and Sn, which were defined as Li = xi (in Ag) / xi (in Fe) (i: Mn, Cu, or Sn), were plotted in Figs. 3, 4, and 5 against xMn (in Fe), xCu (in Fe) and xSn (in Fe), respectively. The terms xi (in Fe) and xi (in Ag) are the mole fraction of element i in Fe and Ag phases, respectively. As shown in Figs. 3, 4, and 5, the partition ratio of Mn, Cu, or Sn deceased with increasing Mn, Cu, or Sn content in the Fe phase, respectively. When an element i in Fe(l) phase is equilibrated with that in Ag(l) phase, the activity relative to pure liquid in Fe(l) phase becomes equal to that in Ag(l) phase. This relationship is expressed as Eq. (1).
| (1) |
| (2) |
| (3) |
| (4) |

Concentration dependence of partition ratio of Mn between Fe(l) and Ag(l) phases at 1873 K.

Concentration dependence of partition ratio of Cu between Fe(l) and Ag(l) phases at 1873 K.

Concentration dependence of partition ratio of Sn between Fe(l) and Ag(l) phases at 1873 K.
The values of the interaction coefficients have been reported as follows: for Mn,
| (5) |
The mutual solubilities in Fe–Ag binary system are reported to be xAg(in Fe) = 0.002 to 0.004 and xFe(in Ag) =0.006 to 0.017 at 1873 K.23) In a previous work by one of the authors in the Fe–Ag–Sn–M (M: Mo, B, Ni) system,14) the solubility of Fe in Ag ranged from 0.002 to 0.017 and that of Ag in Fe from 0.003 to 0.004, which were almost the same values as those in Fe–Ag binary system, indicating that the Sn and M contents had no significant effect on the mutual solubilities in Fe–Ag system. These values are the saturated solubilities of Fe in the Ag phase and Ag in the Fe phase and are not considered to be significantly affected by small amounts of added element, i. Accordingly, in this work, the mole fractions of Fe in the Ag(l) phase (xFe(in Ag)) and Ag in Fe(l) phase (xAg(in Fe)) were assumed to be constant. Then, a linear relationship is expected when the left-hand side of Eq. (5) is plotted against xM(in Ag). The slope and the y-intercept corresponds to

Determination of self-interaction coefficient of Mn in Ag(l) phase.

Determination of self-interaction coefficient of Cu in Ag(l) phase.
Determination of self-interaction coefficient of Sn in Ag(l) phase.
The interaction coefficients of the element j with i in the mass percent coordinates (
| (6) |
In the Fe–Mn–Cu–Al–Ag system, Eq. (4) is expressed as Eqs. (7) and (8) for Mn and Cu, respectively.
| (7) |
| (8) |
When R(Mn) and R(Cu) are defined as Eqs. (9) and (10), respectively, Eqs. (7) and (8) can be rearranged as Eqs. (11) and (12).
| (9) |
| (10) |
| (11) |
| (12) |
Because
| (13) |
| (14) |
Equations (13) and (14) expresses the linear relationship between the left-hand side of those equations and xCu(in Ag)xMn(in Fe)−xMn(in Ag)xCu(in Fe), and the slopes correspond to

Determination of interaction coefficient of Cu with Mn in Fe(l) at 1873 K.

Determination of interaction coefficient of Cu with Mn in Ag(l) at 1873 K.
Similarly, in the Fe–Mn–Sn–Al–Ag system, R(Sn) was defined as Eq. (15), and Eqs. (16) and (17) were derived by replacing Cu with Sn in Eqs. (13) and (14).
| (15) |
| (16) |
| (17) |
Equations (16) and (17) expressed the linear relationship between the left-hand side of those equations and

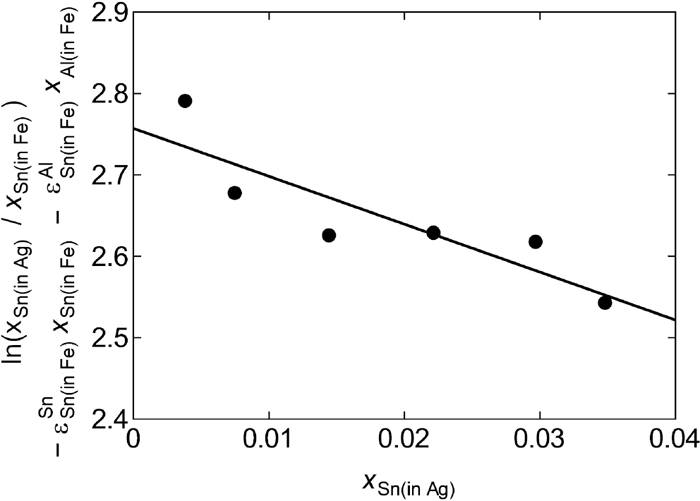
Determination of interaction coefficient of Sn with Mn in Fe(l) at 1873 K.

Determination of interaction coefficient of Sn with Mn in Ag(l) at 1873 K.
The interaction coefficients in the mole fraction coordinates were transformed to those in the mass percent coordinates, using Eq. (6). The derived values are summarized as follows:
On the other hand, Eq. (18) can be derived for Fe-i-j ternary regular solution when the element i is dilute.13,14,24)
| (18) |
The interaction coefficients of Cu and Sn with Mn in molten iron were calculated using Eq. (18) and were compared with the experimental values. The following values of activity coefficients are reported:

Relationship between the measured
Using the analytical model developed in the previous work,15) the effects of scrap ratio on hot metal and molten slag composition were thermodynamically analyzed considering the interaction coefficients
| (19) |
| (20) 19) |
| (21) |
| (22) 19) |
| (23) |
The activity coefficient of i is expressed by Eq. (24) using the interaction coefficients of the element i with j (
| (24) |
From the above equations, Eq. (25) is obtained for the equilibrium concentration of Mn.
| (25) |
By solving Eq. (25), the equilibrium concentration of Mn considering the interaction coefficients of Cu and Sn with Mn can be calculated.
Equations for the equilibrium concentrations of C, O, Si, S, P, and Fe in molten iron were obtained in the same method.15) Furthermore, the mass conservation of Ca, Si, Al, Mg, Mn, Fe, S, P, Cu, Sn, Ni, and Cr were considered. For example, the mass conservation equation of Mn is expressed as Eq. (26).
| (26) |
| (27) |
| 27) | ||
| 27) | ||
| 19) | ||
| 19) | ||
| 19) | ||
| 19) | ||
| 19) | ||
| 19) |
| Thermodynamic data | Reference |
|---|---|
| 29) | |
| 28) | |
| 30) | |
| 32, 33) | |
| 16, 33) | |
| 34) | |
| 35) | |
| 36) |
| i | ||||||||||
|---|---|---|---|---|---|---|---|---|---|---|
| C | 0.000 | 0.000 | 0.029 | −0.003 | 0.036 | 0.030 | 0.006 | 0.010 | 0.004 | −0.005 |
| O | −0.001 | −1750/T +0.76 | −0.070 | −0.021 | −0.141 | 0.074 | −0.014 | −0.012 | 0.006 | −0.058 |
| Si | 0.061 | −0.126 | 0.109 | −0.015 | 0.070 | 0.095 | 0.0152 | 0.017 | 0.005 | −0.0003 |
| Mn | −0.030 | −0.088 | −1838/T +0.964 | 0.000 | −0.049 | −0.057 | −0.017* | −0.009* | −0.008 | 0.0041 |
| S | 0.089 | −0.285 | 0.077 | −0.027 | −120/T +0.018 | 0.036 | −0.009 | −0.005 | 0.000 | −94.2/T +0.04 |
| P | 0.069 | 0.137 | 0.105 | −0.030 | 0.035 | 0.057 | −0.033 | 0.013 | 0.003 | −0.019 |
| Cu | 0.015 | −0.069 | 0.029 | −0.019* | −0.022 | −0.070 | −0.021 | −86.9/T +0.0336 | −0.001413) | 0.019 |
| Sn | 0.243 | −0.116 | 0.059 | −0.024* | −0.029 | 0.037 | −162.4/T +0.0627 | 0.0018 | −0.03014) | 0.016 |
| Ni | 0.003 | 0.011 | 0.006 | −0.008 | −0.004 | 0.002 | −0.000913) | −0.01214) | 0.001 | −0.0003 |
| Cr | −0.037 | −0.1997 | −0.004 | 0.004 | −0.020 | −0.035 | 0.017 | 0.009 | 0.0002 | −0.0003 |
_ : values in carbon saturated Fe(l) (
The raw materials data are needed for the analysis model described in section 3.3.1. The estimated compositions of the sinter, coke, and steel scraps are summarized in Table 5. The composition of the sinter reported by T. Natsui et al.37) was used in the calculation. The composition of coke was estimated from the values in the study of T. Yamamoto et al.10) and the ash composition reported by T. Miyagawa.38) The composition of steel scrap was estimated from the analyzed values of C, Si, S, and P content of low carbon steel.39) In cases 1 and 2, only Cu or Sn was considered a tramp element to study its effect on the equilibrium compositions of slag and hot metal. The concentration of Cu or Sn was varied as 0.1, 0.5, 1, 5, and 10 mass%, respectively. In case 3, the contents of Cu, Sn, Ni, and Cr were estimated from the average concentrations in the steel bar investigated by I. Daigo et al.40) The scrap ratio (SR) was defined by Eq. (28).
| (28) |
| (a) sinter37) (mass%) | |||||||||
|---|---|---|---|---|---|---|---|---|---|
| T. Fe | FeO | CaO | SiO2 | Al2O3 | MgO | MnO | S | PO2.5 | CaO/SiO2 |
| 58.3 | 7.75 | 8.61 | 4.37 | 1.72 | 1.45 | 1.24 | 0.058 | 0.058 | 1.97 |
Firstly, the effect of Cu or Sn content of steel scrap on the partition ratio of Mn between slag and hot metal was discussed. The coke rate, temperature, and scrap rate were 420 kg/t-hot metal, 1773 K, and 0.5, respectively. Effects of Cu and Sn contents of steel scrap on the partition ratio of Mn between slag and hot metal ([mass%Mn] in hot metal/(mass%MnO) in slag) are shown in Figs. 14 and 15, respectively. The Mn partition ratio increased by increasing the contents of both Cu and Sn in the scrap. Because both of the interaction coefficients of Cu and Sn with Mn are negative, Cu and Sn decrease the activity of Mn in hot metal. Therefore, Cu or Sn enrichment in scrap increases the Mn concentration in hot metal because MnO in the slag is more easily reduced. This result indicates that the partial pressure of oxygen estimated from the Mn partition ratio becomes higher than the hot metal excluding Cu and Sn. In addition, because the absolute value of

Effect of Cu content of steel scrap on partition ratio of Mn between slag and hot metal. (Online version in color.)

Effect of Sn content of steel scrap on partition ratio of Mn between slag and hot metal. (Online version in color.)
Secondly, the coke rate was determined to be 420 kg/t-hot metal, and SR was varied from 0 to 0.5 at 0.1 intervals. The effect of SR on hot metal and molten slag composition was analyzed at PO2 ranging from 10−16 to 10−10 atm at 1773 K. Figure 16 shows the effect of SR on the equilibrium concentrations of MnO and Mn in slag and hot metal, respectively. The Mn contents are represented by bold lines along the vertical axis on the left, and those of MnO are represented by thin lines along the vertical axis on the right. As PO2 was increased, Mn content of hot metal was decreased, and MnO content of slag was increased due to the oxidation as can be seen in Fig. 16. When SR is increased, Cu and Sn contents of hot metal increase, leading to the increase in Mn content because the values of the interaction coefficients of Cu with Mn and Sn with Mn are negative. However, the input amount of MnO is decreased with increasing the SR because the Mn content of the sinter is higher than that of steel scrap. Therefore, it was found that the concentrations of both MnO in slag and Mn in hot metal decreased as SR increased.

Effect of scrap ratios on the equilibrium concentration of MnO in slag and Mn in hot metal at PO2 ranging from 10−16 to 10−10 atm at 1773 K. (Online version in color.)
Interaction coefficients of Cu and Sn with Mn were measured at 1873 K by a chemical equilibration technique using the liquid immiscibility of Fe and Ag. Furthermore, the effects of the scrap ratio on the compositions of the hot metal and slag were thermodynamically analyzed, considering the interaction coefficients measured in this work. The conclusions are summarized as follows:
(1) The self-interaction coefficients of Mn, Cu, and Sn in the Ag phase at 1873 K were determined as follows:
(2) The interaction coefficients of Cu and Sn with Mn in Fe(l) and Ag(l) phases at 1873 K were obtained as follows:
(3) When the mass ratio of the scrap in the iron source increases, the Cu content of hot metal increases, leading to the increase in the Mn content because the value of the interaction coefficients of Cu and Sn with Mn is negative. However, the input amount of MnO is decreased with increasing the mass ratio of scrap because the Mn content of the sinter is higher than that of steel scrap. Therefore, it was found that the concentrations of both MnO in slag and Mn in hot metal decreased as the mass ratio of scrap was increased.
This study was supported by JSPS KAKENHI Grant Numbers JP20JI0432 and JP18H03405.