1. Introduction
The importance of steel makes its usage in line as one indicator of social wealth and prosperity.1) The annual steel production has reached 1951 million tons in 2021 and is expected to increase up to 2500 million tons by 2050 to overcome its exponential growing demand.2) Nevertheless, the steel industry directly emits 2.7 gigatons of CO2 per year, contributing 7% of the global anthropogenic CO2 emission that leads to global warming effect.3) Reducing greenhouse gas emissions from the steel industry has become one of the ambitious global challenges since the Paris Agreement 2015.4) One key solution is substituting the fossil-based carbonaceous reducing agent (i.e., cokes or natural gas) for ore-based ironmaking with the renewable carbonless one. It is expected to significantly reduce CO2 emissions in the steel industry since the ironmaking process uses many cokes (i.e., in blast furnace ironmaking system).5)
As one approach, using a clean reduction agent, i.e., hydrogen as a reducing agent, has been considered worldwide to reduce CO2 emissions in the ironmaking process.6,7) In order to utilize hydrogen to substitute fossil fuel, several methods for hydrogen production, storage, and purification have been rapidly developed.7) The water electrolysis to produce hydrogen might be considered as one of the essential methods toward hydrogen energy utilization.8) However, handling pure hydrogen might be challenging since hydrogen transport and storage issues regarding technical safety, durability, and cost performance.9,10) Instead of handling pure hydrogen gas, various hydrogen carriers have also been proposed, such as hydrogen storage alloys, inorganic chemical hydrides, carbon materials, and liquid hydrides.11,12)
Recently, ammonia (NH3) has also been attracting attention to be considered as a hydrogen carrier.13) Ammonia has a hydrogen storage density of 17.8 mass%. It can be easily liquefied at a pressure of 1 MPa at room temperature with a volumetric hydrogen density of 107 kg m−3. Hydrogen gas can be quickly recovered from ammonia decomposition over catalysts such as Ru, Ni, and Fe.14,15,16) Some other studies also proposed to utilize ammonia directly as a fuel through ammonia solid oxide fuel cell (SOFC) and ammonia combustion.17,18)
Ammonia has also been proposed as a reducing agent for hydrogen-based ironmaking process,19) suggesting it can be directly introduced into the iron oxide reduction process. Another benefit is that ammonia reacts with the metallic iron to form iron nitrides, which can inhibit the reoxidation of the reduced iron.20) It might be possible that reduced iron can be transported over long distances with less reoxidation by nitrides formation. A study reported that a significant iron nitride was formed under low reduction temperature or a high ammonia concentration as a reducing agent.21)
On the other hand, the abundant high combined water (CW) iron ore has recently been studied as a raw material for ironmaking. Goethite (FeOOH), the main component of high-CW iron ore, can change to porous hematite (Fe2O3) by low-temperature dehydration (i.e., 250–500°C).22,23,24) This pore generation can be even faster during dehydration under vacuum conditions.25) The generated pores significantly increase the ore reduction reactivity due to the nano-contact between iron oxides and reducing agents.26,27,28) It can also improve catalytic activities of the ore for some fuel decompositions.29,30,31) In particular, goethite ore has a catalytic activity for ammonia decomposition (e.g., NH3 → 1.5H2 + 0.5N2).32,33,34)
The utilization of ammonia as a reducing agent in ironmaking has been studied under reducing hematite reagent by ammonia, reporting the effect of ammonia concentration in reducing gas and showing that the hydrogen flowrate limits the iron reduction degree.21)
However, there are no studies yet using natural iron ore reduced by ammonia. It is expected that a higher reduction rate might be promoted if iron oxides contribute more ammonia decomposition. In this case, high-CW iron ore with a higher surface area after dehydration could be promising as a raw material for reduction by ammonia. In this study, natural iron ores were reduced by ammonia. The effects of different ore types, reduction temperatures, and conditions of post-reduction treatments on the reduction behavior were fundamentally investigated.
3. Results and Discussions
3.1. The Ores Structures and Pore Properties before and after Dehydration
The ore structure before and after dehydration, shown in Fig. 2, as well as the change of their appearances. With high combined water (CW) content, the raw ore A has a yellowish color. The XRD pattern revealed its majority content of goethite. The significant noise and broader XRD peaks of ore A describe that ore A has a significant amorphous structure. Interestingly, after dehydration, ore A shows a significant change in its visual appearance from yellowish to reddish color, and its structure significantly changed from FeOOH to Fe2O3. In contrast, raw ore B has a darker color due to its low CW content. XRD pattern shows that ore B has hematite as its primary component. Its XRD peak was even sharper and narrower than ore A, representing that ore B has good crystalline hematite. It was well reported elsewhere that good crystalline hematite has an overall visual appearance that sometimes has a darker color.35) After dehydration, unlike the dehydrated ore A, ore B did not show significant changes in both appearance and structure due to its low CW content. The XRD patterns confirm that the dehydrated ore B still contains mainly hematite. In addition, ore B contains a form of quartz particles that is randomly present from raw material impurities and not affected to the dehydration process. It is also correlated to Table 1, mentioning ore B has more SiO2 content than ore A.

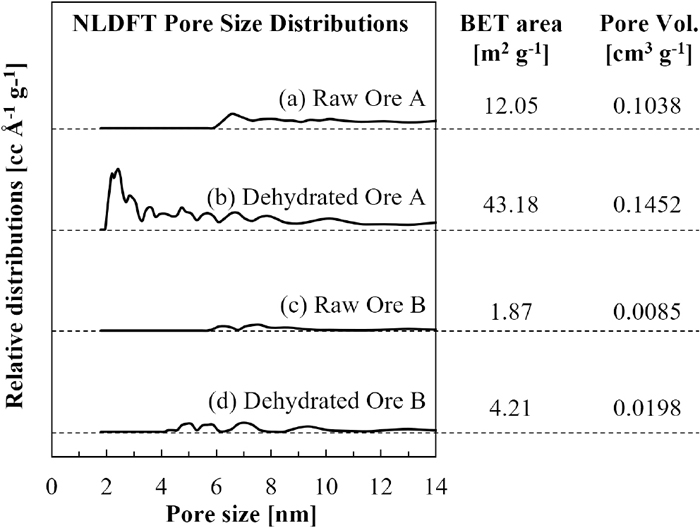
The Brunauer–Emmett–Teller (BET) surface area, total pore volume, and non-linear differential functional theory (NLDFT) pore size distribution of the ore samples before and after dehydration were depicted in Fig. 3. Interestingly, after dehydration, ore A has a more significant BET surface area of 43.18 m2 g−1 than ore B of only 4.21 m2 g−1. The NLDFT pore size distributions show that the increase in the surface area of ore A is due to the generation pore size of 2–4 nm during dehydration. This finding agreed with other reports mentioning that the ore with higher CW could have a higher surface area due to nanopore generation.22,23,24,25)
3.2. Reduction Behaviors of Different Iron Ores
Figure 4(a) shows XRD patterns of ore A and ore B after reduction at 700°C for 10, 20, and 30 min. Fe2O3 was reduced to other oxides (Fe3O4, FeO), metal (Fe), and nitrides (Fe4N, Fe3N). The generated phases were detected only containing iron oxides and nitrides in a short reduction time. Interestingly, with the longer reduction time, the percentage of Fe4N and Fe became more significant. However, the reduced phase’s nitrogen content decreased, meaning that nitrides are decomposed at a more prolonged exposure in a high temperature. Table 2 lists the reduction degrees of each ore, showing that the reduction degrees of ore A were significantly higher than ore B.
Table 2. Reduction degrees of dehydrated ore A and B after reduction under Ar-20%NH
3 at 700°C.
| Reduction time | 10 min | 20 min | 30 min |
|---|
| Ore A | 67% | 96% | 96% |
| Ore B | 51% | 65% | 82% |
To understand its reduction mechanism, an evolved gas analysis was used to measure the gas composition in the tail gas, including H2, NH3, H2O, N2, and Ar. Ammonia is consumed by its decomposition (to generate N2 and H2) and as a direct reducing agent that are shown in Eqs. (1) and (2), respectively.
|
N
H
3(g)
→1/2
N
2(g)
+3/2
H
2(g)
| (1) |
|
1/2 F
e
2
O
3(s)
+N
H
3(g)
→F
e
(s)
+1/2
N
2(g)
+3/2
H
2
O
(g)
| (2) |
Each molecule of NH3 consumed generates two molecules of total product gases containing N2, H2, and H2O. In this case, the ammonia utilization rate (rNH3) was calculated using Eq. (3)
|
r
N
H
3
=
F
N
H
3in
-
F
N
H
3out
F
N
H
3in
×100%
| (3) |
F
N
H
3in
is the initial ammonia flowrate [NmL min−1]. While,
F
N
H
3out
is the outlet ammonia flowrate [NmL min−1], calculated using Eq. (4).
|
F
N
H
3out
=
F
total
out
×
C
N
H
3out
| (4) |
F
tota
l
out
and
C
N
H
3out
are the total flowrate of outlet gas [NmL min−1] and the concentration of NH3 in outlet gas measured using QMS [%], respectively. With the stoichiometric total flowrates of the outlet gas,
F
tota
l
out
=
F
A
r
in
+
F
N
H
3out
+2(
F
NH
3
in
-
F
N
H
3out
)
, and assuming that the amount of nitrogen absorbed in Fe is neglected, Eq. (4) can be reformed into Eq. (5).
|
F
N
H
3out
=
(
F
A
r
in
+2
F
NH
3
in
)×
C
N
H
3out
1+
C
N
H
3out
| (5) |
In this experiment, the flowrates of inert gas (argon),
F
A
r
in
, was set at 160 NmL min−1. While
F
NH
3
in
was 40 NmL min−1. Thus, the outlet ammonia flowrate,
F
N
H
3out
, can be expressed in Eq. (6).
|
F
N
H
3out
=
240×
C
N
H
3out
1+
C
N
H
3out
| (6) |
Figure 5 shows the ammonia utilization rate during reduction at 700°C. The blank curve means the experiment without any ore bed sample (only using quartz wool). There was a slight increase in NH3 utilization rate, implying that the ammonia decomposition proceeded in the reactor without any ores. It could be noticed as a non-catalytic thermal decomposition of ammonia. Significant differences were obviously detected between the blank and the dehydrated ore A and B, revealing that the ores intensively consumed the NH3. Interestingly, in the case of ore A, it decomposed more NH3 than ore B, and the utilization rate reached almost 100%. This significant effect is due to the higher surface area of the dehydrated ore A improving its reactivity as a catalyst, which attributes to the generated pore of 2–4 nm during the ore dehydration.

Figure 6 shows the evolved flow rate of H2 and N2 during the first 5 min of the reduction. Interestingly, in the case of ore A, only N2 was produced initially without any subsequent H2 generation, suggesting that direct reduction by NH3 occurs. The rapid consumption of NH3 at the initial stage of the reaction (seen in Fig. 5) was correlated to this occurrence. Subsequently, NH3 decomposition also started to occur, producing H2 gas to extend the reduction via indirect reduction (FeOx + x H2 → Fe + x H2O), which agrees with other reports.21) In contrast, in the case of ore B, H2 and N2 showed similar increases in the flow rate, which means that no initial direct reduction by NH3 occurs. The ore reduction by NH3 and NH3 decomposition seems to proceed simultaneously. Also, corresponding to the structural change of the reduced ores, it could be suggested that hematite might have a weak catalytic activity for ammonia decomposition. The catalytic activity could be increased along with the iron oxide being reduced to magnetite, wustite, and eventually metallic iron.36) However, kinetic investigation on ammonia decomposition over iron oxides will be left for future study.

With different combined water contents under the same conditions, ores A and B showed significant differences in their reduction behaviors (particularly at the initial stage of reaction), ammonia utilization rates, and reduction rates. These differences are considered due to the significant difference in specific surface area after dehydration. In the initial stage of reduction, it was suggested in a previous study21) that Fe2O3 is first directly reduced by NH3 to Fe3O4. It is considered that the same reaction occurred in this experiment. Dehydrated ore A, which has a larger specific surface area, had a larger amount of iron oxide (i.e., Fe2O3) in direct contact with NH3, promoting the notable direct reduction in the early stage of the reaction. As the reduction proceeds, the ores act as catalysts for NH3 decomposition, and even in this case, dehydrated ore A, which has a larger contact area, reveals a higher NH3 decomposition rate. This finding is due to raw ore A having more CW content than ore B, in which it is reported that the higher CW content generates a porous ore with a higher surface area, which significantly increases the reduction and decomposition reaction kinetic.22,26,27,28,33) As a result, ore A, which produces more H2 as a reducing agent and has a more significant contact area with the reducing gas, showed a more significant reduction degree than ore B.
3.3. Generated Phases Among Temperatures and Times
The ore structures before and after reduction were analyzed using XRD (Miniflex, Rigaku). The reduction degree (RD) and the nitriding degree (ND) of each sample were calculated using Eqs. (7) and (8), respectively.
|
RD=
mass of removed oxygen
mass of removal oxygen
×100%
| (7) |
|
ND=
Fe in nitrides
Total Fe
×100%
| (8) |
and
(8) were calculated based on XRD data with the Whole Powder Pattern Fitting (WPPF) method used for the quantitative analysis. Although the sample contains SiO
2, Al
2O
3, and other oxides, those effects were assumed to be neglected by calculation using only metallic Fe, iron oxides, and iron nitrides. Assuming that all the iron compounds in the ore before reduction were Fe
2O
3,
Eq. (7) can be approached as
Eq. (9).
|
RD=
O
Fe2O3
-
O
Fe
O
Fe2O3
×100%
| (9) |
where
OFe2O3 is the initial number of O atoms per Fe atom in Fe
2O
3 , with its value of 1.5.
OFe is the number of O atoms per Fe atom in the sample after reduction.
OFe is determined by
xi, the Fe atom-based existence ratio of iron compounds
i (
i.e., Fe, FeO
x, FeN
y) in the sample after reduction, and
Oi, the number of O atoms per Fe atom in the iron component,
i, as shown in
Eq. (10). The
Oi values of Fe
2O
3, Fe
3O
4, FeO, Fe and FeN
y are 1.5, 1.33, 1, 0, and 0, respectively.
Figure 7 shows the reduction degree (RD) and the nitriding degree (ND) of dehydrated ore A after reduction at various temperature and time conditions. The RD increases along with the reduction time. Also, the reduction becomes significant faster at elevated temperatures. The ND at 650°C continued to increase with the RD, but at 700°C and 750°C, it eventually decreased. Since the ND is 0% for only oxides, it increases with the generation of nitrides in the early stage of reduction. However, the generated nitrides decompose into Fe at high temperatures, which decreases the ND. The decrease in ND indicates that the nitrides decompose more than they generate by reduction. At 650°C, no metallic Fe was generated in any of the samples, so the ND continued to increase. In contrast, at 700°C and 750°C, Fe was significantly formed, causing a significant decrease in ND during the reduction. These results indicate that the reduction and decomposition of iron nitrides occur more instantly at higher temperatures.

Figure 8(a) shows a cross-sectional SEM image of the dehydrated ore A, reduced at 700°C for 20 min. The oxygen (O) and nitrogen (N) content were measured by EDS line analysis along the cross-sectional surface (AB line) that are shown in Fig. 8(b). It revealed that O increased from outside to inside, which indicates that iron reduction (removal of O) goes from the outside to the inside, and N decreased from the outside to the inside of the ore as nitrides are formed more significantly on the ore surface.

Figure 9(a) shows the phase diagram of Fe–O as a function of temperature and composition ratio of H2 to H2 + H2O. This phase diagrams was prepared using the results of calculations by HSC Chemistry 5.11. Each figure was plotted with the equilibrium states of the reduction reaction for each condition. In Fig. 9(a), all samples have the reduction conditions taking place in the Fe region. However, the actual iron oxides still remain because reduction is not proceeding until inside the ore, as shown in Fig. 8. Figure 9(b) shows the Lehrer diagram of Fe–N as a function of temperature and Nitriding potential, KN, which is given by the following Eq. (11). This diagram is based on pure iron nitriding that has been widely used in industry to specify the nitriding potential for the nitriding process of steels, which includes the region of α-Fe, γ-Fe, γ’-Fe4N1-y, and ε-Fe3N1-y as similar reported elsewhere.37)
|
K
N
=
P
N
H
3
/
P
H
2
3
/
2
| (11) |
Moreover, although nitrides were detected in most of the samples, the gas conditions were actually in the Fe region in Fig. 9(b). This is probably due to the gas concentration is measured on the outlet reactor side. In this case, the KN could be higher at the ore bed zone. Also, as discussed above, most of the NH3 decomposition was carried out by the ores. Therefore, it is suggested that the continuous supply of NH3 can significantly promote NH3 decomposition and the formation of nitrides on the ore surface.
3.4. Effects of Post-reduction Process on the Generated Phases
Figure 10 shows XRD patterns of the dehydrated ore A after reduction at 700°C for 20 min. Each sample has different post-reduction treatments. In case (a), the ore sample was quenched using the reducing gas (Ar-20%NH3) after the reduction was finished. While, in case (b), the sample was quenched under a fast Argon flow (> 4000 mL min−1: fully open). After the temperature fell below 350°C, in both cases (a) and (b), the quenching gas was switched to Ar flow (200 mL min−1) and cooled to room temperature. Case (c) was quenched under Ar flow (200 mL min−1) until room temperature. Meanwhile, in case (d), the gas was switched to Ar flow and then held at 700°C for 1 min before quenching to room temperature. As the results, interestingly, in case (a), the nitrides peaks were more significant, and the metallic Fe peaks were smaller than in (b). This result indicates that Fe, which existed as a metal until room temperature in the Ar flow, was nitrided by the cooling in the gas containing NH3. However, there was a slight difference in the XRD pattern between cases (b) and (c) with the ND were 58.2 and 50.7%, respectively. The difference in the ND between (b) and (c) is considered to be due to the longer time required for cooling in (c) compared to (b). In contrast, in case (d), the nitrides peaks were almost disappeared, and only significant metallic Fe peaks were seen. It indicates that the nitrides decompose quickly when the sample is kept under an ammonia-free atmosphere at a high temperature.

In brief, during quenching (i.e., at temperatures lower than 700°C), the metallic Fe in the sample was nitrided in the presence of NH3. In contrast, the nitrides were easily decomposed into metallic Fe in the absence of NH3 at 700°C. This suggests that the quenching conditions significantly affect the generated phases. Thus, the generated phases of the reduced ore could be easily controlled in the post-reduction process.
This study successfully demonstrated some essential fundamental aspects of the utilization of ammonia as reducing agent in ironmaking. Ammonia-ironmaking could be important toward carbon neutrality in the future. Eventually, it could be a better approach instead of only introducing H2 gas as reducing agent. As a brief comparison, for example, with simply business as usual (BAU) assumption, the ammonia price range was 0.25–0.40 USD kg−1 recently, with the average of 0.30 USD kg−1 (or equivalent to 5.1 USD kmol−1),38) while the hydrogen price (from steam-methane-reforming) was around 6.71 USD kg−1 (or equivalent to 13.42 USD kmol−1). Stoichiometrically, considering that each kmol of NH3 contains 1.5 kmol of H2, it is sufficient to reduce 0.5 kmol of Fe2O3 producing 1 kmol of metallic-Fe. So, the reducing agent cost of NH3 for ironmaking is 5.1 USD kmol-Fe−1 (or equivalent to 91.3 USD ton-Fe−1). This approach could be significantly cheaper than using H2 gas directly, which is 20.13 USD kmol-Fe−1 (or equivalent to 360.42 USD ton-Fe−1). The higher price of H2 is due to its handling and transportation being far more complex than ammonia. However, this critical aspect should be comprehensively analyzed in future studies.
In addition, as another aspect to consider in applying ammonia as reducing agent in ironmaking, momentarily, there was no noticeable corrosion by ammonia detected on experimental apparatus during this fundamental study. However, the corrosion should be carefully investigated in the future.