Abstract
M2052 damping alloy has good shock absorption and noise reduction ability, but the corrosion resistance and wear resistance are insufficient. In this study, a high phosphorus amorphous Ni–P coating with a thickness of about 22.1 µm was successfully deposited on the M2052 substrate by electroless plating. The wear experiments show that the main wear mechanism of Ni–P coating is adhesive wear, while the main wear mechanism of M2052 substrate is abrasive wear and corrosion wear. Compared with M2052 substrate, the electroless plating sample has a lower corrosion current and higher corrosion potential, and the corrosion resistance is greatly improved. In the erosion-corrosion environment, the corrosion rate of the uncoated sample is about 5 times that of the coated sample. However, the damage of Ni–P coating under the same environment corroded slightly, which effectively impedes the erosion of sediment flow and the corrosion of artificial seawater.
1. Introduction
Manganese copper alloy is a kind of twinning type damping material, which has an anti-ferromagnetic transition and phase transition from face center cubic to face center tetragonal (f.c.c-f.c.t),1,2) and has outstanding advantages in high damping capacity and high mechanical strength.3) Its high damping capacity is mainly attributed to the mobility of internal boundaries such as {110} twin boundary and phase boundary.4) Due to its excellent damping capacity and mechanical properties, Mn–Cu damping alloy has been applied in marine propellers in the early years.5) However, its corrosion resistance, like that of other alloys with high damping properties (e.g., Fe–Mn,6) Mg–Zr,7) and Ni–Ti8)), is generally low, so its further application, for example, in ships, exploration, mining equipment, or pipelines, etc. under long-term vibration and corrosion conditions, is limited. Among Mn–Cu base damping alloys, the M2052 (Mn-20Cu-5Ni-2Fe, at.%) alloy developed by Yin et al. is very representative.9) Its temperature stability and damping performance are outstanding, and it has achieved a good balance among damping capacity, strength, and working performance.3,10) Therefore, researchers have extensively studied the microstructure changes, heat treatment process, and damping mechanism of M2052 alloy, and obtained many research results.11,12,13,14) However, due to the poor corrosion resistance, the engineering application of the M2052 alloy has always been restricted. In recent years, many researchers began to pay attention to the study of its corrosion resistance. Alloying Zn,15) Al,16) and other elements to improve the corrosion resistance of M2052 alloy is considered to be a relatively effective method, but as we all know, there is a certain limit to improve the corrosion resistance by alloying elements.
Therefore, the surface project of the materials is another effective and feasible method to improve the corrosion resistance of the material. Due to the fact that many structural or functional materials that work under harsh conditions were coated on their surfaces. Electroless Ni–P plating is a very mature process, which is widely used in the field of marine ship anti-corrosion. It can effectively protect parts and equipment from corrosive media in the marine environment, thereby prolonging the service life of components. In various coating technologies, electroless Ni–P coating has not only significant economic benefits but also has good corrosion resistance, friction resistance, and good adhesion.17,18,19,20,21) For example, electroless plating of Ni–P coating on AZ91D magnesium alloy successfully improved the corrosion resistance of the Mg alloys, which are similar to Mn–Cu alloys in corrosion resistance and have been widely used in various fields.22) Besides, Nitla et al. reported that the damping capacity of A356.2 alloy was improved after nickel plating.23) Therefore, the application of electroless Ni–P coating to M2052 alloy is an interesting issue. However, in the electroless plating process, it is very difficult to obtain a dense coating, and it is easy to form micro-holes and other defects. Once the electrolyte accumulates in the micropores, the chloride ions in the solution can easily penetrate through the micropores into the coating and contact the substrate. In this way, pitting is easily formed, and the coating also loses its protective effect. This failure mode reduces the service life of the coating and increases maintenance costs.24,25,26)
However, there are few studies on electroless Ni–P plating on Mn–Cu base damping alloy, and the studies of related properties characterization and failure mechanism are rare. Therefore, in order to adapt to the coexistence of noise, vibration and corrosion conditions, and provide an idea for the development and application of Mn–Cu based alloy, the M2052 alloy has been subjected to electroless Ni–P plating. For this purpose, the wear and corrosion behavior of the M2052 substrate with and without coating were studied by friction and wear test, electrochemical test, and erosion-corrosion test. The bonding force of Ni–P coating was evaluated by thermal shock test. The quality and roughness of the samples were analyzed by SEM, EDS, XRD, and optical profilometer.
2. Experimental
2.1. Electroless Ni–P Plating
The M2052 manganese-copper damping alloys with a size of 30 mm × 15 mm × 2 mm were used as substrate material, where the chemical composition was 73 at% of Mn, 20 at% of Cu, 5 at% of Ni, and 2 at% of Fe. After polishing with 1000 grit SiC papers, the samples were rinsed with deionized water and acetone, then cleaned in an ultrasonic bath for 10 minutes to remove soils or greases. Next, sensitization and activation treatment were carried out by immersing the samples in specific solution for 15 s at ambient temperature. Due to the existence of Mn, M2052 alloys that exhibit strong corrosion tendency were not suitable to traditional activator such as 10% HCl solution. A mixture of 1% HCl and 99% ethanol was adopted by many explorations of the pretreatment process. In the final step, the M2052 was dipped in an electroless bath to deposit electroless Ni–P coating. Between each process, deionized water was used to clean the sample to remove the residual solution from the previous process. The composition and operating conditions of electroless Ni–P deposition are listed in Table 1. To inhibit the corrosion of Mn–Cu substrate, ammonia was used to control the pH of the bath solution to a weak acid. The substrates without and with Ni–P coating are referred to as uncoated and coated hereinbelow, respectively.
Table 1. Composition and operating conditions of electroless Ni–P plating bath.
| Composition and conditions | Concentration |
|---|
| NiSO4 | 25–30 g/L |
| NaH2PO2·H2O | 25–30 g/L |
| CH3COONa | 15–25 g/L |
| Lactic acid | 5–15 g/L |
| Complexing agent | 4–6 g/L |
| Brightening agent | 1–3 g/L |
| pH | 4.5–5.0 |
| Temperature (°C) | 85 |
| Plating time | 120 min |
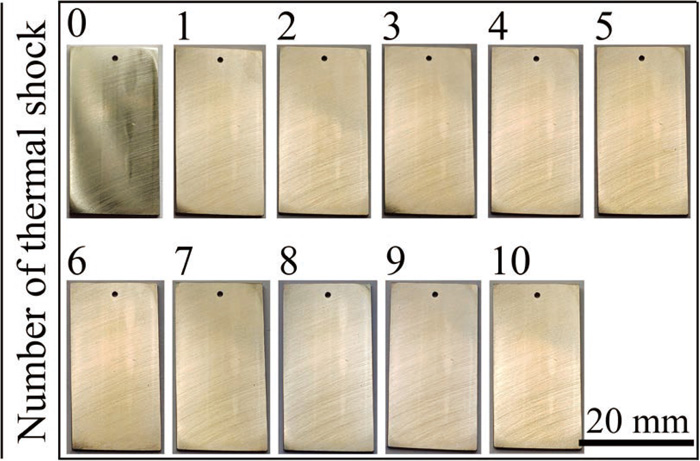
To test adhesion between Ni–P coating and M2052 substrate, thermal shock experiments were carried out. The experiment was conducted according to the conditions in reference.22) That is, the coated sample was held at 250 ± 10°C for 1 hour, then taken out and quenched in cold water. The process was repeated 10 times. After 10 cycles, no blisters, cracks, and shedding were observed on the surface of the coated sample, as shown in Fig. 1. Therefore, the thermal shock experiment indicates that the Ni–P coating has excellent adhesion with the substrate.
2.3. Microhardness and Wear Test
Microhardness was examined by using a Vickers digital microhardness tester (HVS-1000, Shanghai Second Optical Instrument Factory, China), employing a load of 100 g with a 15 s duration. Five values were measured for each sample then the mean values and standard deviation were taken. Friction and wear tests were performed at room temperature and under dry conditions using a ball-disc sliding apparatus (CERT UMT-3, USA). Si3N4 balls with a diameter of 5 mm were used in the experiments. Before the experiment, samples were cleaned by ultrasonic and alcohol to avoid the influence of grease or soil on the experimental results. The parameters that loading force of 500 N, sliding time of 15 minutes, a rotational speed of 500 rpm, and sliding radius of 3 mm were used in the experiment for each specimen. Based on the above parameters, the total sliding distance in the experiment is 141.4 m. An optical profilometry (ContourGT-K) was employed to study the three-dimensional profile of friction and wear.
2.4. Electrochemical Test
The potentiodynamic polarizations of uncoated and coated were measured at room temperature using an electrochemical workstation (CS 2350). The electrochemical experiment was carried out in 3.5 wt.% NaCl solution, with platinum foil as the auxiliary electrode, saturated calomel electrode (SCE) as the reference electrode, and the sample as the working electrode (1 cm2 area was exposed to the solution). Before starting the test, the sample was immersed in the solution for 60 minutes to achieve a stable open circuit potential. The scanning rate of the potentiodynamic polarization curve was 1 mV s−1. The corrosion current density (icorr) and corrosion rate were determined by extrapolating the straight-line section of the anode and cathode Tafel lines.
2.5. Erosion–Corrosion Tests
The erosion-corrosion resistance of the sample was tested in a rotating device consisting of a polymer container, rotator, and controller, as shown in Fig. 2. Artificial seawater was used as the erosion-corrosion experimental solution, and 100 g/L silica sand particles were added. The composition of artificial seawater was referred to Reference27) and ASTM D1141-98, as shown in Table 2. Silica sand is a uniform mixture of sand particles with sizes ranging from 180 μm to 380 μm. The stirring speed was maintained at 500 rpm by using the controller. The experiment lasted for 12 days, and samples were taken every 24 hours to measure weight loss. The details involved removing the sample from the rotating device, rinsing it with water, and then washing it in an ultrasonic bath with alcohol for 10 minutes, following by blow-dry and weigh.

Table 2. The composition of artificial seawater.
| Composition | NaCl | MgCl2 | Na2SO4 | CaCl2 | KCl | NaHCO3 | KBr | H3BO3 | SrCl2 |
|---|
| Concentration (g/L) | 24.53 | 5.2 | 4.09 | 1.16 | 0.695 | 0.201 | 0.101 | 0.027 | 0.025 |
A scanning electron microscope (SEM, JSM-7500F) equipped with energy-dispersive X-ray spectroscopy (EDS) was employed to analyze the surface morphologies of the Ni–P coating. And the cross-section morphologies were analyzed by a scanning electron microscope (SEM, ZEISS Gemini 300). The structures of the substrate and Ni–P coating were characterized by X-ray diffraction (XRD; X’Pert Pro MPD DY129) with a Cu Kα radiation (λ = 1.54 Å). The chemical bonding state of the corrosion products film were analyzed by AXIS Ultra DLD X-ray photoelectron spectroscopy (XPS).
3. Results and Discussions
3.1. Microstructure
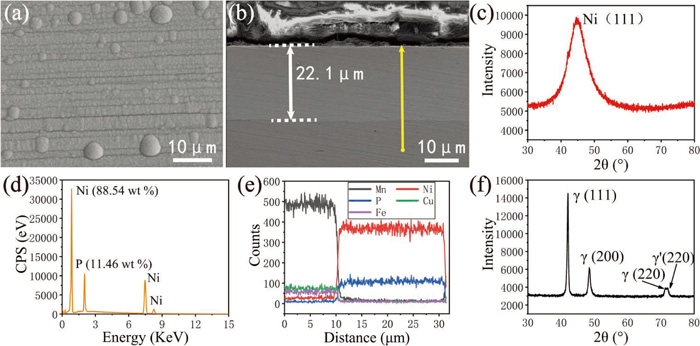
Figure 3(a) shows the secondary electron image of the Ni–P coating surface with fewer defects and micropores, where a typical spherical nodular structure with dense coverage can be observed. EDS analysis in Fig. 3(d) shows that the composition of the coating consisted of 88.54 wt.% nickel and 11.46 wt.% phosphorus. The coating where P content is higher than 9 wt.% is generally considered to be high phosphorus coating, which has better corrosion resistance than medium and low phosphorus coatings.28) Figure 3(b) shows the cross-section morphology of as-deposited Ni–P coating. It can be observed that the coating covers the M2052 substrate evenly, and there are no defects or cracks on the substrate/coating interface, indicating that the coating is well bonded with the substrate.29) Line scan analysis of the cross-section in Fig. 3(e) illustrates that the thickness of the coating is about 22.1 μm and the main components are Ni and P. XRD patterns of coated surface in Fig. 3(c) shows a typical Ni (111) broadening peak near 44.5° (2θ), indicating that Ni (111) has an amorphous structure. While the diffraction peaks of γ-Mn (f.c.c.) phase (corresponding to (111), (200) and (220) plane) and γ’-Mn (f.c.t.) phase (corresponding to (220) plane) can be observed in the XRD pattern of the uncoated sample in Fig. 3(f).
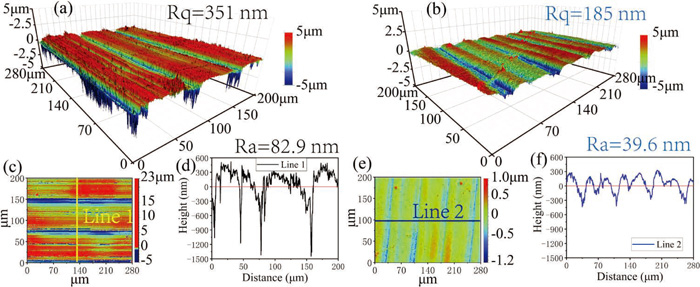
As shown in Figs. 4(a) and 4(b), the surface roughness morphologies of uncoated and coated samples are visually presented by the three-dimensional diagrams. The two surfaces exhibit different features and roughness, with the latter having a smoother surface. The root mean square roughness (Rq) of the two samples were calculated and given in Figs. 4(a) and 4(b) respectively, the surface roughness after Ni–P coating decreased from 351 nm to 185 nm. Besides, the 2D morphology analysis of the two samples in Figs. 4(c)–4(f) further illustrates the fact that the surface of the sample becomes flatter after electroless plating contrast Figs. 4(c) and 4(e)]. Besides, the height fluctuations of line 1 and line 2 are charted in Figs. 4(d) and 4(f) respectively. After electroless Ni–P coating, the height fluctuation decreases and the average roughness decreases from 82.9 nm to 39.6 nm. This result is caused by the lamellar growth mechanism of the Ni–P coating,30) in which the Ni–P alloy nucleates at the catalytic active site on the surface and spreads out in a two-dimensional direction, gradually fills the scratch gullies, and finally contacts the crystal nuclei growing in the adjacent scratch gullies and then grows layer by layer until cover the entire sample surface.
Figures 5(a) and 5(b) show the uncoated and coated 3D wear morphologies, respectively. It can be seen that the depth and width of the wear track of coated sample are shallower and narrower than those of uncoated sample. The cross-section profile curves corresponding to the horizontal lines in Figs. 5(a) and 5(b) are drawn in Figs. 5(d) and 5(e), respectively. The depth and width of the cross-section of uncoated sample are 23 μm and 677 μm, respectively, while those of coated sample are 1.6 μm and 178 μm. These data are used to calculate the cross-sectional area of the wear track to estimate the volume loss of the sample after the friction and wear experiment, as shown in Fig. 5(c). The volume loss of uncoated sample is 0.19604 mm3, which is 52 times that of coated sample (0.00377 mm3). Besides, the microhardness value of coated sample surface (512.53 HV0.1) is about 3 times that of uncoated sample (179.18 HV0.1), also involved in Fig. 5(c).
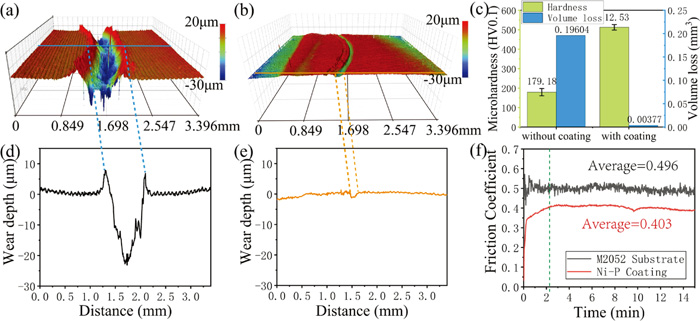
Figure 5(f) shows the friction coefficients of uncoated and coated samples. The two curves are divided into two parts by a dotted green line (approximately corresponding to a 3-minute time point). Before 3 minutes, the friction coefficient of uncoated sample fluctuated greatly, and the friction coefficient of the coated sample gradually increased from a low value to a relatively stable range. After three minutes, both curves reached a steady state. Initially, the friction coefficient curve of uncoated sample shows a peak and then gradually decreases to a trough, which is similar to the most common form of friction coefficient curves in abrasive wear tests.31) The subsequent fluctuation of the curve is believed to be caused by periodic local fracture of the surface layer and periodic accumulation and elimination of debris.29) The friction coefficient curve of coated sample is extremely smooth with obviously slight fluctuation compared with those of the uncoated samples, which is considered to be caused by different wear mechanisms. The wear mechanisms of the two samples will be further discussed and confirmed by SEM morphologies.
As shown in Figs. 6(a) and 6(b), there is a large area of the relatively flat dark plate on the wear track, while other places are irregular wear pits, and grooves consistent with the sliding direction can be faintly seen. Some large wear fragments can also be found in wear pits. Compositional analysis of areas 1 and 2 in Fig. 6(c) indicates oxidation of the worn surface. The oxygen content in the wear debris area (15.86 at.%) is lower than that in the dark plate area (50.1 at.%). Combined with the fracture of the dark plate in Fig. 6(b), it can be inferred that the M2052 substrate is oxidized at the early stage of wear, forming a complete oxide layer. With the continuous sliding of Si3N4 sphere, initiation and propagation of crack occurred to the oxide layer, leading to periodic localized fractured and periodic accumulation and elimination of oxide layer. During this process, some hard debris cut through the matrix to form irregular wear pits. The formation of high oxygen content in the oxide layer is due to the thermodynamic instability of manganese at −1.185 V standard electrode potential.29) In the air, the oxidation reaction is accompanied by the whole experiment. Therefore, the worn surface of the uncoated sample is caused by abrasive wear and corrosion wear.

Figures 6(d) and 6(e) show the worn surface morphology of the coated sample, which can be divided into the central friction zone and the edge friction zone. In both zones, obvious grooves parallel to the sliding direction can be seen. The grooves in the central friction region are shallow, so the worn surface is smooth and the wear debris is very small. The morphology is similar to the worn surface of Ni–P coatings with lubricants in the reference.32) Since phosphorus content provides natural lubricity,33) phosphorus may act as a lubricant during the wear process of Ni–P coating. For the edge friction zone, the worn surface left many large and dark areas, a large number of deep cracks, and large wear debris, suggesting the characteristics of the adhesion mechanism.34) The compositional analysis in Fig. 6(f) shows that the dark region covering the tribo-surface is dominated by nickel oxides, which, as previously mentioned, are due to the thermodynamic instability of Ni at a standard electrode potential of −0.257 V.
The results show that the hardness of the coated samples is improved and the wear mechanism is different from that of the uncoated samples. Uncoated samples have low hardness and high surface roughness and are easy to be oxidized during wear, which is easy to form a wear mechanism of the synergistic action of abrasive wear and oxidized wear. However, due to the high hardness, low surface roughness, and existence of phosphorus, the coated samples are inclined to perform the adhesion wear mechanism. Besides, the reduction of the friction coefficient of coated sample is consistent with Khruschov’s conclusion that the wear resistance of the material is generally proportional to its Vickers hardness.31)
3.3. Corrosion Resistance of Ni–P Coating
Typical potentiodynamic polarization curves of uncoated and coated samples are shown in Fig. 7 and the corrosion potentials (Ecorr), corrosion current densities (Icorr), and corrosion rates obtained from the Tafel slope extrapolation method are listed in Table 3. The data manifest that the corrosion current of samples decreases sharply from 1253.20 μA to 7.63 μA after coating. The corrosion rate of the coated sample (0.0897 mm/year) is also significantly different from that of the uncoated sample (14.0880 mm/year). And the corrosion potential of the coated sample (−0.9304 V) has an obvious shift compared with that of the uncoated sample (−0.3061 V). The above results suggest that Ni–P coating has better corrosion resistance than the M2052 substrate. The polarization curves of uncoated sample show two passive plateaus between −0.85 V and −0.58 V, suggesting that oxide films were formed on the surface of the uncoated sample. After the first oxide film was formed, it dissolved quickly, and then a second oxide film was formed. However, when the potential is higher than −0.58 V, the second oxide film breaks down and gradually dissolves.22)
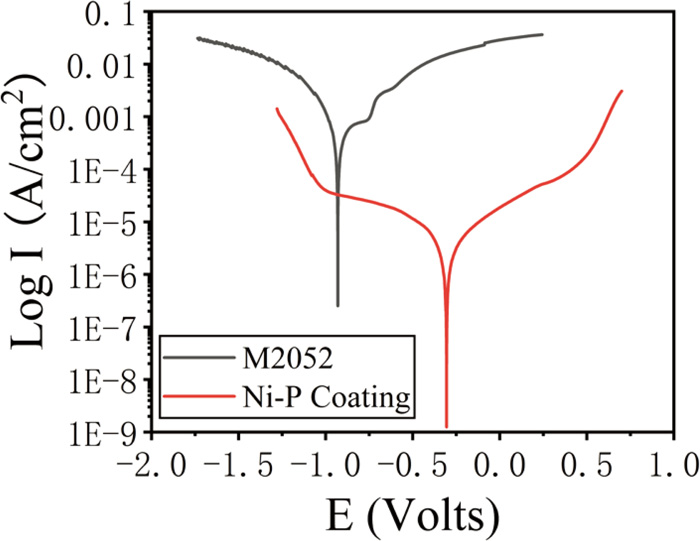
Table 3. Corrosion data of the uncoated and coated samples obtained from Tafel analysis.
| Samples | Ecorr (V) | Icorr (μA/cm2) | Corrosion rate (mmpY) |
|---|
| uncoated | −0.9304 | 1253.2 | 14.0880 |
| coated | −0.3061 | 7.63 | 0.0897 |
Figure 8(a) shows the relationship between mass loss and time of uncoated and coated samples. Obviously, the weight loss of the uncoated sample is much greater than that of the coated sample and the erosion-corrosion rate of the former is 4.7 times higher than that of the latter. Their erosion-corrosion rates are given separately in Fig. 8(b). The results illustrate that the Ni–P coating has a lower corrosion rate.

Figures 8(c) and 8(d) show the XRD analysis results of the uncoated sample and coated sample after 12 days of the erosion-corrosion test, respectively. There are two major diffraction peaks (2θ = 43.3 and 50.4°) in the XRD pattern of Fig. 8(c), corresponding to the (111) and (200) reflections of a face-centred cubic (f.c.c.) Cu (PDF # 85-1326), respectively. Moreover, there are two minor diffraction peaks (2θ = 31.1 and 37.6°) which can be indexed to Mn(OH)2 (PDF # 73-1604) and MnO2 (PDF # 72-1982), corresponding to the (100) and (121) reflections, respectively. It should be noted that other diffraction peaks of Mn(OH)2 at 49.8° and MnO2 at 49.9° cannot be readily discerned due to the occurrence of overlaps with (200) reflection of Cu. Besides, the diffraction peak of Mn(OH)2 at 36.5° and the diffraction peak of MnO2 at 36.6° also overlap, and they are obscured in the (121) reflection of MnO2. Thus, the Corrosion products covering the surface of uncoated sample are composed of Cu, Mn(OH)2 and MnO2 phases, in which Cu is dominant obviously based on their relative peak intensities (Fig. 8(c)). In Fig. 8(d), two diffraction peaks of Cu at 43.3 and 50.4° also appeared on the XRD pattern of the coated sample surface. Besides, the broadened peak of Ni (111) at 44.5° was still very obvious, indicating that the surface of the substrate was still covered with electroless coating.
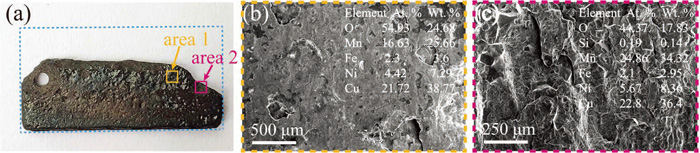
The surface morphology of the uncoated sample and coated sample show a marked contrast in corrosion status, which can be contributed to corrosion, erosion, and their synergistic action in the period of 12 days corrosion-erosion test and some typical SEM images are shown in Fig. 9. The blue dotted boxes in Figs. 9(a) and 10(a) represent the size of the samples before the erosion-corrosion experiment. Apparently, the uncoated sample was eroded so severely that more than one-third of the material was lost (Fig. 9(a)). Figure 9(b) shows that the surface of the sample is rough and uneven and different sizes of erosion-corrosion pits are distributed. A typical brittle fracture shown in Fig. 9(c) indicates the mechanical spalling of corrosion products. EDS results of area 1 show that the atomic percentage of oxygen exceeds 50%, the atomic percentage of manganese drops to 16.63%, while the atomic percentage of copper, nickel, and iron change little (compared with Mn-20Cu-5Ni-2Fe, at.%). For the area 2, EDS analysis illustrates that the atomic percentage of oxygen decreases, the atomic percentage of manganese increases compared with region 1, and the atomic percentage of other elements is almost unchanged. These results suggest that MnO2 phase exists on the surface of the sample in combination with the XRD results.

A macroscopic view of the coated sample in Fig. 10(a) shows that one corner is heavily corroded and the coating around the corroded area was peeled off (the area surrounded by the yellow dotted line). On about the fourth day of the experiment, visible corrosion appeared at the corners of the samples and the fact can be confirmed by the weight loss result of coated sample in Fig. 8(a). The formation of the original corrosion spot may be related to surface defects, such as micropores that often appear on the surface of Ni–P coatings.35) The micropores in the coating may facilitate the penetration of a corrosive medium, resulting in the corrosion of the substrate.36) Figure 10(b) shows the SEM image of area 3, where the ridge-like morphology of the Ni–P coating is faintly discernible. Lots of small flakes form on the surface of the coating along the direction of the water-sand slurry flow. The morphology of the center area of the plated sample is shown in Fig. 10(c). The morphology of the center area of the coated sample is shown in Fig. 10(c). Cracks are all over the whole area, and there are many granular particles on the surface. Figure 10(d) shows the microscopic morphology on the other side of the coated sample. The ridge-like morphology of the Ni–P coating is relatively easy to distinguish, indicating that this area is less eroded by the water-sand slurry flow. Observing the area of the white rectangle in Fig. 10(d), there are also many small flakes formed after erosion on the surface (Fig. 10(e)).
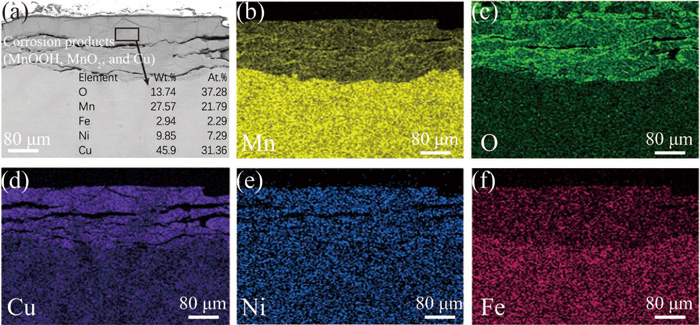
The morphology and transverse elemental distribution on cross-sectional uncoated sample after erosion-corrosion for 12 days is displayed in Fig. 11. A layer of corrosion products with thickness ranging from 10 μm to 100 μm is formed on the surface of the uncoated sample (Fig. 11(a)). The structure of the corrosion product layer is loose and there are many transverse cracks on it, which indicates that the solution permeates layer by layer and reacts with the substrate. Long and wide cracks mean that corrosion products fall off easily. The element distribution in Figs. 11(b)–11(f) shows that the corrosion product layer mainly contains oxygen and copper elements, while manganese element is relatively scarce. EDS results in the black box area in Fig. 11(a) indicate that the atomic percentage of manganese is 21.79%, which is consistent with the results in Fig. 9(b).
The section morphology of the coated sample edge after erosion-corrosion shows that the coating bonded well to the substrate (Fig. 12(a)). However, there were many dentate erosion marks on the surface of the Ni–P coating, with a depth of about 1 μm (Fig. 12(b)). The surface of the erosion marks was covered with a layer of corrosion scale about 1 μm thick, which was mainly composed of oxygen and copper by EDS mapping analysis in Figs. 12(c) and 12(d). The production of Cu on the surface of the coating may be caused by the rupture of the coating during the erosion-corrosion process, causing the substrate to contact the solution and dissolve in the slurry flow, thereby being captured by the remaining surface of the coating and becoming a part of the corrosion product.

Figure 13(a) shows the cross-sectional morphology of the central area of the coated sample. There are no erosion marks on the periphery of the Ni–P coating, but it is covered by a layer of corrosion scale about 3 μm thick. EDS mapping results show that the nickel and phosphorus elements are evenly distributed, and the corrosion scale is mainly composed of manganese and oxygen, with a small amount of copper. The composition of corrosion products in the center area is different from that in the edge area, which is shown in the macroscopic image as black in the center area and yellow in the edge area.

XPS analysis was used to determine the chemical states of corrosion product films on the surface of uncoated and coated samples after erosion-corrosion for 12 days. The peaks of Cu 2p, Mn 2p and O 1s were deconvolved to obtain the high-resolution XPS spectra of the corresponding elements. Figure 14(a) shows the high-resolution image of Cu 2p of uncoated sample. After 12 days of erosion-corrosion test, the two main peaks located at 932.59 eV and 952.45 eV were ascribed to Cu 2p3/2 and Cu 2p1/2, respectively, an indication of the presence of Cu.37,38) High-resolution image of Mn 2p of uncoated sample consists of two prominent peaks at 641.09 eV and 652.80 eV with 11.70 eV of spin energy separation owing to a spin doublet of Mn 2p3/2 and Mn 2p1/2 (Fig. 14(b)), indicating the presence of Mn4+.39) Besides, the peak at 642.40 eV can be assigned to Mn3+.40) The corresponding O 1s spectrum is deconvolved into two peaks at 530.18 eV and 531.10 eV, which can be ascribed to the two oxygen-containing chemical bonds (Mn–O–Mn and Mn–O–H) respectively.41,42) These two oxygen-containing bonds correspond to MnO2 and MnOOH, which is roughly consistent with the results of XRD analysis.

The Cu 2p high-resolution images of the coated samples show three main peaks at 931.60 eV, 933.35 eV and 952.26 eV (Fig. 14(d)), all of which reveal the presence of Cu0.43,44,45) Moreover, the satellite peak at 961.6 eV is also assigned to Cu0.46) The Mn 2p spectrum of the coated sample revealed two peaks of Mn4+ at 644.80 eV and 652.16 eV and one peak of Mn3+ at 641.19 eV.47,48,49) The corresponding O 1s spectrum was deconvoluted into two peaks, the peak at 530.38 eV was ascribed to Mn–O–Mn,50) and the peak at 531.24 eV was ascribed to Mn–O–H.42) The results are consistent with XPS analysis of corrosion products on the surface of uncoated sample.
Based on the above results, the deterioration mechanism of M2052 alloy and Ni–P coating in artificial seawater slurry environment is analyzed as follows. When the uncoated M2052 alloy was exposed to the artificial seawater and sand environment, the manganese on the alloy surface formed tiny galvanic cells with other components. Since the standard electrode potential of manganese is the most negative (−1.185 V), the following oxygen reduction corrosion may occur:
|
Anode reaction:
Mn-2e→M
n
2+
|
|
Cathode reaction:
O
2
+2
H
2
O+4e→4O
H
-
|
|
Anode reaction products:
M
n
2+
+2O
H
-
→Mn
(OH)
2
|
The oxygen carried in the water-sand slurry flow readily oxidizes manganese hydroxide to form 3-valent MnOOH or 4-valent MnO(OH)2 and the production of manganese dioxide is related to the dehydration reaction of MnO(OH)2:
|
4Mn
(OH)
2
+
O
2
→4MnOOH+2
H
2
O
|
|
2Mn
(OH)
2
+
O
2
→2MnO
(OH)
2
|
|
MnO
(OH)
2
→Mn
O
2
+
H
2
O
|
Then many tiny pits were formed on the surface of the uncoated sample. With the impact of sand particles carried in the sediment flow, some corrosion products that were not strongly adhering to the substrate were lost, thus exposed the fresh substrate surface, and the erosion-corrosion process was repeated. On the other hand, sharp sand particles damaged the surface of the uncoated sample, increasing the area where corrosion may occur. This results in a synergistic effect of erosion-corrosion. After Mn is reacted, the inert metal Cu remains and is mixed with the corrosion products. The appearance of copper phase in XRD pattern and XPS analysis and the fact that Cu is mainly distributed in the corrosion product layer according to cross section EDS mapping analysis can well confirm this viewpoint. Besides, chloride ions act on the substrate through the corrosion product layer due to their strong penetrating property. Low hardness and poor protectiveness of corrosion product layer cannot effectively protect the substrate. As a result, corrosion occurs at a deeper depth and the layers of corrosion products become thicker. Therefore, the weight loss of the uncoated sample is mainly caused by the combined action of mechanical impact (erosion of impact particles), electrochemical action of corrosive medium (corrosion) and their interaction (synergistic action).51)
From the above analysis, it can be seen that the erosion-corrosion resistance of Ni–P coating is significantly higher than that of M2052 substrate. Besides, excluding the corrosion caused by the coating defects, the erosion-corrosion damage of Ni–P coating is very slight. It has been reported that the enriched phosphorus layer of adsorbed hypophosphite anions (H2PO2−) formed on the Ni–P coating can prevent the hydration of Ni and further protect the coating from corrosion.52) Ref. [29] further verified the good corrosion resistance of Ni–P coating by Mott--Schottky analysis, and summarized the protection mechanism of Ni–P coating in neutral or acidic environment. Moreover, the high hardness of Ni–P coating also provided better mechanical support for the outermost passivation layer, thereby the test solution can only produce small flakes on the coating surface.53) After forming the tiny erosion marks, corrosion products floating in the slurry flow attach to it. With the obstruction of the erosion traces, the corrosion products are not easy to be carried away by the flow, so slowly accumulated and covered the erosion marks. When the corrosion scale coverage is thick, the sand particles in the slurry flow cannot cause further damage to the Ni–P coating, and the corrosion scale plays a role in protecting the substrate. Figures 12 and 13 illustrate that even though the Ni–P coating on the surface of M2052 is seriously damaged and with lots of corrosion products on the coating surface, the coating/substrate interface is still relatively flat. Sun et al.36) found that the Ni–P coating in an acidic corrosive medium will cause severe pitting or even uniform corrosion at the coating/substrate interface. This is because the corrosive medium directly reacts the substrate through coating defects or micropores, resulting in the dissolution of the matrix. Different from their research, the Ni–P coating prepared in this study has significantly fewer defects than the coating on the carbon steel surface (Fig. 3(a)), so no obvious pitting was observed at the coating/substrate interface. This phenomenon proved that the coating is dense, complete and has a strong bonding force with the substrate, which is consistent with the thermal shock results in Fig. 1.
4. Conclusions
The surface quality, friction, wear, electrochemistry, and erosion-corrosion behavior of M2052 damping alloy and Ni–P coating were evaluated. The conclusions of this work are summarized as follows:
(1) The amorphous Ni–P coatings with Ni content of 88.54 wt.% and P content of 11.46 wt.% and a thickness of 22.1 μm were deposited on M2052 damping alloy by electroless plating. The thermal shock test shows that the Ni–P coating has good adhesion to the substrate.
(2) After electroless Ni–P plating, the microhardness of the sample increases from 179.18 HV0.1 to 512.53 HV0.1, and the surface roughness decreases from 351 nm to 185 nm. Due to the high hardness and corrosion resistance of Ni–P coating, the wear mechanism of the sample changed from abrasive wear and corrosion wear of the M2052 alloy to adhesive wear of the sample with coating.
(3) Electrochemical test and erosion-corrosion test show that Ni–P coating has good passivation property and corrosion resistance, and the corrosion rate decreases from 14.0880 to 0.0897 mmPY.
(4) After 12 days of erosion-corrosion experiments, the Ni–P coating was damaged locally, which effectively protected the substrate.
Acknowledgments
The authors gratefully acknowledge the foundation of Grants provided by National Natural Science Foundation of China (Nos. 51471112 and 51611130204), Science and Technology Planning Project of Sichuan (No. 2016GZ0173). The authors would like to thank Yi He from the Analytical and Testing Center at Sichuan University for his help.
References
- 1) X. Y. Wang, W. Y. Peng and J. H. Zhang: Mater. Sci. Eng. A, 438–440 (2006), 194.
- 2) F. Yin, Y. Ohsawa, A. Sato and K. Kawahara: Acta Mater., 48 (2000), 1273.
- 3) Z. C. Jiang, Q. C. Tian, Z. M. Ren, P. G. Ji, J. H. Feng and F. X. Yin: IOP Conf. Ser. Mater. Sci. Eng., 542 (2019), 012020.
- 4) Z. Zhong, W. Liu, N. Li, J. Yan, J. Xie, D. Li, Y. Liu, X. Zhao and S. Shi: Mater. Sci. Eng. A, 660 (2016), 97.
- 5) I. G. Ritchie, Z. Pan, K. W. Sprungmann, H. K. Schmidt and R. Dutton: Can. Metall. Q., 26 (1987), 239.
- 6) H. Sun, B. Giron-Palomares, W. Qu, G. Chen and H. Wang: J. Alloy. Compd., 803 (2019), 250.
- 7) J. Wang, Z. Wu, S. Gao, R. Lu, D. Qin, W. Yang and F. Pan: J. Magnes. Alloy., 3 (2015), 79.
- 8) N. Igata, N. Urahashi, M. Sasaki and Y. Kogo: J. Alloy. Compd., 355 (2003), 85.
- 9) Y. Wu, F. Yin and K. Hono: Scr. Mater., 46 (2002), 717.
- 10) F. Yin: Acta Metall. Sin., 39 (2003), 1139.
- 11) D. Li, W. Liu, N. Li, Z. Zhong, J. Yan and S. Shi: J. Vis. Exp., 139 (2018), 57180.
- 12) F. X. Yin, S. Iwasaki, T. Sakaguchi and K. Nagai: Key Eng. Mater., 319 (2006), 67.
- 13) J. Yan, N. Li, X. Fu and Y. Zhang: Mater. Sci. Eng. A, 618 (2014), 205.
- 14) Y. Watanabe, Y. Suga, E. Miura-Fujiwara, H. Sato and Y. Nishino: Mater. Sci. Forum, 706–709 (2012), 2026.
- 15) D. Li, W. Liu, N. Li, J. Yan and S. Shi: Adv. Eng. Mater., 19 (2017), 1700437.
- 16) W. Liu, N. Li, Z. Zhong, J. Yan, D. Li, Y. Liu, X. Zhao and S. Shi: Mater. Des., 106 (2016), 45.
- 17) A. Bahgat Radwan, K. Ali, R. A. Shakoor, H. Mohammed, T. Alsalama, R. Kahraman, M. M. Yusuf, A. M. Abdullah, M. Fatima Montemor and M. Helal: Appl. Surf. Sci., 457 (2018), 956.
- 18) W. Wang, W. Zhang, Y. Wang, N. Mitsuzak and Z. Chen: Appl. Surf. Sci., 367 (2016), 528.
- 19) M. Czagány and P. Baumli: Surf. Coat. Technol., 361 (2019), 42.
- 20) Y. M. Chow, W. M. Lau and Z. S. Karim: Surf. Interface Anal., 31 (2001), 321.
- 21) J. Lin and C. Chou: Surf. Coat. Technol., 368 (2019), 126.
- 22) R. Hu, Y. Su and H. Liu: J. Alloy. Compd., 658 (2016), 555.
- 23) N. Stanley Ebenezer, P. S. V. V. Srihari, C. Ram Prasad, P. Appalaraju, A. Tatahrishikesh and B. Sai Teja: Mater. Today: Proc., 27 (2020), 1038.
- 24) P. Zhang, Q. Zhu, C. Wang, H. Qin and G. Chen: Integr. Ferroelectr., 171 (2016), 146.
- 25) H. Ashassi-Sorkhabi and M. Es’haghi: Corros. Sci., 77 (2013), 185.
- 26) C. Sun, J. Li, S. Shuang, H. Zeng and J. Luo: Corros. Sci., 134 (2018), 23.
- 27) B. Cai, Y. Liu, X. Tian, F. Wang, H. Li and R. Ji: Corros. Sci., 52 (2010), 3235.
- 28) Y. Zhang, K. Zhang, J. Fan, S. Zhang and M. Yao: Trans. Nonferrous Met. Soc. China, 8 (1998), 642.
- 29) G. Chen, J. Wang, L. Xue and Z. Huang: ISIJ Int., 60 (2020), 2276.
- 30) X. Zhan and F. Ernst: Acta Mater., 104 (2016), 274.
- 31) J. Wu, S. Lin, J. Yeh, S. Chen, Y. Huang and H. Chen: Wear, 261 (2006), 513.
- 32) A. Ramalho and J. C. Miranda: Wear, 263 (2007), 592.
- 33) J. Sudagar, J. Lian and W. Sha: J. Alloy. Compd., 571 (2013), 183.
- 34) Y. Liu, S. Ma, M. C. Gao, C. Zhang, T. Zhang, H. Yang, Z. Wang and J. Qiao: Metall. Mater. Trans. A, 47 (2016), 3781.
- 35) L. Li, J. Wang, J. Xiao, J. Yan, H. Fan, L. Sun, L. Xue and Z. Tang: Int. J. Hydrog. Energy, 46 (2021), 11849.
- 36) C. Sun, H. Zeng and J. Luo: Corros. Sci., 148 (2019), 317.
- 37) J. C. Klein, A. Proctor, D. M. Hercules and J. F. Black: Anal. Chem., 55 (1983), 2055.
- 38) A. C. Miller and G. W. Simmons: Surf. Sci. Spectra, 2 (1993), 55.
- 39) K. Mohamed Racik, A. Manikandan, M. Mahendiran, P. Prabakaran, J. Madhavan and M. Victor Antony Raj: Physica E, 119 (2020), 114033.
- 40) M. C. Biesinger, B. P. Payne, A. P. Grosvenor, L. W. M. Lau, A. R. Gerson and R. S. C. Smart: Appl. Surf. Sci., 257 (2011), 2717.
- 41) X. Liu, L. Zang, Y. Xu, Q. Liu, H. You, M. Chen and C. Yang: Diamond Relat. Mater., 115 (2021), 108371.
- 42) D. Yan, P. Yan, S. Cheng, J. Chen, R. Zhuo, J. Feng and G. A. Zhang: Cryst. Growth Des., 9 (2009), 218.
- 43) M. Yusuf, S. Song, S. Park and K. H. Park: Appl. Catal. A-Gen, 613 (2021), 118025.
- 44) W. Zhang, Y. Yao, S. Xie, K. Gubsch, Y. Yang, X. Lan and H. Lin: Catal. Today, 374 (2021), 53.
- 45) H. Wang, X. Hu, X. Jiang and Y. Li: J. Manuf. Process., 62 (2021), 291.
- 46) A. T. E. Vilian, R. Umapathi, S. Hwang, Y. S. Huh and Y. Han: J. Hazard. Mater., 408 (2021), 124914.
- 47) H. W. Nesbitt and D. Banerjee: Am. Mineral., 83 (1998), 305.
- 48) E. Aslan, A. Sarilmaz, G. Yanalak, S. S. Ozel, F. Ozel and I. H. Patir: Mater. Today Energy, 18 (2020), 100510.
- 49) Y. Cai and J. He: Environ. Res., 195 (2021), 110860.
- 50) R. Cao, L. Li and P. Zhang: J. Hazard. Mater., 407 (2021), 124793.
- 51) X. Zhang, J. Wang, H. Fan and D. Pan: Appl. Surf. Sci., 440 (2018), 755.
- 52) B. Jiang, S. L. Jiang, A. L. Ma and Y. G. Zheng: J. Mater. Eng. Perform., 23 (2014), 230.
- 53) X. Ji, S. Jiang, H. Li, C. Yan and L. Jiang: Met. Mater. Int., 18 (2012), 655.