Abstract
Stress relaxation, which occurs during holding at the bottom dead center in press forming, affects press formability. Because holding at the bottom dead center is completed within several seconds, it is important to predict the stress relaxation behavior of the first few seconds after the start of holding. The purpose of this study is to propose a model, the material parameters of which are obtained from tensile tests, to predict the stress decreasing behavior in the early stage of stress relaxation in steel sheets. We constructed the model by modifying the Kocks-Mecking model based on the following assumptions: Stress relaxation at room temperature is due to the slip motion of dislocations, which indicates that the plastic strain rates at the start of stress relaxation are same as those in the previous tensile process. In this study, it was assumed that the change in microstructure during stress relaxation is negligible; hence material parameters remain constant during stress relaxation. The measured and predicted stress relaxation behaviors for various strain rates during the tensile process were compared. It was observed that an increase in the plastic strain rate during the tensile process accelerated stress relaxation. The proposed model was able to predict this phenomenon. However, the relative error between experimental results and the model increased as the stress relaxation progressed mainly owing to dynamic strain aging. Therefore, the proposed model is applicable in the condition when effect of dynamic strain aging is negligible.
1. Introduction
High strength steels have difficulties in press formability. Some studies reported that stress relaxation, which refers to decrease in stress when a material is subjected to a predetermined strain and sustained at the strain, affects press formability.1,2,3,4) This could lead to avoid difficulties in press-forming by suppressing springback1,2) or improving total elongation.4) The bottom dead center of press forming, where stress relaxation is considered to occur, is sustained within a few seconds. Therefore, understanding stress relaxation behavior in the first few seconds after the start of holding at the bottom dead center is important.
A recent study reported that an increase in the plastic strain rate during the tensile process accelerates stress decrease during stress relaxation especially in the first few seconds from stress relaxation beginning.5) Therefore, a model which predicts stress relaxation must be proposed with incorporating such effects of strain rate during tensile process on stress relaxation behavior.
Models to describe stress relaxation behavior have been proposed by early studies.6,7,8) Recently, a modified model, which is known as the logarithmic law, including the effect of change in athermal stress and mobile dislocation density during stress relaxation is proposed.9,10) The models provided in the abovementioned studies are used to calculate the material structure factors (athermal stress, dislocation density, and activation volume) by fitting the models to stress relaxation behavior in the late stage of the stress relaxation test. However, the stress relaxation behavior described by these models6,7,8,9,10) in the early stage of stress relaxation test cannot be expressed. This is because a variable with time dimension in the models6,7,8,9,10) is shifted to a late time, and then fitted to the stress relaxation behavior. Therefore, a new model must be proposed to predict stress relaxation behavior in the early stages of stress relaxation.
Both plastic deformation and stress relaxation at room temperature are due to the same mechanism: slip motion of the dislocation rate-determined by thermal activated process. Therefore, to propose a model to predict stress relaxation behavior in the early stage of stress relaxation, we focus on the Kocks-Mecking (KM) model,11) which describes the stress-strain relationship based on the thermally activated process of dislocation slip. This model is expected to describe uniformly stress and time relationship during both tensile deformation and stress relaxation. Therefore applying the KM model will achieve an improvement in prediction of stress relaxation behavior comparing with the conventional logarithmic law model.
In this study, the followings were assumed to predict the stress relaxation behavior by modifying the KM model: First, we hypothesized that the motion of the dislocation during the tensile process continues ever immediately after the start of stress relaxation. This hypothesis gives the following assumption based on Orowan’s equation,12) where the product of the mobile dislocation density and the dislocation velocity is proportional to the plastic strain rate, i.e.,
ε
˙
p
= Aρmv (A: material constant related to Taylor factor, ρm: mobile dislocation density, v: dislocation velocity).
Assumption 1: The plastic strain rate at the start of the stress relaxation is the same as that in the previous tensile process.
It is generally known that the dislocation microstructure recovers,13,14) mobile dislocation density decreases15) and dislocations are accumulated by plastic deformation during stress relaxation.16) However, we assume the following based on considering that the effect of change in the dislocation microstructure on stress relaxation behavior is negligible in the early stage of stress relaxation to simplify the model, likely with early studies.6,7,8,17)
Assumption 2: The material constants on the dislocation microstructure are obtained from tensile tests and the material constants are unchanged during stress relaxation.
The objective of this study is to predict stress relaxation behavior in the early stage of stress relaxation in steel sheets. Therefore we estimate the stress relaxation behavior based on the above assumptions and confirm whether stress decrease during stress relaxation is accelerated by increase in plastic strain rate during tensile process, which is characteristic behavior in the early stage of stress relaxation. We also calculate the error between estimated and experimentally obtained stress relaxation behavior and discuss the applicable condition of the model to validate accuracy of the model.
2. Model
2.1. KM Model
It is known that stress relaxation at room temperature is due to the slip motion of mobile dislocations.6,7) The motion of dislocations is rate-determined via thermally activated process. Therefore, we conceive that the model based on the thermally activated process of dislocation motion can describe the stress relaxation behavior. We focus on the KM model,11) which is a model that describes the stress-strain relationship based on the thermally activated process of dislocation motion.
This section provides an outline of the KM model. On the basis of the mechanism on thermally activated process of dislocation motion, the interaction between dislocation motion and defects can be categorized into long-range and short-range obstacles. Long-range obstacles, of which the thermally activated process does not affect dislocation overcoming, include the elastic strain fields of other dislocations, the back stress due to curvature of the glide dislocation,18) and grain boundaries.19) Short-range obstacles, in which the thermally activated process assists dislocation overcoming, include the Peierls potential, interactions with forest dislocations, the motion of jogs and overcoming interstitial atoms or precipitates.20) This idea expresses the flow stress σ as
where athermal stress
σa and thermal stress
σt correspond to the strengthening mechanism due to long-range and short-range obstacles, respectively. The plastic strain rate
ε
˙
p
is described by the Arrhenius equation based on the thermally activated process of dislocation, as follows:
|
ε
˙
p
=
ε
˙
0
exp(
-
ΔG
kT
)
,
| (2) |
where
k is the Boltzmann constant,
T the absolute temperature, and
ε
˙
0
the frequency factor related to the frequency of encounters between dislocations and obstacles per unit time. The activation energy per one atom Δ
G for dislocation overcoming short-range obstacles is expressed as follows:
|
ΔG=
g
0
μ
b
3
[
1-
(
σ
t
σ
ˆ
t
)
p
]
q
,
| (3) |
where
g0 is the normalized activation energy,
μ is the shear modulus;
b is the magnitude of the Burgers vector;
σ
ˆ
t
is the threshold stress representing the thermal stress
σt at 0 K; and
p and
q are factors that provide the shape of the obstacle. Based on the equations above, the flow stress can be expressed as follows:
|
σ=
σ
a
+
[
1-
{
kT
g
0
μ
b
3
ln(
ε
˙
p
ε
˙
0
)
}
1
q
]
1
p
σ
ˆ
t
.
| (4) |
One of the general forms of the expression is known as the KM model
|
σ
μ
=
σ
a
μ
+
s
I
(T,
ε
˙
p
)
σ
ˆ
I
μ
0
+
s
D
(T,
ε
˙
p
)
σ
ˆ
D
μ
0
,
| (5) |
where
μ0 is the shear modulus at 0 K; and subscripts I and D denote the interstitial hardening and deformation hardening, respectively. Subsequently,
s(T,
ε
˙
p
)
is expressed in terms of temperature
T and plastic strain rate
ε
˙
p
, as follows:
|
s
I
=
[
1-
(
kT
g
0I
μ
b
3
ln
ε
˙
0I
ε
˙
p
)
1
q
I
]
1
p
I
,
| (6) |
|
s
D
=
[
1-
(
kT
g
0D
μ
b
3
ln
ε
˙
0D
ε
˙
p
)
1
q
D
]
1
p
D
.
| (7) |
This study describes the change in dislocation microstructure due to the increase in plastic strain
εp during the tensile process as changes in the athermal stress
σa, threshold stress
σ
ˆ
D
, and normalized activation energy
g0D with plastic strain
εp.
2.2. Procedure for Prediction of Stress Relaxation Behavior
As explained in Section 2.1, the original KM model is applied to describe the stress-strain relationship by obtaining the material parameters from fitting the model to the stress-strain relationships derived from tensile tests. Namely, giving a plastic strain εp, plastic strain rate
ε
˙
p
, and temperature T to the KM model provides flow stress σ. In this study, we predict stress relaxation by modifying the KM model, the material parameters of which are obtained based on the stress-strain relationships derived from tensile tests. We assume that the plastic strain rate
ε
˙
p
at the start of stress relaxation is the same as the plastic strain rate in the previous tensile process because both stress relaxation at room temperature and tensile deformation are determined by the same mechanism; the slip motion of dislocations. Furthermore, we assume that the parameters related to the microstructure are constant during stress relaxation because the purpose of this study is to predict the stress decreasing behavior in the early stage of stress relaxation, in which the change in microstructure considered to be negligible. In this section, the procedure to obtain the model predicting the stress relaxation behavior by modifying the KM model based on the assumptions above is provided.
This paragraph summarizes the approach for modifying the KM model. First, by replacing the plastic strain rate
ε
˙
p
of the KM model in Eq. (5) with the stress rate
σ
˙
, we obtain an equation as a function of stress σ and its derivative dσ/dtH, where the holding time tH is defined as the elapsed time from the start of stress relaxation. Subsequently, by solving the differential equation in the initial conditions derived from plastic strain εp and plastic strain rate
ε
˙
p
at the start of stress relaxation, we obtain a relationship between stress σ and holding time tH.
The detailed procedure for modifying the KM model is as follows. The first step is to replace the plastic strain rate
ε
˙
p
in Eq. (5) to stress rate
σ
˙
. The total strain, i.e., the sum of elastic and plastic strains, is expressed as follows during stress relaxation by the displacement of crosshead being held:
|
ε
e
+
ε
p
=
ε
H0
+
ε
H
,
| (8) |
where
εH0 is the total strain at the start of crosshead holding, and
εH is the increment in the total strain from the start of crosshead holding owing to the elastic deformation of the tensile testing machine. Differentiating
Eq. (8) with time yields
|
σ
˙
E
+
ε
˙
p
=
ε
˙
H
,
| (9) |
as using
εe =
σ/
E. During the stress relaxation process, the crosshead displacement is held. Therefore, the decrease in load due to stress relaxation causes the elastic deformation of the tensile testing machine in the direction of increasing strain in the specimen, resulting in an increase in
εH. The relationship between
εH and
σ during stress relaxation is expressed as
where
M and
C are constants accounts for the rigidity of the tensile testing machine.
7) Figure 1 shows the relationship between stress and strain during stress relaxation process by crosshead holding. The result yielded
M = 55.7 GPa. Differentiating
Eq. (10) with time yields
Substituting
Eq. (11) into
Eq. (9) yields
where
E
′
denotes the apparent Young’s modulus, which accounts for the rigidity of the tensile testing machine:
E
′
=EM/(E+M)
.
Substituting Eq. (12) into Eq. (5) yields
|
σ
μ
=
σ
a
μ
+
s
I
(
T, -
σ
˙
E
′
)
σ
ˆ
I
μ
0
+
s
D
(
T, -
σ
˙
E
′
)
σ
ˆ
D
μ
0
s
I
=
[
1-
(
kT
g
0I
μ
b
3
ln
-
E
′
ε
˙
0I
σ
˙
)
1
q
I
]
1
p
I
s
D
=
[
1-
(
kT
g
0D
μ
b
3
ln
-
E
′
ε
˙
0D
σ
˙
)
1
q
D
]
1
p
D
.
| (13) |
We numerically obtained the approximate solutions for the differential equation shown in Eq. (13). Substituting an initial condition comprising the plastic strain εp and its rate
ε
˙
p
at the start of the crosshead holding into Eq. (5) yields the stress at the start of the crosshead holding σH0. Subsequently, integration from σH0 to an arbitrary stress σ yields the holding time tH, expressed as Eq. (14).
|
t
H
=
∫
σ
H0
σ
d
t
H
dσ
dσ.
| (14) |
Plotting the relationship between arbitrary stress
σ and holding time
tH shows the stress decreasing behavior during stress relaxation.
Although it was reported that recovery13,14) and accumulation of dislocation by plastic deformation16) occurred during stress relaxation, and models that accounted for microstructure changes have been proposed,9,10) we assume that the microstructure changes are negligible during stress relaxation process. Namely, the parameters of the microstructure, i.e., the athermal stress σa, normalized activation energies g0I and g0D; frequency factors
ε
˙
0I
and
ε
˙
0D
; and threshold stresses
σ
ˆ
I
and
σ
ˆ
D
, are assumed to be constant during stress relaxation.
3. Experimental Procedures
3.1. Sample
A hot rolled steel sheet mainly containing 0.08C-1.7Si-1.2Mn (mass%) was used.21) Table 1 shows the mechanical properties of the sample. Figure 2 shows the optical microscopic image of the sample. The surfaces were etched with a nital solution after mirror polishing. The material consisted of ferrite (white region) and bainite (black region). The area fraction of bainite was 13.2%. The average diameter of ferrite grains was 7.08 μm.
Table 1. Mechanical properties of sample.
21)| Yield strength (MPa) | Tensile strength (MPa) | Total elongation (%) |
|---|
| 478 | 591 | 29 |
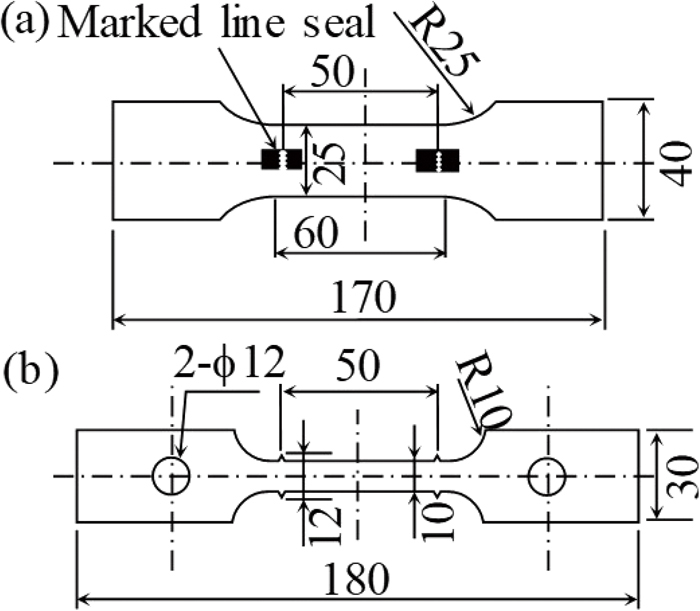
To calculate the parameters of the KM model, tensile tests were performed under the following conditions: First, we performed tensile tests with strain rates of 6.0 × 10⁻⁶, 6.0 × 10⁻⁵, 6.0 × 10⁻⁴, 6.0 × 10⁻³ and 6.0 × 10⁻² s−1 at 293 K. Furthermore, we performed tensile tests at a strain rate of 6.0 × 10⁻⁴ s−1 at temperatures of 223 and 373 K. Dimensions of the specimens are shown in Fig. 3. The specimen shown in Fig. 3(a) was used in tensile tests at 293 and 373 K and the specimen shown in Fig. 3(b) was in 223 K. The effect of stress concentration due to the pin holes in Fig. 3(b) was negligible (see appendix). A tensile testing machine (AG-I 250 kN, Shimazu Corp.) and video extensometer (DVE-101, Shimazu Corp.) were used in tests at 293 and 373 K, and tensile testing machine (AG-X 250 kN) and extensometer (3541-010M-040M-LT, Epsilon Technology Corp.) were used at 223 K for loading and measuring strain. The test at 373 K was performed in a thermostatic chamber (TCE-N300, Shimazu Corp.) and at 223 K was in dry ice-alcohol.
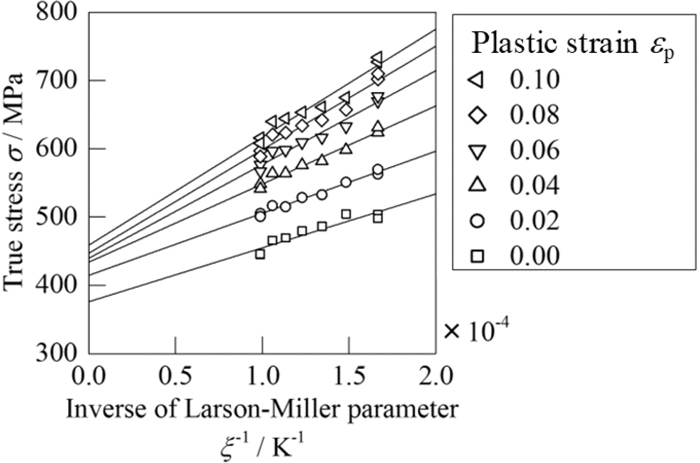
We determined the material parameters of the KM model based on the results of the tensile tests described above. To calculate the athermal stress σa, we obtained the relationships between the functions of the experimental condition, i.e., the plastic strain rate
ε
˙
p
and temperature T during tensile process, Larson-Miller (LM) parameter
ξ=Tln(
ε
˙
LM
/
ε
˙
p
)
(
ε
˙
LM
is a constant) and flow stress σ obtained by tensile tests for each plastic strain εp. The constant
ε
˙
LM
was set to
ε
˙
LM
= 20 s−1, since it is conventionally used in steels.22,23,24) Extrapolating the experimental flow stress σ to a sufficiently large LM parameter ξ yielded athermal stress σa.
Next, to calculate the material parameters related to the interstitial hardening: threshold stress
σ
ˆ
I
and normalized activation energy g0I, we obtained the relationship between the function
E
I
obtained from experimental conditions (i.e., plastic strain rate
ε
˙
p
and temperature T during the tensile process),
E
I
=
[
kT
μ
b
3
ln(
ε
˙
0I
ε
˙
p
)
]
1/
q
I
, and the function
F
I
obtained from yield stress
σ
y
,
F
I
=
[
σ
y
-
σ
a
μ
]
p
I
, where
ε
˙
0I
= 108 s−1, pI = 0.5, and qI = 1.0.25,26) The slope and intercept obtained from the linear regression of the relationship between
F
I
and
E
I
yielded the threshold stress
σ
ˆ
I
and normalized activation energy g0I.
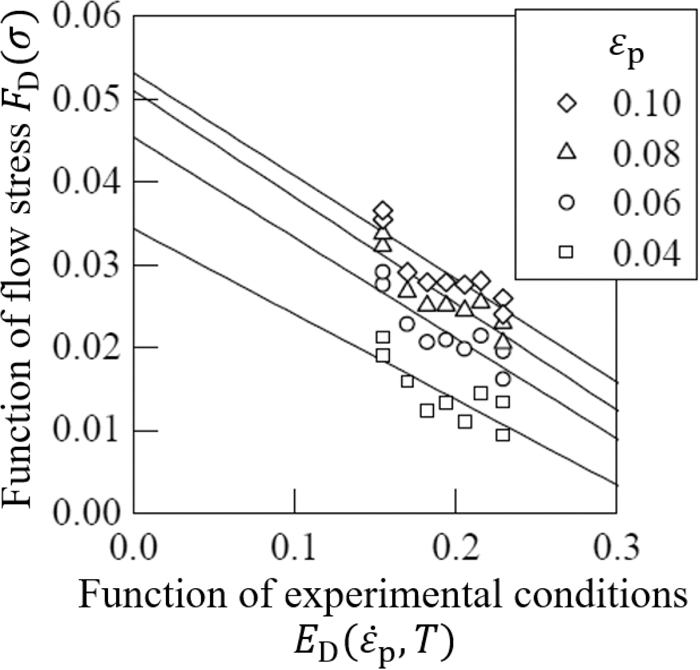
Finally, to calculate the material parameters related to deformation hardening, threshold stress
σ
ˆ
D
, and normalized activation energy g0D, we obtained the relationship between the function
E
D
obtained from experimental conditions,
E
D
=
[
kT
μ
b
3
ln(
ε
˙
0D
ε
˙
p
)
]
1/
q
D
, and the function
F
D
obtained from the stress for each plastic strain,
F
D
=
[
σ-
σ
a
μ
-
s
I
(
ε
˙
p
,T)
σ
ˆ
I
μ
0
]
p
D
, where
ε
˙
0D
= 108 s−1, pD = 0.5 and qD = 1.5.25,26) The slope and intercept obtained from the linear regression of the relationship between
F
D
and
E
D
yielded the threshold stress
σ
ˆ
D
and normalized activation energy g0D.
3.3. Crosshead Holding Tests
To obtain the stress relaxation behavior, we performed crosshead holding tests under the following conditions. The specimen shown in Fig. 3(a) was used. Tensile processes in which the specimen was tensile deformed were performed until the total strain of the specimen reached 0.050, followed by a stress relaxation process in which the crosshead was sustained for a predetermined duration. The strain rates for the tensile process were 6.0 × 10⁻⁶, 6.0 × 10⁻⁴, 6.0 × 10⁻³ and 6.0 × 10⁻² s−1 at 293 K. The duration in which the crosshead was sustained was 39600 s (at the test condition in which the strain rate during the tensile process was 6.0 × 10⁻³ s−1) and 30 s (under the other test conditions). Experimental equipment is same with tensile tests explained in Sec. 3.2.
Note that the procedure of the crosshead holding test was differ from a standard of stress relaxation test, ASTM E328-13. The standard recommends to reduce the total strain of the specimen during stress relaxation tests so as to suppress the increase in the total strain due to the elastic deformation of the tensile testing machine when performing the stress relaxation test with a constant crosshead displacement. However, when the total strain is reduced, it becomes difficult to separate whether the stress reduction during the stress relaxation test is due to the stress relaxation phenomenon or elastic unloading corresponding to reduction in total strain. In order to avoid this problem, the crosshead displacement was maintained to be constant in this study.
4. Results
4.1. Determination of Parameters for KM Model
Figure 4 shows the stress-strain curves obtained from the tensile test at the strain rates of 6.0 × 10⁻⁶, 6.0 ×10⁻⁵, 6.0 × 10⁻⁴, 6.0 × 10⁻³ and 6.0 × 10⁻² s−1 for the temperature of 293 K and at 6.0 × 10⁻⁴ s−1 for the temperature of 223 and 373 K . The increase in strain rate or decrease in temperature increase the flow stress. In the following sections, we determined the parameters of the KM model based on the stress-strain curves.
Figure 5 shows the relationship between the LM parameter ξ and flow stress σ. The flow stress was plotted for each 0.02 plastic strain. The true stress σ at ξ−1 = 0 obtained via linear regressions was determined as athermal stress; σa = 562(0.002 + εp)0.0742. The increase of the athermal stress with plastic strain has been observed in some kinds of steels.27) due to increase in dislocation density by plastic deformation.16,23)
Figure 6 shows the relationship between
E
I
=
[
kT
μ
b
3
ln(
ε
˙
0I
ε
˙
p
)
]
1/
q
I
and
F
I
=
[
σ
Y
-
σ
a
μ
]
p
I
. The slope and intercept obtained from the linear regression of these plots provided the following material constants:
σ
ˆ
I
= 250 MPa and g0I = 0.317.
Figure 7 shows the relationship between
E
D
=
[
kT
μ
b
3
ln(
ε
˙
0D
ε
˙
p
)
]
1/
q
D
and
F
D
=
[
σ-
σ
a
μ
-
s
I
(
ε
˙
p
,T)
σ
ˆ
I
μ
0
]
p
D
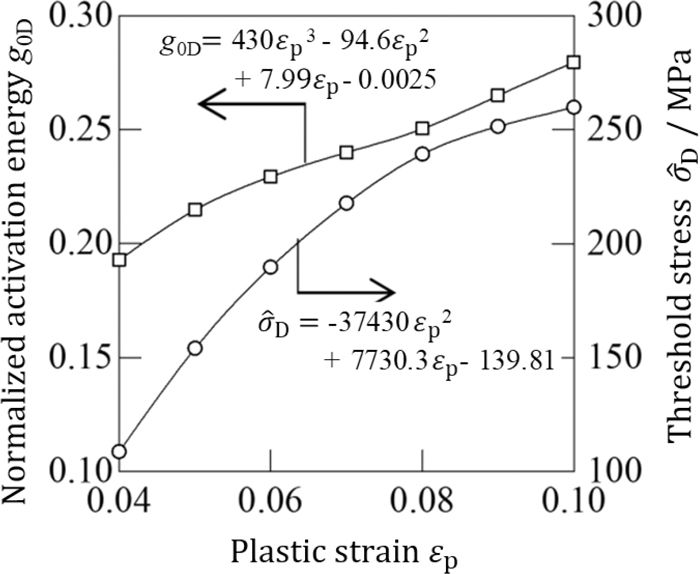
. The slope and intercept obtained from linear regression for each plastic strain provided the change in material constants, threshold stress on deformation hardening
σ
ˆ
D
, and normalized activation energy on deformation hardening g0D, with the plastic strain, as shown in Fig. 8. The change in threshold stress on deformation hardening
σ
ˆ
D
and normalized activation energy on deformation hardening g0D with plastic strain εp are interpolated with quadratic and cubic function, respectively.
4.2. Comparison between Measured and Predicted Stress Relaxation Behaviors
Figure 9 shows the change in the total, plastic, and elastic strains (Fig. 9(a)) and their rates (Fig. 9(b)), obtained from the crosshead holding tests and predicted by the KM model. During the tensile process, the increase in the total strain increases the stress σ (Fig. 9(a) blue line) and plastic strain εp (Fig. 9(a) red line). This behavior has been expressed by the original KM model based on Eq. (5).22,23,24) During stress relaxation process, the stress σ decreases with time elapsing (Fig. 9(a) blue line). The plastic strain rate
ε
˙
p
decreases gradually with time (Fig. 9(b) red line). This behavior is expressed by the proposed KM model based on Eq. (14).

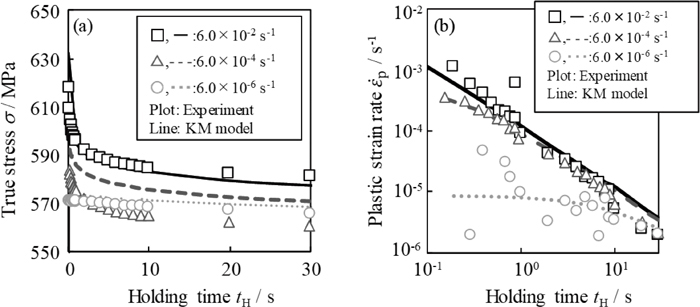
Figure 10 shows the measured and predicted results of the crosshead holding test during stress relaxation for various plastic strain rates
ε
˙
p
during the tensile process. The stress decreases with time. The decrease in stress σ during stress relaxation increases with the plastic strain rate
ε
˙
p
during the tensile process. Figure 10(b) shows the change in the plastic strain rate
ε
˙
p
with time during stress relaxation. Increasing the plastic strain rate
ε
˙
p
during the tensile process increases the plastic strain rate
ε
˙
p
in the early stage of stress relaxation. The plastic strain rate
ε
˙
p
during stress relaxation decreases with the holding time tH. The difference in the plastic strain rate
ε
˙
p
during stress relaxation for each plastic strain rate during the tensile process decreases with the holding time. Figures 10(a) and 10(b) show that the prediction by the proposed KM model matches the experimental results.
5. Discussion
5.1. Comparing in Accuracy of Prediction
To discuss the accuracy of the prediction, we compared the error between the measured and estimated stress relaxation behaviors of the KM model with the logarithmic law.9) The logarithmic law expresses the stress relaxation behavior as follows:
|
σ=
σ
0
-αln(
1+βexp(λ
t
H
)
t
H
)
| (15) |
where
σ0,
α,
β, and
λ are material constants. We describe the stress relaxation behavior using the logarithmic law by fitting
Eq. (15) to the measured stress relaxation behavior obtained from the crosshead holding test under the condition that the strain rate during the tensile process was 6.0 × 10
−3 s
−1 and the holding time was 39600 s. By the fitting, we determined the material constants
σ0,
α,
β, and
λ to minimize the residual sum of squares in the range of the holding time from
tH = 0 to 39600 s.
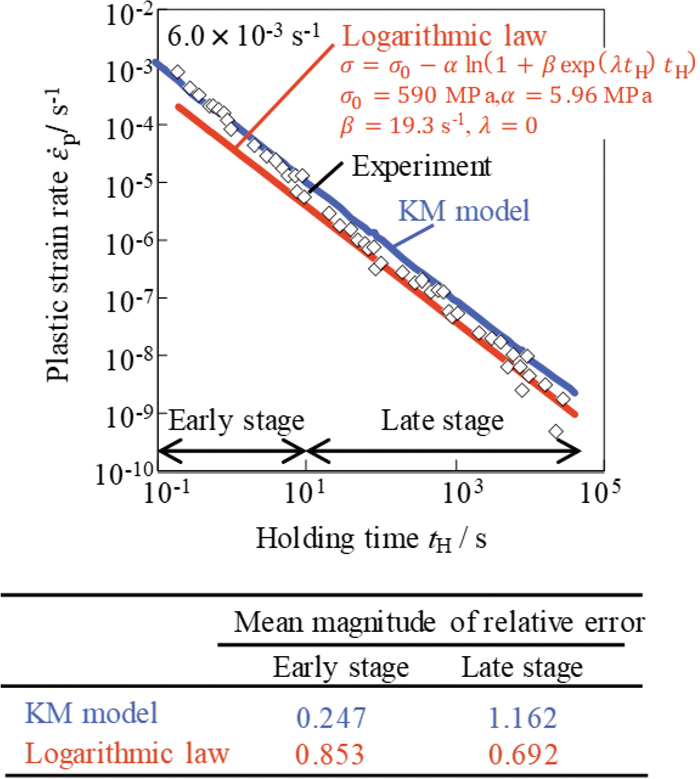
Figure 11 shows the change in the plastic strain rate
ε
˙
p
during the stress relaxation obtained under the condition that the strain rate during tensile process was 6.0 × 10
−3 s
−1 and the holding time was 39600 s. The figure shows the stress relaxation behaviors measured during the crosshead holding test, predicted using the KM model, or described using the logarithmic law. Both the KM model and logarithmic law indicate the decrease in the plastic strain rate
ε
˙
p
as the holding time
tH increases. The table inserted in
Fig. 11 shows mean magnitude of relative errors between the measured stress relaxation behavior and the stress relaxation behavior obtained from the models during the early stage (the holding time within 10 s) and late stage (the holding time since 10 s) of stress relaxation. The relative error RE was calculated based on
|
ε
˙
p
(Exp.)-
ε
˙
p
(Model.)
|/
ε
˙
p
(Exp.)
, where
ε
˙
p
(Exp.) is measured, and
ε
˙
p
(Model.) is the calculated plastic strain rate. The mean magnitude of relative error was time average of the relative error RE during the each stage. The inserted table shows that the accuracy of the prediction during early stage of stress relaxation using KM model is more favorable than that using logarithmic law.
Figure 10(b) shows that the plastic strain rate during stress relaxation is significantly affected by the plastic strain rate during the tensile process especially when the holding time is about within 10 s, which corresponds to the early stage depicted in Fig. 11. Therefore, it is possibly to say that the proposed KM model can describe the strain rate dependence of stress relaxation with higher accuracy than the logarithmic law during the early stage.
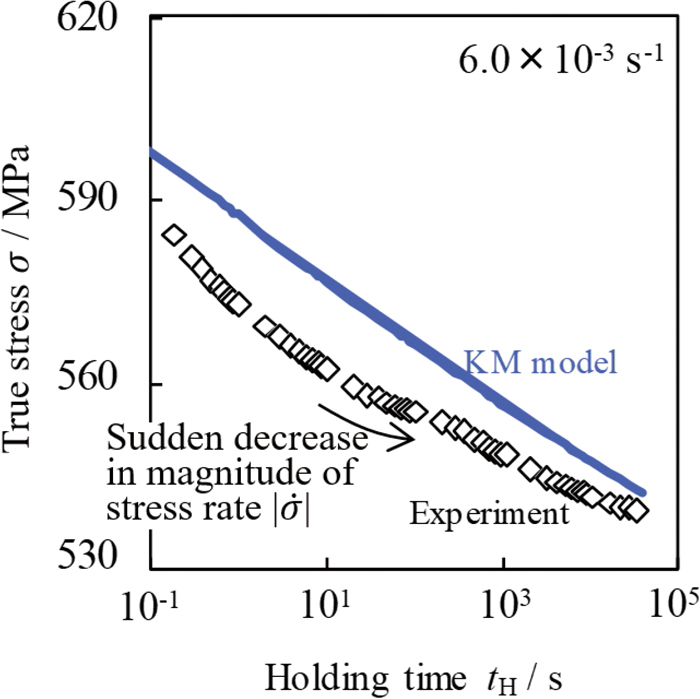
5.2. Applicable Conditions of Proposed Model
In this section, it is discussed why the prediction accuracy during the early stage is higher than that during the late state when applying the KM model. Figure 12 shows the relationship between stress σ and holding time tH during the stress relaxation. The stress relaxation behavior predicted by the KM model is linear. However, the measured stress relaxation behavior shows a decrease in the slope around a holding time tH of 10 s, which corresponds to a sudden decrease in the magnitude of the stress rate
|
σ
˙
|
or plastic strain rate
ε
˙
p
. Although the KM model can predict the decrease in the plastic strain rate
ε
˙
p
with holding time tH, as shown in Fig. 10(b), the KM model cannot predict the sudden decrease in the magnitude of the stress rate
|
σ
˙
|
or plastic strain rate
ε
˙
p
, as shown in Fig. 12. The decrease of plastic strain rate
ε
˙
p
is due to the decrease in the mobile dislocation density ρm and/or average dislocation velocity v because the plastic strain rate
ε
˙
p
is proportional to the product of mobile dislocation density ρm and average dislocation velocity v; Orowan’s equation
ε
˙
p
= Aρmv. Therefore, the deviation of plastic strain rate
ε
˙
p
between the measured and predicted stress relaxation behavior around holding time tH of 10 s would be due to sudden occurrence of immobilization or disappearance of mobile dislocations.
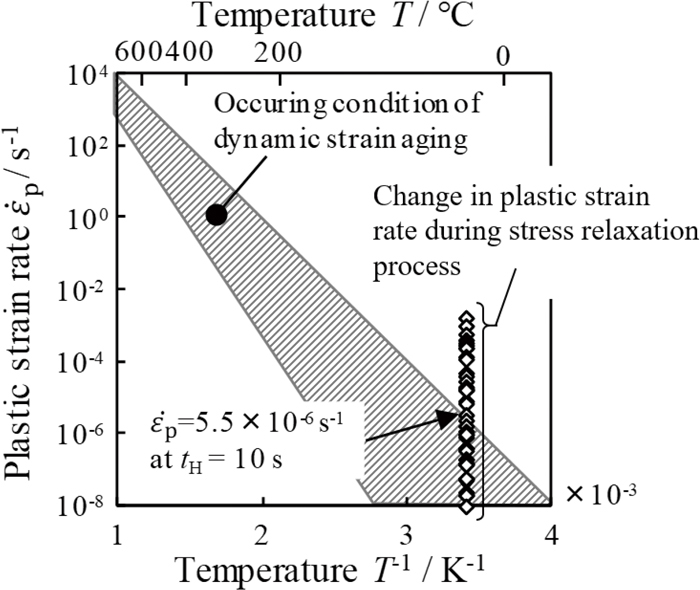
The immobilization or disappearance of mobile dislocations are caused by interaction between dislocations and solute atoms (such as dynamic strain aging), and/or interaction among accumulated dislocations (such as pile-up to grain boundaries or second phase or annihilation of dislocations). However, we speculate that one of the main causes of the immobilization of mobile dislocations is dynamic strain aging through the following discussion. Figure 13 shows the ranges of temperature and plastic strain rate where dynamic strain aging by solute carbon occurs in ferrite.28) The plots in Fig. 13 show the plastic strain rate
ε
˙
p
and temperature T measured from the crosshead holding test under the condition that the plastic strain rate during the tensile process is 6.0 × 10⁻³ s−1 and the holding time is 39600 s. The plastic strain rate
ε
˙
p
decreases as the holding time tH increases, which satisfies the condition where dynamic strain aging occurs around a holding time of 10 s. The holding time of 10 s corresponds to the holding time in which the sudden decrease in the magnitude of the stress rate
|
σ
˙
|
or plastic strain rate
ε
˙
p
(Fig. 12) occurs. Therefore, we speculate that dynamic strain aging is the one of the main causes of immobilization of mobile dislocations, which results in sudden decrease in the magnitude of the stress rate
|
σ
˙
|
or plastic strain rate
ε
˙
p
. Consequently, the sudden decrease in the magnitude of the stress rate
|
σ
˙
|
or plastic strain rate
ε
˙
p
causes the error between the measured and calculated stress relaxation behaviors.
The plastic strain rate
ε
˙
p
during stress relaxation, which determines the stress relaxation, is caused by the slip motion of dislocations. Therefore the prediction of the stress relaxation behavior is difficult because various strengthening mechanisms that affect the slip motion of dislocations must be considered. The logarithmic law does not consider various strengthening mechanisms. However, the material parameters of the logarithmic law were obtained by fitting the model to a wide range of holding times, from tH = 0 to 39600 s, which results in a low relative error RE in the late stage of stress relaxation, where dynamic strain aging occurs. Meanwhile, the proposed KM model can accommodate various strengthening mechanisms, such as athermal stress, interstitial hardening, and deformation hardening. These material parameters related to the strengthening mechanisms are obtained from tensile tests and assumed to be constant during stress relaxation. Therefore, the material parameters do not include the effects of microstructure changes during stress relaxation, e.g. dynamic strain aging. Consequently, the KM model cannot predict the sudden decrease in the plastic strain rate
ε
˙
p
around a holding time tH of 10 s, owing to dynamic strain aging. Namely, the proposed KM model, in which microstructure changes are assumed to be negligible, can be applied to predict the early stage of stress relaxation, where dynamic strain aging does not occur yet.
The original KM model has been applied for many kinds of metals of which elementally process is based on the thermally activated process of slip motion of mobile dislocations. Therefore the proposed KM model for prediction of stress relaxation behavior could be applied to metallic materials other than the steel sheet used in this study. Especially in metals including solute atoms, dynamic strain aging must be considered to increase prediction accuracy of stress relaxation behavior with the proposed KM model.
6. Conclusion
To predict the stress decreasing behavior during the early stage of stress relaxation, we proposed modifying the KM model, which is obtained based on the following assumptions. First, the initial condition, i.e., the plastic strain rate at the start of stress relaxation is the same as that during the tensile process. Second, the assumption that the material parameters, i.e., athermal stress σa, normalized activation energy g0, frequency factor
ε
˙
0
, and threshold stress
σ
ˆ
, do not vary during stress relaxation. Stress relaxation behaviors are predicted with the proposed model based on the material parameters obtained from tensile tests. Subsequently to validate the accuracy of the proposed model, we compared the error between the measured and calculated stress relaxation behaviors with that of the one of the conventional models; the logarithmic law.
(1) The increase in the plastic strain rate during the tensile process accelerates the stress decrease during the early stage of stress relaxation. The proposed KM model is able to predict this phenomenon.
(2) The proposed KM model estimates stress relaxation behavior with high accuracy during the early stage of the stress relaxation than the logarithmic law. The condition in which the proposed KM model shows high accuracy corresponds to the condition where dynamic strain aging does not occur.
Acknowledgements
This study was supported by grants from the Amada Foundation (AF-2016032).
References
- 1) H. Y. Bong, F. Barlat and M.-G. Lee: Metall. Mater. Trans. A, 47 (2016), 4160. https://doi.org/10.1007/s11661-016-3561-0
- 2) T. Hama, T. Suzuki, Y. Nakatsuji, T. Sakai and H. Takuda: Mater. Trans., 61 (2020), 941. https://doi.org/10.2320/matertrans.MT-M2019283
- 3) M. Takamura, K. Murasawa, Y. Kusuda, Y. Suzuki, T. Hakoyama, Y. Ikeda, Y. Otake, T. Hama and S. Suzuki: J. Phys. Conf. Ser., 1063 (2018), 012123. https://iopscience.iop.org/article/10.1088/1742-6596/1063/1/012123
- 4) K. Hariharan, O. Majidi, C. Kim, M. G. Lee and F. Barlat: Mater. Des., 52 (2013), 284. https://doi.org/10.1016/j.matdes.2013.05.088
- 5) K. Murasawa, H. Komine, Y. Otake, H. Sunaga, M. Takamura, Y. Ikeda and S. Suzuki: Key Eng. Mater., 716 (2016), 948. https://doi.org/10.4028/www.scientific.net/KEM.716.948
- 6) I. Gupta and J. C. M. Li: Metall. Trans., 1 (1970), 2323. https://doi.org/10.1007/BF02643451
- 7) F. Guiu and P. L. Pratt: Phys. Status Solidi, 6 (1964), 111. https://doi.org/10.1002/pssb.19640060108
- 8) G. A. Sargent: Acta Metall., 13 (1965), 663. https://doi.org/10.1016/0001-6160(65)90129-X
- 9) K. Hariharan, P. Dubey and J. Jain: Mater. Sci. Eng. A, 673 (2016), 250. https://doi.org/10.1016/j.msea.2016.07.074
- 10) A. Varma, A. Gokhale, J. Jain, K. Hariharan, P. Cizek and M. Barnett: Philos. Mag., 98 (2018), 165. https://doi.org/10.1080/14786435.2017.1398422
- 11) H. Mecking and U. F. Kocks: Acta Metall., 29 (1981), 1865. https://doi.org/10.1016/0001-6160(81)90112-7
- 12) E. Orowan: Proc. Phys. Soc., 52 (1940), 8. https://doi.org/10.1088/0959-5309/52/1/303
- 13) M. S. Mohebbi, A. Akbarzadeh, Y.-O. Yoon and S.-K. Kim: Mech. Mater., 89 (2015), 23. https://doi.org/10.1016/j.mechmat.2015.06.001
- 14) K. Murasawa, M. Takamura, M. Kumagai, Y. Ikeda, H. Suzuki, Y. Otake, T. Hama and S. Suzuki: Mater. Trans., 59 (2018), 1135. https://doi.org/10.2320/matertrans.M2017380
- 15) L. Xiao and J. Bai: Mater. Sci. Eng. A, 244 (1998), 250. https://doi.org/10.1016/S0921-5093(97)00688-6
- 16) V. I. Dotsenko: Phys. Status. Solidi B, 93 (1979), 11. https://doi.org/10.1002/pssb.2220930102
- 17) E. W. Hart: J. Eng. Mater. Technol., 98 (1976), 193. https://doi.org/10.1115/1.3443368
- 18) G. Taylor: Prog. Mater. Sci., 36 (1992), 29. https://doi.org/10.1016/0079-6425(92)90004-Q
- 19) N. Tsuchida, Y. Tomota and K. Nagai: Tetsu-to-Hagané, 90 (2004), 1043 (in Japanese). https://doi.org/10.2355/tetsutohagane1955.90.12_1043
- 20) H. Conrad: J. Met., 16 (1964), 582. https://doi.org/10.1007/BF03378292
- 21) K. Ueno, K. Murasawa, Y. Suzuki, M. Takamura, T. Hama, T. Hakoyama and S. Suzuki: J. Jpn. Inst. Met., 84 (2020), 326 (in Japanese). https://doi.org/10.2320/jinstmet.J2020026
- 22) N. Tsuchida, H. Moriya, Y. Tomota, O. Umezawa and K. Nagai: ISIJ Int., 40 (2000), 84. https://doi.org/10.2355/isijinternational.40.84
- 23) N. Tsuchida, Y. Tomota, H. Moriya, O. Umezawa and K. Nagai: Acta Mater., 49 (2001), 3029. https://doi.org/10.1016/S1359-6454(01)00197-5
- 24) N. Tsuchida, K. Fukaura, K. Nagai and Y. Tomota: ISIJ Int., 48 (2008), 1020. https://doi.org/10.2355/isijinternational.48.1020
- 25) A. W. Sleeswyk: Scr. Metall., 4 (1970), 355. https://doi.org/10.1016/0036-9748(70)90101-8
- 26) K. Ono: J. Appl. Phys., 39 (1968), 1803. https://doi.org/10.1063/1.1656434
- 27) N. Tsuchida, S. Harjo, T. Ohnuki and Y. Tomota: Tetsu-to-Hagané, 100 (2014), 1191 (in Japanese). https://doi.org/10.2355/tetsutohagane.100.1191
- 28) M. Ohmori, Y. Yoshinaga and T. Kawahata: J. Jpn. Inst. Met., 33 (1969), 730 (in Japanese). https://doi.org/10.2320/jinstmet1952.33.6_730
Appendix
In general, the pin hole on tensile testing specimens may cause stress concentration and local deformation, which affect the results of tensile testing. However, we confirmed through the following finite element (FE) method that the stress concentration due to the pin hole shown in Fig. 3(b) does not affect the measurement of stress-strain relationship.
Figure A1 shows the model in the FE analysis. The dimension of the specimen was the same with that of Fig. 3(b). The specimen was modeled by solid elements. The stress-strain relationship measured by the tensile test at the strain rate of 6.0 × 10⁻³ s−1 (Fig. 4) was applied as the material properties of the specimen. Cylindrical rigid shell elements were arranged in the pin holes of the specimen. The one cylinder was full constraint. The displacement of another cylinder was moved in the longitudinal direction of the specimen with a speed of 1000 mm/s. The analysis was performed using LS-DYNA (version R11.1.0) with the dynamic explicit method. Then we calculated the true stress through the force opposed to the cylinder and the cross-sectional area at the center of the specimen. We also calculated plastic strain through the distance of the two nodes corresponding to the gauge length.
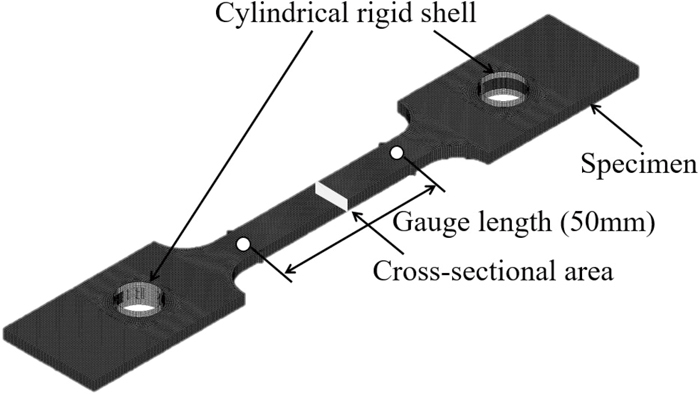
Figure A2 shows the relationship between plastic strain and true stress calculated with abovementioned analysis and measured with tensile testing at strain rate of 6.0 × 10⁻³ s−1. The calculated and measured stress-strain relationships were identical. Therefore, we conducted that the effect of stress concentration is negligible for measurement of stress-strain relationships.