Abstract
In recent years, metal additive manufacturing technology (also known as 3D printing) has achieved dramatic development and has gradually occupied an indispensable position in modern manufacturing. However, the purity and uniformity of the metal powder, which is the raw material for additive manufacturing, generate significant impacts on the performance of the product. Therefore, a rapid analysis method of the steel powders based on laser induced breakdown spectroscopy (LIBS) is investigated for the potential applications in 3D printing process. In the current experiment, two pretreatment methods of the novel adsorbing process and the traditional tableting process are employed for performing comparative study. Through the adsorbing process with conductive tape, the signal intensity of LIBS spectrum has been significantly enhanced. The crater topography demonstrates that the adsorption band samples can effectively overcome the shock wave effect of the laser induced plasma. The calibration curve of LIBS measurement indicates that the pellet samples can be easily affected by the plasma shock wave. Differently, the adsorption band samples are slightly influenced by the plasma shock wave. The determination coefficient and data stability of the calibration curve are better in the condition of adsorption band samples. Through the simulated quantitative analysis with totally 11 artificial steel powder samples, the analytical performance of the two sample pretreatment processes is compared. Manganese (Mn) is selected as the target element with the matrix element of iron (Fe). When compared with the pellet samples, the average value of Relative Error of Prediction (REP) is reduced from 7.73% to 1.36% and the average value of Relative Standard Deviation (RSD) is reduced from 20.34% to 6.22% for the adsorption band samples. Based on the experimental results in the current work, it can be verified that the adsorbing process is a promising sample pretreatment method for steel powders. Moreover, this provides an effective sample pretreatment method for LIBS analysis of steel powder for 3D printing.
1. Introduction
Recent theoretical developments have revealed that metal additive manufacturing technology is a component manufacturing process, which is also called 3D printing. The current technology has been influential in the field due to its simple manufacturing process, low production cost, as well as short research and development cycle. Additionally, it has the advantages of free design, mass customization, waste minimization, and rapid prototyping.1,2,3) Meanwhile, it has been extensively adopted in the field of steel industry,4) aerospace,5) shipbuilding,6) and automotive applications.7) At present, with the development of the additive manufacturing industry, new materials and devices continue to appear. In the future, it will move toward precision improvement, and cost reduction, etc.8) However, a challenging problem that arises in this domain refers to the quality stability of parts. Therefore, it is of importance to explore the composition uniformity of raw materials for the performance of 3D printing parts.9,10)
Although a whole range of different approaches to the problem are available, the uniformity of the composition of the metal powder, the contamination of impurities, the morphological characteristics of the powder, etc. will influence the stability of the 3D metal printing parts. Moreover, it is prone to fluctuations in powder composition during the milling process. On this basis, these constraints make the problem difficult to solve some problems such as element enrichment, segregation, and oxide inclusions in local areas. Thus, a possible solution to the problem at hand is the analysis and control of the raw material powder composition in 3D printing process, which is a critical point to improve the quality and stability of the parts. As we all know, there are several common kinds of powder analysis methods, such as X-ray Fluorescence Spectroscopy (XRF),11) X-ray Tomography (XRT),12) Inductively Coupled Plasmay (ICP),13) Scanning Electron Microscope (SEM),14) Energy Chromatography Element Analysis (EDS)15) and X-ray Fluorescence Spectroscopy (XFS).16)
Nevertheless, the application of laser-induced breakdown spectroscopy to analyze the chemical elements of materials is widely regarded as an efficient method.17) It is characterized by not being restricted by the sample state, multi-element simultaneous analysis, fast analysis speed, and little sample damage.18) Various papers have been published to report the application of rapid analysis of powder samples, such as coal powder,19,20) soil,21,22) plants,23) food,24) cosmetic powder,25) geology26) and medicine.27) Especially in metal powder analysis of LIBS, K. Novotný et al.28) have made use of embedding hard tungsten carbide into the resin, and pressing the powder material with a hydraulic press to prepare particles, which can quantitatively determine the element of niobium, titanium, tantalum, and cobalt. Marco Aurelio Sperança et al.29) have proposed a new method for quantifying Al, Cr, Fe, Mg, Mn, and Ni in nickel-containing minerals through LIBS. Firstly, solid mineral samples are mixed, which are ground grinding into a fine powder. Water in different proportions is used to make a slurry. Then, polyvinyl alcohol solution is added. Secondly, after being placed in an oven at 50°C for 2 hours, the sample fixed in the polymer film is subjected to be adopted for exploring chemical component, aiming to reduce signal fluctuations and improve the uniformity of the sample. V. N. Lednev et al.30) have used double-sided tape to attach loose metal powder. As a result, LIBS with a fast-real-time on-site analysis function can better match the automatic, fast, and direct-production characteristics of 3D printing.31)
The reason is that most of the preparation methods for powder samples is difficult to achieve rapid online measurement. Therefore, we present a new method for sample preparation to enhance the sensitivity and stability of signal detection and perform well in preventing powder from being washed away. In this study, it is shown that the diagram of the sample pretreatment processes and pictures of real products are given, respectively, the pellet sample and the adsorption band sample. The enhancement of LIBS spectrum signal is discussed by improving sample preparation method. The different crater topography formed by the tableting process and adsorbing process of the original powder after being excited by the laser can be observed. The trend of calibration curves was analyzed. A total of nine samples from S1 to S9 are cross-validated. The value of REP and RSD that affects precision and uncertainty measurement can be obtained. Finally, we find that all aspects of the adsorption band samples generate the better results. More importantly, the adsorption band is easier to realize continuous and rapid sample preparation process, and it is more convenient to apply to industrial sites. The results indicate that the new preparement method exerts a critical role in the rapid analysis of steel powder for 3D printing based on laser-induced breakdown spectroscopy.
2. Experimental Setup
2.1. Device Configuration
Figure 1 shows the schematic diagram of LIBS system which is employed to measure the steel powder samples in the current work. The pulsed laser beam is generated by a Nd: YAG nanosecond laser (LS-2134UTF, LOTIS TII Co. Ltd., Republic of Belarus). At Q-switched mode of the laser, the diameter of laser beam is 6 mm and the pulse width is 5.4 ns. In this experiment, the laser is operated at 1064 nm with the pulse energy of 20.5 mJ and the frequency of 10 Hz. Besides, the laser beam is reflected by a mirror (reflectivity >99% at 1064 nm), and is then passed through a long pass filter (>450 nm), and is finally concentrated on the sample by a quartz lens (focal length 200 mm). The plasma light is collected in the reverse direction. It is reflected by the long pass filter and focused on the end of an optical fiber by a quartz lens (focal length 120 mm). After transmission through the optical fiber, the plasma light is dispersed by a grating spectrometer (NP-250-2M, SOL Instrument Co. Ltd., Republic of Belarus), which is detected by an ICCD (iStar DH334T-18U-03, Andor Technology Co. Ltd., England). A grating with 3600 lines per millimeter was installed in the spectrometer. Thus, the detection system has achieved a spectral resolution of 0.0097 nm in the wavelength range of 400–410 nm. In addition, the trigger timing between the devices is controlled by a delay generator (Model DG645, Stanford Research System Co. Ltd., USA). The detection data of ICCD is transferred to a computer for storage and analysis. In this work, the parameters of LIBS acquisition are set as: delay time 3000 ns, gate width 1000 ns, 50 times accumulation and 5 repeated experiments under each condition.

In this work, the steel powder samples were made of pure iron (Fe) powder and pure manganese (Mn) powder. The Fe powder and Mn powder were provided by Beijing Research Institute for Nonferrous Metals, China. The certified purity of Fe powder reaches 99.995% and the certified purity of Mn powder is 99.99%. With the size between 0.5 μm and 10 μm, both the powders are spherical particles. The artificial steel powders were mixed by weighting a certain mass of pure Fe powder and pure Mn powder respectively. In the meanwhile, the powders were mixed in a ball mill for 2 hours to ensure uniform mixing of the two powders. Table 1 shows the number of the artificial steel powders and the corresponding Mn and Fe content. For example, the S6 sample was made by mixing 3 g of pure Mn powder and 97 g of pure Fe powder in the ball mill for 2 hours. Therefore, the theoretical value of Mn content in the S6 sample is 3%.
Table 1. Elemental composition of the artificial steel powders.
| Sample No. | Content (%) |
|---|
| Mn | Fe |
|---|
| S0 | 0.0 | 100.0 |
| S1 | 0.5 | 99.5 |
| S2 | 1.0 | 99.0 |
| S3 | 1.5 | 98.5 |
| S4 | 2.0 | 98.0 |
| S5 | 2.5 | 97.5 |
| S6 | 3.0 | 97.0 |
| S7 | 3.5 | 96.5 |
| S8 | 4.0 | 96.0 |
| S9 | 4.5 | 95.5 |
| S10 | 5.0 | 95.0 |
In this study, these artificial steel powders were further pretreated into different states for LIBS measurement. Figure 2 shows the diagram of two pretreatment processes employed in the current work. Specifically, the first method is called tableting process. The original steel powder sample is put into the mold and then pressed into the pellet sample through 2k N pressure. This method has already been extensively applied in the LIBS measurements of powder samples, such as soils32) and anthracites.33,34) The other method is named as adsorbing process. The conductive tape is employed in the proposed method. Conductive tape is usually used in the pretreatment of electron microscope samples. It is made by uniformly coating highly conductive adhesive on both faces of copper band (mostly the thickness of the adhesive is a few microns). The conductive tape can bind the powders to form a dense sample surface. Additionally, the conductive tape can conduct electric charge and avoid the charging and discharging effects of thin samples. In this work, the steel powders were sprayed on the one face of the conductive tape and the surface with steel powders was compacted by a cylindrical tool. Subsequently, the other face of the conductive tape was pasted on an aluminum band with the thickness of 2 mm. Finally, the steel powders pretreated by the adsorbing process are called adsorption band samples, as displayed in Fig. 2. To the best of our knowledge, the adsorption band method is the first time to be investigated for the LIBS measurement of steel powder. From the perspective of the LIBS application in 3D printing filed, the adsorption band method shows great potential in industrial application. In comparison with the tableting process, the adsorbing process uses simpler tools, which is conducive to the high efficiency and automation of sample pretreatment. It is significant to explore the effect of adsorbing process on the results of LIBS measurement of steel powders.

3. Results and Discussion
3.1. Signal Enhancement
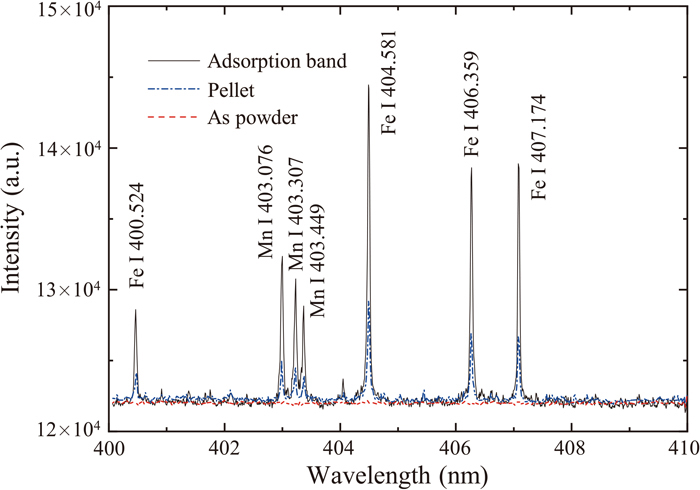
In this study, the steel powder samples were measured in the three states. The first state is directly spread on the sample stage as the original powder state, the second state is the pellet sample by the tableting process, and the third state is the adsorption band sample by the adsorbing process. For the sake of clarity, the photos of the three states are shown in Fig. 3. To be specific, Fig. 3(a) shows the original powder sample without any pretreatment. Figure 3(b) presents the original steel powder pressed into a tablet form a mold. Figure 3(c) exhibits the powder adsorbed by conductive tape and turns into the adsorption sample. Besides, the dense top layer can be made by the above-mentioned two sample preparation methods. Figure 4 shows the recorded spectra from different samples. Several sharp spectral lines can be distinguished from these spectra. At the same time, the related parameters of the spectral lines are listed in Table 2 according to the NIST database. It can be observed from Fig. 4 that the signals of the three samples are significantly different. In the three states of the sample, the iron spectrum at different wavelengths and the manganese spectrum all show different signal intensities. For example, LIBS can not obtain effective spectral signal in the powder state. However, useful signal lines can be obtained when the original powder sample goes through the tableting process or adsorbing process. In terms of the original powder, the overall signal is relatively flat and there is no obvious peak attribute to the noise with continuous background, which is impossible to be explored. In the state of the pellet sample, the isolated peak is distinct, and the spectral signal is enhanced compared to the original powder. Regarding the adsorption band, the spectral intensity has been remarkably improved compared with other sample preparation methods. Obviously, the peak of the spectral line is higher. The individual atomic spectrum lines can also be clearly distinguished.
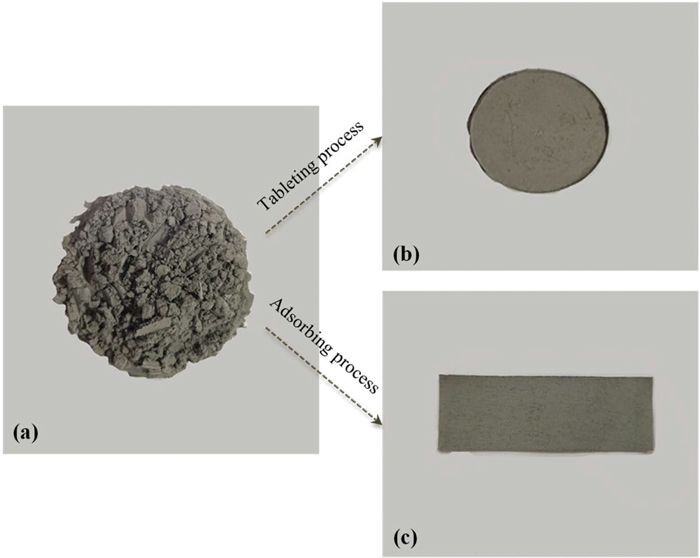
Table 2. Parameters of the atomic emission lines and signal enhancement.
| Wavelength (nm) | Ei (cm−1) | Ek (cm−1) | Aki (107 s−1) | IT/IP |
|---|
| Fe I 400.524 | 12560.93 | 37521.16 | 2.04 | 3.1 |
| Fe I 404.581 | 11976.24 | 36686.18 | 8.62 | 3.1 |
| Fe I 406.359 | 12560.93 | 37162.75 | 6.65 | 3.4 |
| Fe I 407.174 | 12968.55 | 37521.16 | 7.64 | 3.6 |
| Mn I 403.076 | 0 | 24802.25 | 1.7 | 3.4 |
| Mn I 403.307 | 0 | 24788.05 | 1.65 | 3.4 |
| Mn I 403.449 | 0 | 24779.32 | 1.58 | 3.5 |
Symbol annotations: Ei: Energy of lower level, Ek: Energy of upper level, Aki: Transition probability of spectral line, IT/IP: Signal enhancement ratio between adsorption band samples and pellet samples.
In addition, the signal enhancement ratio between adsorption band samples and pellet samples (IT/IP) is also listed in Table 2. According to Fig. 4 and Table 2, the intensities of the spectral lines are enhanced 3–4 folds by the sample pretreatment with adsorbing process. It is significant to discuss the reason for the above experimental results. The reason for the significant difference in the spectral signal is considered to be the shock wave effect of plasma during LIBS excitation. The shock wave of plasma will disperse the powder from the focal area when the powder is in a loose state. As a result, in the original powder state, the laser beam cannot continue to interact with the sample materials, leading to a weaker spectral signal during LIBS measurement. To improve the signal, it is vital to make the powder sample possess a dense surface. According to the experimental results presented in Fig. 4, both the pellet method and adsorption band method can significantly improve the signal quality. However, the adsorption band method exhibits a stronger signal. This result indicates that the adsorption band sample prepared by the adsorbing process is more suitable for LIBS excitation. Through the adsorbing process, the powder particles are fixed on the conductive tape. Due to The metal powder is bound to the surface of the aluminum plate substrate through a layer of binder. The interaction process between the laser beam and the surface of the adsorption band sample is closer to the interaction process between the laser beam and the surface of the solid sample. The adsorption band method yields a dense surface for LIBS measurement which significantly enhances the signal intensity. In consequence, a dense surface generates a significant effect on LIBS measurement of powder sample, which is the reason accounting for the difference in signals obtained by the three sample preparation methods.
3.2. Crater Topography
To figure out the surface differences between the pellet samples and the adsorption band samples, a scanning electron microscope (SEM, model: TM4000) is employed to investigate the crater topography of LIBS. Figure 5 shows the SEM images of pellet sample and adsorption band sample. A definite difference in crater topography was observed from the samples surface of different pretreatment processes. SEM images of the pellet sample are illustrated in Figs. 5(a) and 5(b). SEM images of the adsorption band sample are shown in Figs. 5(c) and 5(d). In addition, the upper right corner of each figure is a photo which was taken by an optical microscope. According to Figs. 5(a) and 5(c), the surface of the pellet sample is loose and non-uniform, while the surface of the adsorption band sample is dense and uniform. At the same time, the photos of the optical microscope show that the surface of the pellet sample contains more holes when compared with the surface of the adsorption band sample. Based on parts b and d of Fig. 5, there are the laser craters of pellet sample and adsorption band sample. According to Fig. 5(b), the laser crater of the pellet sample is irregular in shape, and the edge of the laser crater is characterized by an obvious laser shock. By contrast, the laser crater of the adsorption band sample presents a relatively regular spot shape without obvious laser shock characteristic. The same characteristic of laser craters can also be observed in the optical micrographs, as shown in the right corner of Figs. 5(b) and 5(d). The reason for the difference in crater topography is considered to be the different surface states of the samples.

Because continuous contact based on the electrostatic adsorption force between the powder and the substrate during the laser irradiation, the steel powders form a dense surface on the adsorption band sample. During the plasma excitation and evolution, the surface of the sample is less influenced by the shock wave. And the interaction process between laser beam and sample material is comparatively sufficient and stable. Therefore, the laser crater of the adsorption band sample is close to that of the solid sample. However, in the pellet sample, the steel powders are combined relying on the residual force of the tableting process. This combined state is unstable, which is not difficult to be destroyed by the plasma shock wave. As a result, the interaction process between the laser beam and the sample material tends to be affected by the shock wave. The laser crater shows irregular shape and is accompanied by material splash marks in the edge area. The obtained result demonstrates that the surface of the adsorption band sample is more suitable for LIBS measurement.
3.3. Calibration Curves
The calibration curves for the tableting and adsorbing sample pretreatment processes are compared in the current work. Figure 6 shows the calibration curves of LIBS measurement for steel powder in different states. The measurement for each sample was repeated 5 times. The data points are the mean values and the error bars are the standard deviations of 5 measurements. All of the data obtained from 10 samples were adopted for establishing the above calibration curves. Furthermore, Mn I 403.307 nm and Fe I 404.581 nm were selected to calculate the intensity ratio of LIBS measurement. As illustrated in Fig. 6, the determination coefficient (R2) of the calibration curve is 0.910 for the pellet samples, whereas it is 0.998 for the adsorption band samples. In this perspective, the trend of the data points is clearer in the condition of adsorption band samples. Based on Fig. 6(a), several data points deviate from the fitted calibration curve, which leads to a lower R2 value. It is considered that the LIBS measurement of pellet samples is affected by the plasma shock wave. Because the laser ablation process is accompanied by the splashing of steel powder, the plasma excitation and evolution process can fluctuate in the state of the pellet sample. Hence, the intensity ratio of LIBS measurement is also affected by the plasma shock wave. Figure 6(b) shows the calibration curve of adsorption band samples. Obviously, all the data points are near the fitted calibration curve. This result indicates that the LIBS quantitative analysis of the adsorption band samples is less affected by the plasma shock wave.

In addition, as for the error bar, the results of pellet samples are more discrete than adsorption samples. This result indicates that large irregular craters are formed on the surface of the pellet sample. There are a lot of sample splash particles around the crater, seriously affecting the detection results of LIBS spectral signals. Briefly, this phenomenon can also be well explained according to the crater topography, which shows that the degree of signal fluctuation is closely associated with laser ablation.
By comparing the slope of the calibration curve, it can be discovered that the slope of the pellet sample is greater than that of the adsorption band sample. As the content of manganese continues to increase, the trend of the slope gradually becomes saturated. Apparently, it is reported that LIBS has caused the effect of self-absorption, contributing to a decrease in the slope of the calibration curve.35,36,37) These effects include not only the resonance spectrum of manganese selected in this paper which is easily affected by the self-absorption effect, but also the matrix effect is closely related to the sample preparation process for powder samples. In consequence, the intensity and stability of the spectral signal obtained by the proposed method are weaker than others. Therefore, it is impossible to obtain a satisfactory calibration curve of the pellet sample. Meanwhile, it is not suitable for performing LIBS real-time online quantitative analysis.
3.4. Measurement Uncertainty and Precision
Using the cross-validation method to evaluate the prediction model of Mn element concentration,38) one of the sample(from S1 to S9) is taken as an unknown sample and the remaining samples are taken as calibrated samples to perform cross validation. The predictive test with S6 is taken as the tested sample and the other samples are taken as the calibrated samples, as shown in Fig. 7. Moreover, the predictive test for pellet samples is shown in Fig. 7(a) and the predictive test for adsorption band samples is shown in Fig. 7(b). R2 of the pellet samples model is 0.932, whereas R2 of the adsorption band samples model is 0.998. Thus, the data points have a better fit of adsorption band samples. To explain the observed activity, we might consider that the analysis capability of artificial steel samples is improved by employing the sample preparation method.

To quantitatively compare measurement uncertainty and precision between tableting process and adsorbing process sample pretreatment method, the statistic factors like relative error of prediction (REP) and the relative standard deviation (RSD) were calculated.39) REP is used to evaluate the precision of measurement and RSD is applied to evaluate the uncertainty of measurement. Uncertainty is defined as the degree of agreement between the measured experimental value and the true value. Therefore, the REP was computed according to Eq. (1).40)
|
%REP=
100%
Y
m
1
N
∑
i=0
N
(
Y
s
-
Y
p
)
2
| (1) |
where
Ym is the average reference concentration of the predicted sample,
YP denotes the prediction concentration predicted using the established calibration model of the
ith sample,
Ys is the reference concentration of the
ith sample and N represents the total number of samples. For a fine calibration model, REP should be as small as possible.
Precision describes the degree of coordination between single test data when repeated measurements. Thus, RSD was calculated using the following Equation:
|
s=
[
∑
(
x
i
-M
)
2
n-1
]
2
%RSD=100%×[
s
M
]
| (2) |
where
xi is the data measured by LIBS,
M is the average of this set of data,
n is obtained by measuring parallel data and
s is the standard deviation of the evaluation of the measurement precision.
Tables 3 and 4 show a comparison of RSD and REP for the pellet samples and the adsorption band samples. The REP values and RSD values of the adsorption band samples which are applied to represent uncertainty and precision are lower than the pellet samples. The smallest value of REP for the pellet sample is 0.1%, which is 0.3% for the adsorption band sample. On the contrary, the largest value of REP for them was 14.4% and 5.5% respectively. For the same reason, the smallest value of RSD for the pellet sample is 17.9%, which is 4.8% for the adsorption band sample. Meanwhile, the largest value of RSD for them was 24.8% and 8.7% respectively. Moreover, the average value of REP is reduced from 7.73% to 1.36% and the average value of RSD is decreased from 20.34% to 6.22% through adsorbing process. These results indicate that the improvement of measurement uncertainty and precision is attributed to the preparation method of the adsorption band process. Therefore, the result demonstrates that the use of adsorbing process is beneficial for better analytical results of manganese in steel powder.
Table 3. Measurement uncertainty and precision of pellet samples.
| Tested sample | Measured value (%) | REP (%) | RSD (%) |
|---|
| S1 | 0.5464 | 9.3 | 17.9 |
| S2 | 0.9059 | 9.4 | 16.6 |
| S3 | 1.7167 | 14.4 | 24.8 |
| S4 | 2.1435 | 7.2 | 19.2 |
| S5 | 2.5025 | 0.1 | 22.1 |
| S6 | 2.7928 | 6.9 | 20.0 |
| S7 | 3.8238 | 9.3 | 20.3 |
| S8 | 3.8489 | 3.8 | 19.2 |
| S9 | 4.9149 | 9.2 | 20.7 |
Table 4. Measurement uncertainty and precision of adsorption band samples.
| Tested sample | Measured value (%) | REP (%) | RSD (%) |
|---|
| S1 | 0.4985 | 0.3 | 6.3 |
| S2 | 0.996 | 0.4 | 4.8 |
| S3 | 1.5065 | 0.4 | 5.0 |
| S4 | 1.9709 | 1.5 | 8.1 |
| S5 | 2.6376 | 5.5 | 6.0 |
| S6 | 3.008 | 0.3 | 8.7 |
| S7 | 3.3484 | 0.4 | 5.5 |
| S8 | 3.8288 | 0.4 | 5.1 |
| S9 | 4.6346 | 3.0 | 6.5 |
4. Conclusion
To conclude, the performance of conventional and novel sample pretreatment methods of the analysis of manganese in steel powders was in this study. According to the experimental results, the following conclusions can be drawn in the following aspects.
(1) The LIBS spectra of pellet samples and adsorption band samples were compared. The intensities of Mn and Fe spectral lines are significantly enhanced by the sample pretreatment with the adsorbing process. 3–4 folds signal enhancement has been obtained by adopting the novel sample pretreatment method. Through the investigation into the topography of laser craters with SEM, the dense surface formed by the adsorbing process is contributed to the signal enhancement of LIBS measurement.
(2) The calibration curves of pellet samples and adsorption band samples, which were prepared for 11 artificial steel powders, were established based on the LIBS measurement results. The data points of the pellet samples slightly deviate from the calibration curve while the data points of adsorption band samples are located very close to the calibration curve. Although the determination coefficient (R2) for adsorption band samples is 0.998, it is only 0.910 for pellet samples. This result indicates that the LIBS measurement data about adsorption band samples remain more stable.
(3) The simulated quantitative analysis of steel powders demonstrates that the analytical performance of LIBS was improved by the adsorbing process. The mean REP value was reduced from 7.73% to 1.36%, and the mean RSD value was decreased from 20.34% to 6.22%. The pretreatment of steel powders with the adsorbing process can significantly enhance the spectral signal and facilitate the analysis of chemical elements. The mechanism of the improvement refers to that the dense surface of the adsorption band weakens the plasma shockwave effect during LIBS measurement.
Acknowledgement
The current work was supported by National Natural Science Foundation of China (No. 62005218), National Natural Science Foundation of China for key program (No. 91860206) and National Science and Technology Major Project (No. 2017-VII-0001-0094).
References
- 1) T. D. Ngo, A. Kashani, G. Imbalzano, K. T. Q. Nguyen and D. Hui: Compos. Part B, 143 (2018), 172. https://doi.org/10.1016/j.compositesb.2018.02.012
- 2) R. Bogue: Assem. Autom., 33 (2013), 307. https://doi.org/10.1108/aa-06-2013-055
- 3) M. H. Ali, S. Batai and D. Sarbassov: Rapid Prototyp. J., 25 (2019), 1108. https://doi.org/10.1108/rpj-11-2018-0293
- 4) Z. Wang, Y. Deguchi, F. Shiou, S. Tanaka, M. Cui, K. Rong and J. Yan: ISIJ Int., 60 (2020), 971. https://doi.org/10.2355/isijinternational.ISIJINT-2019-317
- 5) X. Jiang, W. Xiong, L. Wang, M. Guo and Z. Ding: Mater. Sci. Technol., 36 (2020), 168. https://doi.org/10.1080/02670836.2019.1685770
- 6) P. K. Kwok, M. Yan, T. Qu and H. Y. K. Lau: Int. J. Comput. Integr. Manuf., 34 (2021), 874. https://doi.org/10.1080/0951192x.2020.1803502
- 7) B. Garrett: Glob. Policy, 5 (2014), 70. https://doi.org/10.1111/1758-5899.12119
- 8) L. Chen, Y. He, Y. Yang, S. Niu and H. Ren: Int. J. Adv. Manuf. Technol., 89 (2017), 3651. https://doi.org/10.1007/s00170-016-9335-4
- 9) T. Duda and L. V. Raghavan: IFAC-PapersOnLine, 49 (2016), 103. https://doi.org/10.1016/j.ifacol.2016.11.111
- 10) J. Wang, E. Liu, S. B. Tor and C. K. Chua: Proc. 2nd Int. Conf. on Progress in Additive Manufacturing (Pro-AM 2016), Research Publishing, Singapore, (2016), 270.
- 11) A. B. Moreira, H. P. M. Oliveira, T. D. Z. Atvars, I. L. T. Dias, G. O. Neto, E. A. G. Zagatto and L. T. Kubota: Anal. Chim. Acta, 539 (2005), 257. https://doi.org/10.1016/j.aca.2005.03.012
- 12) A. du Plessis, P. Sperling, A. Beerlink, W. B. du Preez and S. G. le Roux: MethodsX, 5 (2018), 1336. https://doi.org/10.1016/j.mex.2018.10.021
- 13) A. Aziz, J. A. C. Broekaert, K. Laqua and F. Leis: Spectrochim. Acta B, 39 (1984), 1091. https://doi.org/10.1016/0584-8547(84)80195-0
- 14) F. Pointurier and O. Marie: Spectrochim. Acta B, 65 (2010), 797. https://doi.org/10.1016/j.sab.2010.06.008
- 15) S. Cengiz, A. Cengiz Karaca, İ. Çakır, H. Bülent Üner and A. Sevindik: Forensic Sci. Int., 141 (2004), 33. https://doi.org/10.1016/j.forsciint.2003.12.006
- 16) X. Wang, G. Li, Q. Zhang and Y. Wang: Gesotand. Geoanal. Res., 28 (2004), 81. https://doi.org/10.1111/j.1751-908x.2004.tb01044.x
- 17) Y. Lee and J. Sneddon: ISIJ Int., 42 (2002), S129. https://doi.org/10.2355/isijinternational.42.Suppl_S129
- 18) R. Noll, C. Fricke-Begemann, S. Connemann, C. Meinhardt and V. Sturm: J. Anal. At. Spectrom., 33 (2018), 945. https://doi.org/10.1039/c8ja00076j
- 19) T. Yuan, Z. Wang, L. Li, Z. Hou, Z. Li and W. Ni: Appl. Opt., 51 (2012), B22. https://doi.org/10.1364/ao.51.000b22
- 20) S. Sheta, M. S. Afgan, Z. Hou, S. Yao, L. Zhang, Z. Li and Z. Wang: J. Anal. At. Spectrom., 34 (2019), 1047. https://doi.org/10.1039/C9JA00016J
- 21) A. S. Eppler, D. A. Cremers, D. D. Hickmott, M. J. Ferris and A. C. Koskelo: Appl. Spectrosc., 50 (1996), 1175. https://doi.org/10.1366/0003702963905123
- 22) B. Bousquet, J.-B. Sirven and L. Canioni: Spectrochim. Acta B, 62 (2007), 1582. https://doi.org/10.1016/j.sab.2007.10.018
- 23) D. Santos, Jr., L. C. Nunes, G. G. A. de Carvalho, M. da Silva Gomes, P. F. de Souza, F. de Oliveira Leme, L. G. C. dos Santos and F. J. Krug: Spectrochim. B, 71–72 (2012), 3. https://doi.org/10.1016/j.sab.2012.05.005
- 24) G. Bilge, B. Sezer, K. E. Eseller, H. Berberoglu, A. Topcu and I. H. Boyaci: Food Chem., 212 (2016), 183. https://doi.org/10.1016/j.foodchem.2016.05.169
- 25) M. A. Gondal, M. A. Dastageer, A. A. Naqvi, A. A. Isab and Y. W. Maganda: Appl. Opt., 51 (2012), 7395. https://doi.org/10.1364/ao.51.007395
- 26) J. M. Anzano, M. A. Villoria, A. Ruíz-Medina and R. J. Lasheras: Anal. Chim. Acta, 575 (2006), 230. https://doi.org/10.1016/j.aca.2006.05.077
- 27) L. St-Onge, E. Kwong, M. Sabsabi and E. B. Vadas: Spectrochim. Acta B, 57 (2002), 1131. https://doi.org/10.1016/s0584-8547(02)00062-9
- 28) K. Novotný, A. Staňková, H. Häkkänen, J. Korppi-Tommola, V. Otruba and V. Kanický: Spectrochim. Acta B, 62 (2007), 1567. https://doi.org/10.1016/j.sab.2007.10.020
- 29) M. A. Sperança, M. S. Pomares-Alfonso and E. R. Pereira-Filho: Anal. Methods, 10 (2018), 533. https://doi.org/10.1039/c7ay02521a
- 30) V. N. Lednev, P. A. Sdvizhenskii, M. Ya. Grishin, M. A. Davidov, A. Ya Stavertiy, R. S. Tretyakov, M. V. Taksanc and S. M. Pershin: Spectrosc. Lett., 51 (2018), 184. https://doi.org/10.1080/00387010.2018.1447967
- 31) D. A. Cremers and R. C. Chinni: Appl. Spectrosc. Rev., 44 (2009), 457. https://doi.org/10.1080/05704920903058755
- 32) G. S. Senesi, M. Dell’Aglio, R. Gaudiuso, A. De Giacomo, C. Zaccone, O. De Pascale, T. M. Miano and M. Capitelli: Environ. Res., 109 (2009), 413. https://doi.org/10.1016/j.envres.2009.02.005
- 33) T. Yuan, Z. Wang, S. Lui, Y. Fu, Z. Li, J. Liu and W. Ni: J. Anal. At. Spectrom., 28 (2013), 1045. https://doi.org/10.1039/C3JA50097G
- 34) Z. Hou, Z. Wang, T. Yuan, J. Liu, Z. Li and W. Ni: J. Anal. At. Spectrom., 31 (2016), 722. https://doi.org/10.1039/c5ja00475f
- 35) X. Zhang, Y. Deguchi and J. Liu: Jpn. J. Appl. Phys., 51 (2012), 01AA04. https://doi.org/10.1143/jjap.51.01aa04
- 36) Z. Hao, L. Guo, C. Li, M. Shen, X. Zou, X. Li, Y. Lu and X. Zeng: J. Anal. At. Spectrom., 29 (2014), 2309. https://doi.org/10.1039/d0ja90038a
- 37) S. M. Zaytsev, A. M. Popov, E. V. Chernykh, R. D. Voronina, N. B. Zorov and T. A. Labutin: J. Anal. At. Spectrom., 29 (2014), 1417. https://doi.org/10.1039/c3ja50389e
- 38) M. Cui, Y. Deguchi, Z. Wang, S. Tanaka, Y. Fujita and S. Zhao: Appl. Spectrosc., 73 (2019), 152. https://doi.org/10.1177/0003702818803943
- 39) M. Cui, H. Guo, Y. Chi, L. Tan, C. Yao, D. Zhang and Y. Deguchi: Spectrochim. Acta B, 191 (2022), 106398. https://doi.org/10.1016/j.sab.2022.106398
- 40) A. Sarkar, X. Mao, G. C.-Y. Chan and R. E. Russo: Spectrochim. Acta B, 88 (2013), 46. https://doi.org/10.1016/j.sab.2013.08.002