Abstract
This study examines the evaporation of Al from a molten commercial Ti alloy with different Al concentrations after partial melting in a small electron beam furnace. Electron probe micro analysis confirmed that the Al concentration in the molten region was uniform. The movement of Al in the molten region was not found to be the rate determining step. The Al concentration in the molten region consistently decreased with an increasing melting time but in a non-linear manner. The activity of Al in the molten alloy was calculated using thermodynamic data, which indicated that it increased with an increasing Al concentration in the ingot. However, the activity of Al in the molten alloy did not increase linearly under the influence of the other alloying elements. The overall mass transfer coefficient of Al from molten alloy during evaporation increased with an increasing initial Al concentration with the mass transfer coefficient of Al depending on the activity of Al. An evaporation model was constructed by considering the mutual interaction between Al and the other alloying elements. This evaporation model was able to predict the amount of Al evaporation from the multi-component Ti alloy melt.
1. Introduction
Titanium alloy ingots are produced by unique melting methods, principally vacuum arc remelting (VAR) and electron beam remelting (EBR). VAR uses the direct current heat generated through a consumable electrode which is comprised of stacked briquettes of pressed raw materials. EBR uses an electron beam to heat the raw materials directly fed into a crucible inside a vacuum vessel. EBR has recently been applied to the titanium field in the production of large-scale electrodes for final VAR and in the manufacture of ingots supplied directly to forging and rolling processes. EBR has many advantages over VAR. Various shaped scraps can be used as a raw material, rectangular parallelepiped slab can be cast directly as a hot rolling material and high-density inclusions can be removed by sedimentation. However, EBR heats the liquid Ti alloy melt to more than 2800 K in the beam target area and so accelerates the evaporation of solute elements from the molten alloys, thus changing their concentrations with time in a manner depending on the beam scanning field and also on the geometry of the containing crucible and mold. Because multi-component Ti alloys contain many elements with different vapor pressures, it is necessary to quantitatively determine the amount of evaporation for each solute element. In particular, it is necessary to evaluate quantitatively the amount of evaporation of Al from the molten alloys to maintain the Al concentration within a prescribed range as Al is the most important alloying element for stabilizing the α phase of Ti alloys.
The evaporation behavior of Al from Ti-6Al-4V, the most commonly used Ti alloy, has been studied by many researchers.1,2,3,4,5,6,7,8,9,10) The amount of Al evaporated from the molten alloy in EBR has been quantitatively predicted using the Langmuir’s equation,11) using the combined effects of the melting temperature, melting time, melting rate and the power/pattern of the electron beam. The amount of Al evaporation was used to determine the optimum casting conditions.
However, few reports exist which consider the mutual interaction of solute elements on the evaporation behavior of multi-component Ti alloy melts containing two or more solute elements with high vapor pressure. A recent study12) examined the evaporation behavior of Al and Sn in molten Ti-6242 reporting that Sn enhanced the evaporation rate of Al. In this work we report on the evaporation behavior of multi-component commercial Ti alloys using a laboratory-scale EBR furnace. Moreover, the effect of the alloying elements which was found on the evaporation behavior of Al from Ti alloy melt was examined using thermodynamic data.
2. Experimental Procedures
In order to examine the influence of the initial Al concentration on the evaporation behavior of Al from multi-component Ti alloy melts, ingots with different initial Al concentration were used. Ti-6Al-4V, contains not only V and but also a small amount of Fe. Additionally, other Ti alloys contain Cr and Sn which also have significant vapor pressures at the liquidus temperature of titanium.
Table 1 presents the chemical composition of the ingots used to study the influence of alloying elements on the evaporation behavior of Al.
Table 1. Chemical composition of ingots (mass%).
| Ingot | Al | V | Cr | Sn | Fe | Mo | Zr | Ti |
|---|
| A | 3.30 | 15.40 | 2.97 | 2.94 | – | – | – | bal. |
| B | 4.94 | – | – | – | 2.28 | 3.06 | – | bal. |
| C | 5.20 | – | – | – | 1.05 | – | – | bal. |
| D | 6.03 | – | – | 1.95 | – | 2.10 | 4.08 | bal. |
| E | 6.50 | 4.12 | – | – | 0.18 | – | – | bal. |
Figure 1 shows a schematic diagram of the experimental apparatus used in this study. A cylindrical Ti alloy ingot (1.0 × 10⁻¹ m diameter and 5.0 × 10⁻² m height) was set in a water-cooled Cu mold in a vacuum vessel.

The top surface of the ingot was irradiated with an electron beam at a maximum power of 15 kW to maintain the surface temperature at 2123±10 K as optically measured and at 3.0 × 10⁻² Pa. The beam diameter was 2 mm and the beam scanned over the surface at approximately 10 Hz. According to Nakamura1) and Powell,4) a scanning rate of 10 Hz provides a stable evaporating regime in which the surface can be considered to be at a uniform temperature, unaffected by the scanning rate. Lower scanning rates lead to oscillations in surface temperatures and in evaporation rates as the beam transits; higher rates also lead to oscillating surface temperatures but at a frequency which is very high compared to the diffusion processes leading to evaporation. By varying the melting time between 120–1200 s, the amount of solute evaporation was changed. After the electron beam was turned off, the upper region of the ingot solidified rapidly through radiative cooling and heat transfer to the water-cooled Cu mold.
Thereafter, the ingot was longitudinally cut along the center of the upper surface, and the solidification microstructure in this section was examined. Solidified Ti alloys exhibit a dendritic structure,12) therefore, the region in which the dendritic structure was observed was classified as the molten region. The microstructure was revealed by etching with a 5 vol% nitric hydrofluoric acid solution for 60 s at room temperature.
The solute elements in the molten region were mapped using electron probe micro analysis (EPMA). To evaluate the concentration, change in the molten region, samples were obtained within 2.5 × 10⁻³ to 4.75 × 10⁻² m from the surface of the ingot at 5.0 × 10⁻³ m intervals, and the elemental concentrations were measured using inductively coupled plasma-atomic emission spectroscopy (ICP-AES).
3. Results and Discussion
3.1. Molten Region of the Ingot
In order to clarify the evaporation behavior of Al from the molten region, it is necessary to evaluate the volume of molten region. An estimate of this volume was obtained by observing the macrostructure of ingot.
Figure 2 shows the longitudinal cross-section microstructure of ingots A–E at the center of the surface at a melting time of 1200 s. During electron beam irradiation, the molten region gradually expanded with time from the top surface to the inside of the ingot. After the electron beam was turned off, dendrites grew from the molten surface toward the interior of the ingot due to rapid radiative cooling at the surface. Concurrently, dendrites also grew from the bottom of the molten region toward the surface due to heat transferring to the water-cooled Cu mold through the bottom and sides of the ingot. Two arc-shaped boundaries were observed in this cross section. The region above the top boundary corresponds to the solidified region after melting and the region between the two boundaries is the heat affected zone. The observed macrostructure indicates that the shape of the region was axially symmetric; therefore, its volume could be determined accordingly.

Figure 3 shows the relationship between the volume of the molten region for ingots A–E and the melting time. The molten region volume of all the ingots increased with an increasing melting time; however, the molten region volume differed according to the ingot, that is, the molten region volume of ingot A was the largest and that of ingot E was the smallest.
It is thought that the volume of the molten region depends on the liquidus temperature and solidus temperature of the ingot when the boundary conditions for the both heat input at the top surface of the ingot and heat transfer from the ingot to the water-cooled Cu mold are constant.
Figure 4 shows the relationship between the liquidus and the solidus temperature and the initial Al concentration of the ingots. The liquidus temperature, solidus temperature, and the liquid and solid coexisting temperature range differed between the ingots.
Figure 5 shows the relationship between the liquidus temperature at initial concentration of Al and volume of molten region at melting time 120–1200 s. Ingots with a high liquidus temperature produced a smaller volume of liquid under constant surface temperature conditions, i.e. at a constant melt temperature, the higher the liquidus temperature, the smaller the volume of the molten region. When the melting temperature is constant, the evaporation behavior of Al from the melt was indirectly influenced by the liquidus temperatures.
3.2. Change of Solute Concentration in the Molten Region
To examine the elemental concentration profile in the molten region, it is necessary to understand the localized concentration change. Drilled chips were obtained at different depths from the top surface, and their elemental concentration was analyzed. Further, a line analysis of the Al content along the longitudinal cross section of the ingots was performed with EPMA.
Figure 6 shows the EPMA measurement result of the Al concentration profile at a melting time of 600 s for ingot A. The region indicated by arrows shown in Fig. 6(a) located at 3.5 × 10⁻² m from the surface was analyzed. Figure 6(b) shows the measurement results of the line analysis for Al as well as the ICP-AES analytical result of the Al concentration. The EPMA result correlated well with the ICP-AES result. These results indicated that the Al concentration in the molten region was constant. Therefore, to examine the evaporation behavior of Al from the molten region, the Al concentration value at 2.5 × 10⁻³ m from the top surface of the ingot was defined as the representative value in the molten region. Following the modeling analysis of a similar regime by Ritchie,18) it is assumed that the probable toroidal flow system operating in the liquid is sufficient to maintain a constant surface Al concentration against the loss by evaporation.

Figure 7(a) shows the relationship between the Al concentration of ingots A–E and the melting time at 2123 K. The Al concentration decreased with an increasing the melting time. The shorter the melting time, the larger the decrease, and the decrease amount became smaller when the melting time increased.
As the initial concentrations of Al in the ingots were different, the yield ratio of Al was examined to compare the evaporation behavior of the ingots to each other. The yield ratio of Al was defined by the measured value of the Al concentration divided by the initial concentration in the ingot.
Figure 7(b) shows the relationship between the yield ratio of Al and the melting time. The yield ratio of Al in all ingots continuously decreased with an increasing the melting time. The shorter the melting time, the larger the yield ratio decrease the converse being that the longer the melting time, the smaller the yield ratio. The rate of decrease of the yield ratio of Al varied between the ingots. The above leads to the conclusion that the yield ratio of Al depends on the solute element concentration in the ingot.
Figure 8 shows the relationship between the initial concentration of Al in the ingot and the Al concentration in the molten region at melting time of 120–1200 s and at 2123 K. At 120 s, a higher initial Al concentration in the ingot translated to a higher Al concentration in the molten region; however, the Al concentration in the molten region did not increase monotonously. The tendency of the Al concentration estimated from ingots C to E was lower than that from ingots A and B. As the experiments in this study employed ingots which contained several alloying elements, it is concluded that the activity of Al in the molten region was influenced by the other alloying elements.
3.3. Equilibrium Vapor Pressure
According to the Langmuir evaporation equation,11) the amount of elemental evaporation from the melt is influenced by the equilibrium partial pressure. The equilibrium vapor pressure of a pure element, i, can be described by the following equation:
|
log
p
0,i
=-
a
i
T
+
b
i
+
c
i
logT+
d
i
T×
10
-3
| (1) |
where p
0,i is the equilibrium vapor pressure of pure element i (mmHg) and a
i-d
i are constants listed in
Table 2.
Table 2. Parameter for vapor pressure.
15)| Element | a | b | c | d |
|---|
| Al | 16450 | 12.36 | −1.023 | 0 |
| V | 26900 | 10.12 | 0.33 | −0.265 |
| Cr | 20680 | 14.56 | −1.31 | 0 |
| Sn | 15500 | 8.23 | 0 | 0 |
| Fe | 19710 | 13.27 | −1.27 | 0 |
| Mo | 34700 | 11.66 | −0.236 | −0.145 |
| Zr | 30300 | 9.38 | 0 | 0 |
| Cu | 17650 | 13.39 | −1.273 | 0 |
| Ti | 23200 | 11.74 | −0.66 | 0 |
Figure 9 shows the relationship between the equilibrium vapor pressure and temperature. The equilibrium vapor pressure of all the listed elements increased with increasing temperature. However, the order of the magnitude of the equilibrium vapor pressure differed between the elements. At the experimental temperature 2123 K, the equilibrium vapor pressure of Al was the highest, and the vapor pressure decreased in the order of Cu > Sn > >Cr > Fe. It is thought that V, Zr and Mo are difficult to evaporate because of their low equilibrium vapor pressures which are lower than that of Ti.
The alloying element concentration change for ingot A was examined to clarify the influence of the equilibrium vapor pressure on the evaporation behavior.
Figure 10(a) shows the relationship between the concentration of Al, Cr, Sn and V and the melting time. The concentrations of Al, Cr and Sn decreased with increasing the melting time while that of V increased. As the vapor pressure of V is low, it is thought that the V concentration increases correspond to the concentration decrease for Al, Cr, Sn and Ti.
Because the initial concentrations of Al, Cr and Sn were different, the yield ratios were determined. The yield ratio was defined as the value of the analyzed concentration of elements divided by the initial concentration of elements. The yield ratio of V was excluded because the concentration of V increased.
Figure 10(b) shows the relationship between the yield ratio of Al, Cr and Sn and the melting time. The concentration of these elements deceased with the melting time, with the yield ratio of Sn being the highest, followed by Al, and then Cr.
The equilibrium vapor pressure of Al is the highest, followed by that of Sn, and then Cr as shown in Fig. 9. The order of the equilibrium vapor pressure was different to that of the yield ratio. Therefore, these results confirmed that the evaporation of the solute elements from the Ti alloy melt was not only determined by the vapor pressure of the pure elements.
To confirm the relationship between the equilibrium vapor pressure and the yield ratio of the elements, an experiment was conducted using a Ti-1.0 mass%Cu alloy. Figure 9(b) shows that the equilibrium vapor pressure of Cu is slightly smaller than that of Al. However, the yield ratio of Cu was lowest of all the elements in this study, as shown in Fig. 10(b).
Table 3 summarizes the order of the equilibrium vapor pressure, the yield ratio, and the heat of vaporization, which is also related to evaporation of Al, Cr, Cu and Sn at 2123 K. These results confirmed that the evaporation of solute elements from the Ti alloy melt was influenced by factors other than the simple equilibrium vapor pressure relationships.
Table 3. Comparable order of the yield ratio, vapor pressure and heat of vaporization at 2123 K.
| Property | Order |
|---|
| Yield ratio | Sn > Al > Cr > Cu |
| Vapor pressure15) | Al > Cu > Sn > Cr |
| Heat of vaporization15) | Cr > Cu > Sn > Al |
Langmuir’s evaporation equation shows that the evaporation behavior of solute elements from the Ti alloy melt includes the activity parameter rather than elemental concentrations. Therefore, the activity of Al in the Ti alloy melt was evaluated. A traditional experimental determination, for example by a Knudsen cell technique, is difficult to perform in Ti alloy melts because of its extreme reactivity with refractory materials under vacuum atmospheric conditions. Therefore, the activity in this work was evaluated by using thermodynamic data.14) Several calculation methods can be used to determine activity. In this study, the activity was calculated based on the equilibrium phase diagram information.
According to the quasi-regular solution model,16) the molar Gibbs energy in the molten alloy can be described as:
|
G
m
=
∑
i
x
i
G
+
i
RT
∑
i
x
i
ln(
x
i
)
+
∑
i
∑
j>i
x
i
x
j
L
i j
| (2) |
Here, the interaction parameter can be described by the following equations:
|
L
i j
=
∑
k
⌊
k
L
i j
(
x
i
-
x
j
)
k
⌋
| (3) |
|
k
L
i j
=
a
k
+
b
k
T+
c
k
Tln(
T
)
| (4) |
The chemical potential can be described using the partial differential of the Gibbs energy as:
The activity is defined as:
|
μ
i
=
0
G
i
+RTln(
a
i
)
| (7) |
The activity can be evaluated using Eqs. (2) and (7), where G is the Gibbs energy, Gm is molar the Gibbs energy of molten alloy, Gi is the molar Gibbs energy of a component i, 0Gi is the reference state of molar Gibbs energy for a pure component i, xi is the mole fraction of component i, R is the gas constant, T is the temperature, Lij is the interaction parameter of the component between i and j, kLij is the parameter, ak, bk, ck are constants, μi is the chemical potential of component i, Ni is the mole fraction of component i, and ai is the activity of component i.
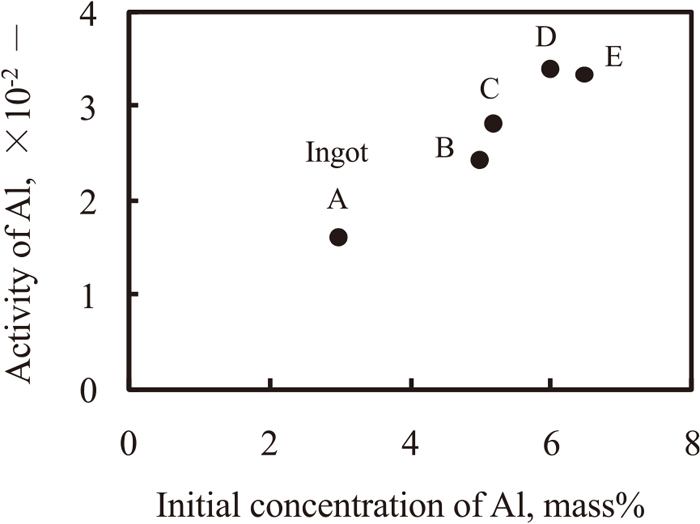
Figure 11 shows the relationship between the activity of Al in ingots A–E at 2123 K and the initial Al concentration. The activity of Al increased with an increasing initial Al concentration; however, the activity of Al did not increase linearly with the initial Al concentration. This result indicates that the activity of Al is influenced by the solute elements.
The concentration of the solute elements in the molten region changed with the melting time due to the evaporation process. The activity of Al changed with the melting time since the activity of Al is concentration dependent. Therefore, the activity was calculated by using the thermodynamic data based on the measured elemental concentrations at all melting times.
Figure 12 shows the relationship between the activity of Al and the melting time at 2123 K. The activity of Al in each ingot decreased with increasing time. The mass transfer coefficient of Al during evaporation was calculated, as described later, and these relations were used.
Figure 13 shows the relationship between the activity of Al and the Al concentration at the melting times of 120 s and 1200 s for ingots A–E at 2123 K. The activity of Al in ingot A changed with the melting time and the Al concentration. As the melting time increased, the Al concentration reduced and so also the activity of Al was reduced. The same trend was observed for the ingots B–E. However, the activity of Al could not be simply correlated with the Al concentration. These results indicate that the activity of Al was influenced by the alloying elements and not only by Al.

It is problematic to make a generalization for the influence of the alloying elements on the activity of Al in this study because both the composition and element concentrations of the ingots differed. Moreover, the activity of Al changes with the concentrations of the elements which evaporate from the melt with an increasing the melting time. Therefore, the amount of change for the activity of Al was evaluated as the concentration of alloying elements changed with respect to the initial concentration of these elements.
Figure 14 shows the amount of change in the activity of Al when the concentration of the elements changed by 1.0 mass% from the initial concentration. When this value is large, the contribution to the activity of Al becomes large and the evaporation of Al from the alloy melt occurs easily. The influence of Sn on the activity of Al in this experiment was largest because that value was the largest.
4. Evaporation of Al from Ti Alloy Melt
The evaporation behavior of the solute elements from Ti alloy melts under vacuum has been previously studied.2,3,4,6,8,9,17) In this study, the interaction between Al and solute elements was considered by using the thermodynamic data.14) This evaporation process is thought to consist of the following three steps, which are then further discussed below:
(1) Mass transfer of solute element inside the melt
(2) Diffusion of the solute elements in the boundary layer below the surface of the melt
(3) Mass transfer of solute element from the melt surface to the vacuum
The combination of these steps in the evaporation process has been formulated for the vacuum induction furnace system by Machlin19,20,21,22) into a combined relationship of mass transfer coefficients in which the rate controlling step was not pre-defined. The evaporation process was assumed to be described by the Langmuir equation and mass transfer in the gas phase was held to be not rate-limiting. The evaporation rate was then a balance between liquid-phase mass transfer in the surface region and free evaporation from the liquid surface. We may approach the present system on the same basis.
4.1. Mass Transfer of Solute Elements in the Molten Alloy
In order to evaluate the distribution behavior of the solute elements in the molten region, a line analysis was conducted using EPMA. Figure 6 confirmed that the Al concentration in the molten region was uniform. This finding implies that mass transfer in the bulk liquid phase was not rate limiting in these experiments.
4.2. Diffusion of Solute Elements in the Boundary Layer
In the boundary layer below the surface of the molten alloys, a difference in elemental concentration is generated between the surface and bulk by the evaporation of solute elements from the surface. This concentration difference drives the mass transfer of solute elements in the boundary layer, which can be described by the following equations:
|
J
i
=
k
diff,i
S(
C
0,i
-
C
S,i
)
| (8) |
where k
diff,i is the mass transfer coefficient (mol·s
−1), S is the surface area (m
2), C
0,i is the concentration (mol·m
−3), and C
S,i is the surface concentration (mol·m
−3). The parameter k
diff,i can be expressed as:
where D
i is the diffusion coefficient of element i in the alloy melt (m
2·s
−1) and
θ is the time (s). In this study,
θ corresponds to the melting time.
4.3. Mass Transfer of Solute Elements to the Vacuum
The evaporation rate of solute element i from the surface of the molten alloy to the vacuum can be described using the Langmuir’s equation:
|
J
i
=
α
i
P
0,i
γ
i
X
i
2πRT
M
i
| (10) |
where
αi is the condensation coefficient of i (−), P
0,i is the equilibrium vapor pressure of a pure element i (Pa),
γi is the activity coefficient of element i (−), X
i is the mole fraction of element i (kg·mol
−1), R is the gas constant (JK
−1mol
−1), and T is the temperature (K). The condensation coefficient was assumed to be
α = 1.0, as used in previous studies
2,3,4,6,8,9,17) indicating free evaporation
i.e. no evaporating atoms return to the liquid surface by recoil from collisions in the gas phase.
The evaporation rate at the interface between the molten alloy and the vacuum can be determined using the mass transfer coefficient as follows:
|
J
i
=
k
vap,i
S
C
S,i
| (11) |
|
k
vap,i
=
α
i
P
0,i
γ
i
ρ
m
2πRT
M
i
| (12) |
|
ρ
m
=
∑
i
ρ
i
M
i
×
f
i
| (13) |
where k
vap,i is the mass transfer coefficient of element i (−) and
ρm is the molar density of the molten alloy (mol·m
−3).
4.4. Overall Evaporation Rate
The processes discussed in Section 4.1–4.3 are sequential; hence, the overall evaporation rate can be described using mass transfer consideration for the three discrete steps in the evaporation process. Ozberk21) considered evaporation in an induction-stirred melts of copper alloy at lower temperatures than in the present case and concluded that at chamber pressures less than the vapor pressures of the evaporating species the evaporation rate was controlled by diffusion in the liquid phase. Ivanchenko7) analyzed the evaporation process for aluminum from an EB-heated Ti-6Al-4V and on the basis of computing the evaporation mass flow according to the Langmuir equation relative to the diffusive mass flow of aluminum in the liquid alloy concluded that diffusion in the liquid was the rate determining step in the overall process. Since the chamber pressure in the experiments of Ivanchenko and in the present case are lower than the vapor pressures of the evaporating species it is unlikely that gas phase mass transfer is a rate-limiting step in the EB cases.
Using the structure proposed by Machlin, we may separate the process into mass transfer steps;
|
J
i
=
k
all,i
S
C
0,i
| (14) |
|
k
all,i
=
(
1
k
diff.i
+
1
k
vap,i
)
-1
| (15) |
Because the value of the Eq. (9) diverged at θ = 0 s, then the initial Al concentration is given as the concentration at 0.1 s. By conducting the sequential computation using Eqs. (8), (9), (10), (11), (12), (13), (14), (15) with a time step of 0.1 s, it was possible to predict the amount of solute elements which evaporated from the alloy melt. Then, this amount used to determine the mass of solute elements based on the changing volume of the molten region as shown in Fig. 3.
Figure 15 shows the relationship between the mass transfer coefficient of Al and the melting time for ingots A–E at a melt temperature of 2123 K. The kdiff, kvap, and kall decreased with an increasing melting time. The kall was limited by the kvap, since the latter was smaller than the kdiff.
Figure 16 shows the relationship between the overall mass transfer coefficient and the Al initial concentration at 120, 300, 600, and 1200 s at 2123 K. The overall mass transfer coefficient increased with an increasing initial Al concentration. However, these relations did not change linearly with a varying melting time. It is concluded that the overall mass transfer coefficient is influenced by the solute elements.
Notably, the Al concentration in the alloy melt decreased with an increasing melting time, as shown in Fig. 7(a). It may be inferred that the overall mass transfer coefficient changes depends on the concentration of Al. Therefore, the change in the overall mass transfer coefficient is related to the Al concentration.
The influence of solute elements on the mass transfer coefficient in the alloy melt have been examined in the case of Cu–Bi and Cu–Bi–Pb alloys not for Ti alloys. The work on Cu systems led to the expected conclusion that the evaporation rate of Bi inceased when Pb was contained in the alloy. Pb increases the activity of Bi through an inter-element interaction psrameter. Experiments using iron-based systems further showed that in some cases, the evaporation rate could be limited by the rate of the surface reaction forming evaporating molecules rather than atomic species.23) In the present work the possibility exists in the multi-element alloys of titanium that interaction parameters play an important part in determining the vapour pressures but it is unlikley that any evaporating molecules are involved.
Figure 17 shows the relationship between the overall mass transfer coefficient and the Al concentration at 120 and 1200 s at 2123 K. The overall mass transfer coefficient of Al in ingot A changed with the melting time and the Al concentration. When the melting time was longer and the Al concentration was lower, the overall mass transfer coefficient of Al was reduced. However, the overall mass transfer coefficient of Al could not be simply correlated with the concentration of Al in the melt. These results indicate that the overall mass transfer coefficient of Al was influenced by the concentrations of the other alloying elements, and not only by the Al concentration.
The predicted Al concentrations are plotted in Fig. 7. Considering their good agreement with the measured values, it was concluded that the model proposed in this study could accurately predict the amount of volatile elements which escape from multi-component Ti alloy melts.
5. Conclusions
The evaporation behavior of the volatile solute element, aluminum, in multi-component Ti alloy ingots is very important for optimizing the casting conditions and maintaining the uniformity of the Al concentration in the final products. It is especially necessary to evaluate quantitatively the amount of evaporation of Al from the molten alloys by considering the mutual interaction of the alloying elements, because Al is the predominant alloying element in Ti alloys.
This study examined the evaporation behavior of Al in a commercial multi-component alloy using a laboratory-scale electron beam melting furnace. The following conclusions were drawn:
(1) The amount of evaporation of Al from the Ti alloy melt is not determined by a simple calculation based on the equilibrium vapor pressure assuming that the Al activity is equal to the concentration. The evaporation behavior of Al is influenced by the activity as described in Langmuir’s equation.
(2) The amount of evaporation of Al from the Ti alloy melt is influenced by the other alloying elements because the activity of Al is dependent on the concentration of other alloying elements.
(3) The concentration of Al in the molten region is uniform during the evaporation process. The rate-determining step for the evaporation of Al is the mass transfer from the alloy melt surface to the vacuum.
(4) The overall mass transfer coefficient of Al from the Ti alloy melt is influenced not only by the concentration of Al but also the concentration of other alloying elements.
(5) The evaporation model was constructed by considering the mutual interaction between Al and the other alloying elements, such as Sn, Cr, and others. The evaporation model was able to predict the amount of evaporation of Al from the multi-component Ti alloy melts.
References
- 1) H. Nakamura and A. Mitchell: ISIJ Int., 32 (1992), 583. https://doi.org/10.2355/isijinternational.32.583
- 2) T. Isawa, H. Nakamura and K. Murakami: ISIJ Int., 32 (1992), 607. https://doi.org/10.2355/isijinternational.32.607
- 3) S. Watakabe, K. Suzuki and K. Nishikawa: ISIJ Int., 32 (1992), 625. https://doi.org/10.2355/isijinternational.32.625
- 4) A. Powell, J. van den Avyle, B. Damkroger, J. Szekely and U. Pal: Metall. Mater. Trans. B, 28 (1997), 1227. https://doi.org/10.1007/s11663-997-0078-3
- 5) J. P. Bellot, E. Hess and D. Ablitzer: Metall. Mater. Trans. B, 31 (2000), 845. https://doi.org/10.1007/s11663-000-0121-0
- 6) S. V. Akhonin, N. P. Trigub, V. N. Zamkov and S. L. Semiatin: Metall. Mater. Trans. B, 34 (2003), 447. https://doi.org/10.1007/s11663-003-0071-4
- 7) V. G. Ivanchenko, O. M. Ivasishin and S. L. Semiatin: Metall. Mater. Trans. B, 34 (2003), 911. https://doi.org/10.1007/s11663-003-0097-7
- 8) S. L. Semiatin, V. G. Ivanchenko, S. V. Akhonin and O. M. Ivasishin: Metall. Mater. Trans. B, 35 (2004), 235. https://doi.org/10.1007/s11663-004-0025-5
- 9) Y. Zhang, L. Zhou, J. Sun, M. Han and Y. Zhao: Int. J. Mater. Res., 100 (2009), 248. https://doi.org/10.3139/146.110007
- 10) A. Klassen, V. E. Forster and C. Körner: Model. Simul. Mater. Sci. Eng., 25 (2017), 025003. https://doi.org/10.1088/1361-651X/aa5289
- 11) G. Geiger and D. Poirier: Transport Phenomena in Metallurgy, Addison-Wesley, Reading, MA, (1980), 560. https://doi.org/10.1002/aic.690190641
- 12) H. Mizukami, T. Kitaura and Y. Shirai: ISIJ Int., 61 (2021), 1363. https://doi.org/10.2355/isijinternational.ISIJINT-2020-517
- 13) H. Mizukami, Y. Shirai, A. Kawakami and A. Mitchell: ISIJ Int., 60 (2020), 2455. https://doi.org/10.2355/isijinternational.ISIJINT-2020-089
- 14) B. Jansson, M. Schalin, M. Selleby and B. Sundman: Computer Software in Chemical and Extractive Metallurgy, ed. by C. W. Bale and G. A. Irons, The MetSoc of CIM, Westmount, QC, (1993), 57.
- 15) E. A. Brandes and G. B. Brook: Smithells Metals Reference Book, Butterworth-Heinemann, Oxford, UK, (1992), 8.
- 16) H. L. Lukas, S. G. Fries and B. Sundman: Computational Thermodynamics, Cambridge University Press, Cambridge, UK, (2007), 79. https://doi.org/10.1017/CBO9780511804137
- 17) S. Itoh and Y. Inoue: Mater. Trans., 52 (2011), 704. https://doi.org/10.2320/matertrans.M-M2011801
- 18) M. Ritchie, P. D. Lee, A. Mitchell, S. L. Cockcroft and T. Wang: Metall. Mater. Trans. A, 34 (2003), 863. https://doi.org/10.1007/s11661-003-1013-0
- 19) E. S. Machlin: Trans. AIME, 218 (1960), 314.
- 20) R. Ohno: Metall. Trans. B, 22 (1991), 447. https://doi.org/10.1007/BF02654283
- 21) E. Ozberk and R. I. L. Guthrie: Metall. Trans. B, 17 (1986), 87. https://doi.org/10.1007/BF02670822
- 22) R. Harris and W. G. Davenport: Metall. Trans. B, 13 (1982), 581. https://doi.org/10.1007/BF02650015
- 23) G. L. Green, A. Mitchell and D. A. R. Kay: J. Iron Steel Inst., 208 (1970), 157.