Ironmaking
Effect of Granule’s Moisture on Granulation Rate of Iron Ore
2022 Volume 62 Issue 7 Pages 1363-1370
Details
2022 Volume 62 Issue 7 Pages 1363-1370
For countermeasures of deterioration in iron ore, development of pretreatment technology for high quality iron ore fine is critical issue in the sintering process. However with increasing small particles, sinter productivity is decreased by lower permeability due to increment of un-granulated particles or considerably large granules. Therefore understanding of granulation phenomena becomes more important issue. Since moisture of iron ore largely relates to the granulation behavior, it is necessary to reveal the effect of moisture on granulation rate for controlling the process. In this study, granulation tests were performed and the size distribution of granule was analyzed with probability model and new model considering granulation rate. Based on the calculation results, the effect of moisture on granulation rate was discussed.
With a large demand for steel product in recent years, it is required to increase the amount of hot metal production. On the other hand, gangue components are increasing in some iron ores, and stable use of high-quality resources is becoming difficult.1,2) As stably available high-Fe iron ore, there are fine ore from Brazil and concentrate from Canada. However, when fine ore is used in the sintering process, there is a problem that sinter productivity decreases due to residual un-granulated particles and generation of coarse particles during granulation.3,4) In order to obtain optimum granules for sintering, it is important to predict the particle size distribution after granulation and to control the operating conditions appropriately. Previously, various granulation models have been reported. For example, Suzuki et al.5) mathematically formulated the rolling phenomena of iron ore in a drum mixer and a disc pelletizer, and it was reported that the size of the granulated particles depends on the total rolling distance of particles. In addition, Hulburt et al.6,7) have reported a model (PBM: Population Balance Model) that predicts changes in particle size distribution from the coalescence rate of particles. However, in order to construct PBM strictly, it is necessary to model a large number of complicated granulation phenomena such as raw material particle size, moisture, and the influence of force applied to particles. Sakamoto8) proposed a model that predicts changes in the particle size distribution by expressing the mass balance during granulation with probability. By using this analysis method, the relationship between the force acting on the particles in the granulator and the particle size distribution after granulation can be evaluated.9) Additionally, Matsumura and Kawaguchi10) focused on granulated moisture and reported a granulation model in which high-moisture small granules exceeding critical moisture adheres to the coarse particles and thereafter low-moisture fine agglomerated. From this model, the frequency of granulated particles with a particle size of 2–10 mm can be estimated after a certain granulation time. However, in an actual drum mixer, the machine length and the retention time changes on each mixer. Furthermore, particle size distribution and moisture content distribution before granulation are not uniform and therefore in some cases, an intensive mixer is introduced as a pretreatment before granulation. In order to evaluate the granulation behavior, it is necessary to examine the effect of the difference in particle size and water distribution due to such pretreatment on the granulation rate.
In this study, in order to investigate the distribution of granule’s moisture and particle growth behavior in more detail, laboratory tests and model analysis using raw materials with different pretreatments were conducted. In the laboratory test, raw materials with different average moisture were simply mixed or agitated, and the effect of moisture on each particle size on the granulation behavior was evaluated. Second, agglomerating behavior and the particle size change were examined by using a probability model, and a new granulation model was constructed considering the moisture content of each particle size as a parameter. Third, the effect of moisture on each particle size on the granulation rate was analyzed and the adhesion mechanism of fine and coarse particles was considered.
Table 1 shows the chemical composition of iron ore used in the experiment, and Fig. 1 shows the particle size distribution. From the viewpoint of evaluation, hematite ore A from South America was used as the raw material, which contains a large amount of nucleus (+1.0 mm) and fine, and was dried at 105°C for 24 hours.
| T.Fe | FeO | SiO2 | Al2O3 | CaO | Mgo | LOI | |
|---|---|---|---|---|---|---|---|
| Ore A | 64.0 | 0.1 | 3.4 | 1.9 | 0.1 | 0.1 | 2.3 |
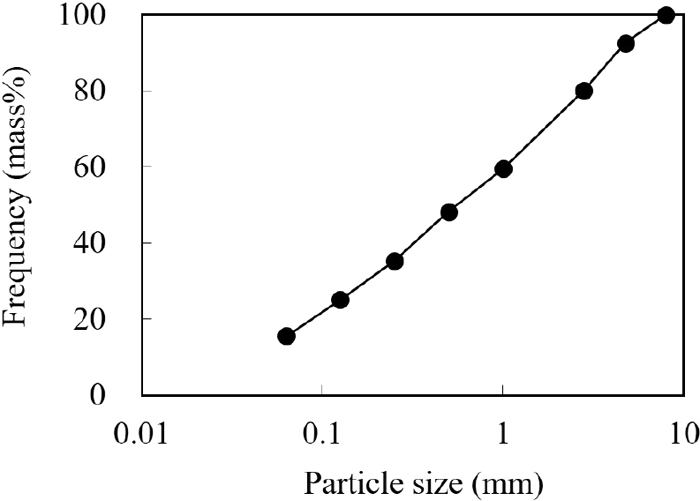
Cumulative undersized particle size distribution of iron ore fines used in this study.
In this study, the target moisture for granulation was set near an appropriate moisture value of ore A; three conditions of 6.5, 7.0, and 7.5 mass% (T1, T2, and T3, respectively) were examined. In actual processes, the moisture contents were adjusted and granulation was proceeded by a drum mixer. However, since it takes time to mix and disperse wet raw material uniformly, the particle size distribution at the initial stage of granulation varies greatly. In order to analyze the granulation speed with eliminating such variations as much as possible, water was added on the raw material before granulation. Firstly, 40 kg of dried ore was reduced and distributed into 5 groups: 5.0, 9.6, 11.6, 9.2 and 4.6 kg. Next, the moisture was adjusted so as to have the moisture shown in Table 2, and five raw material groups were prepared. By adding water in this way, the distribution of the ore ratio followed Gauss distribution to the moisture content (standard deviation: 3.0 mass%).
| Ore A (kg-dry) | Moisture (mass%) | |||
|---|---|---|---|---|
| T1 | T2 | T3 | ||
| Portion 1 | 5.0 | 2.5 | 3.0 | 3.5 |
| Portion 2 | 9.6 | 4.5 | 5.0 | 5.5 |
| Portion 3 | 11.6 | 6.5 | 7.0 | 7.5 |
| Portion 4 | 9.2 | 8.5 | 9.0 | 9.5 |
| Portion 5 | 4.6 | 10.5 | 11.0 | 11.5 |
Underline: Target moisture value of T1 to T3
The raw material group after moisture control was mixed by two methods, and thereafter granulation tests were conducted. Table 3 shows each mixing condition. As the mixing method, (1) mixing with a drum mixer (Drum mixer; DM mixing) and (2) mixing with an intensive mixer before mixing by a drum mixer (Intensive mixer; IM + DM mixing) were carried out. By mixing with an intensive mixer, it is possible to prepare a sample with more homogeneous moisture.9) Figure 2(a) shows the test flow of the granulation method by DM mixing, and Fig. 2(b) shows the test flow of the granulation method by IM + DM mixing. In this test, DM mixing and IM + DM mixing treatment were performed for the three moisture conditions: 6.5 to 7.5 mass% shown in Table 2, and the granulation time by the drum mixer was 0 to 240 s shown in Table 3. In the test, the drum mixer was stopped every 60 s, sampling was performed, and the particle size distribution was evaluated by sieving in wet state with a ro-tap shaker in 5 sec. The sieve mesh used was 9.5 mm, 8.0 mm, 4.8 mm, 2.8 mm, 1.0 mm, 0.5 mm. Furthermore, the moisture content of the sample for each particle size after sieving was also evaluated.
| Drum mixer | Intensive mixer | ||
|---|---|---|---|
| Diameter | (m) | ||
| Machinery body | 1 | 0.75 | |
| Impeller | – | 0.35 | |
| Width | |||
| Machinery body | (m) | 0.3 | 0.75 |
| Mixing time | (s) | 60 | 60 |
| Rotational speed | (rpm) | ||
| Machinery body | 12 | 40 | |
| Impeller | – | 500 |

Process flow for (a) Drum mixer; DM mixing, (b) Intensive mixer and Drum mixer; IM+DM mixing.
Figure 3 shows the particle size distribution before and after granulation at 240 s on a moisture content of 7.0 mass%. Before granulation, the frequency of particle size 2.8–4.8 mm increased and the frequency of 1.0–2.8 mm and +4.8 mm decreased in IM + DM mixing compared to DM mixing. On the other hand, after 240 s, the frequency of the particle size of 4.8–8.0 mm increased in the IM + DM mixing compared to the DM mixing, and there was no significant difference in −4.8 mm. Focusing on +8.0 mm, the frequency of both DM mixing and IM + DM mixing was low before granulation, but after 240 s, the frequency was significantly reduced in IM + DM mixing. From these results, it is considered that the growth rate of +8.0 mm granules during granulation was suppressed by IM + DM mixing.
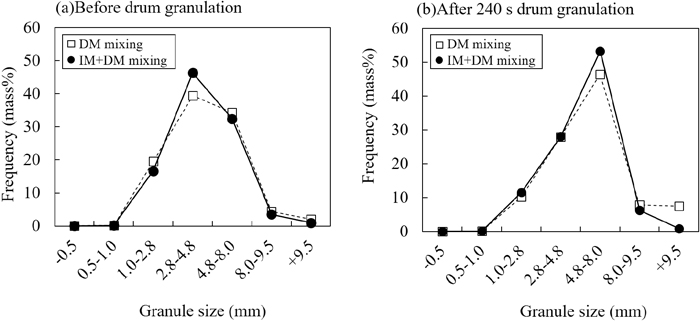
Granule’s size distribution on DM and IM+DM mixing on the condition of T2 (moist. =7.0 mass%) (a) before granulation and (b) 240 s drum granulation.
Therefore, we focused on the particle size of −4.8 mm, 4.8–8.0 mm, and +8.0 mm (hereinafter, each particle size is referred to as small, medium, and large granules) in which a remarkable difference in granule size was observed. Figure 4 shows the target moisture content T1 to T3 (6.5 mass%, 7.0 mass%, 7.5 mass%) and the moisture content for each particle size after each mixing treatment. The average moisture content of the DM mixing was 6.0, 6.2, 6.9 mass%, and those of the IM + DM mixing was 6.1, 6.3, 7.0 mass%, which were lower than the target moisture content. This is due to the evaporation of water during the mixing process and the adhesion of water to the inside of the equipment. At the same target moisture content, there was no significant difference in the moisture of each particle size in the DM mixing, but in the IM + DM mixing, the moisture content of the large granules was lower than that of the small granules. This is because, in IM + DM mixing, the large granules with high moisture content before granulation similar to those shown in Fig. 4(a) were collapsed by the intensive mixing operation, and the moisture content moved to the small granule side.9)
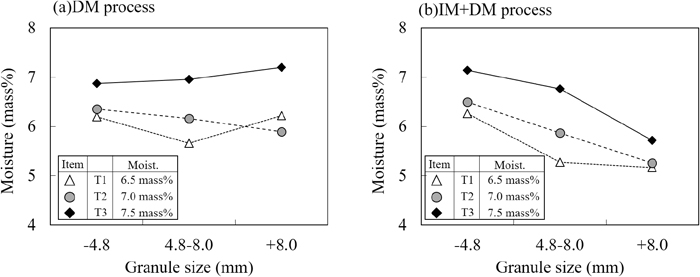
Moisture contents on each granule’s size on (a) DM mixing process and (b) IM+DM mixing process before granulation.
Figure 5 shows the change in the frequency of large granules (+8.0 mm) in a mixing of DM and IM + DM. In both mixing methods, the proportion of large granules increased as the granulation time increased, but the proportion of large granules in the IM + DM mixing was lower than that in the DM mixing. In addition, when the granulated moisture content was 7.5 mass%, the increase of that in DM mixing was remarkable.
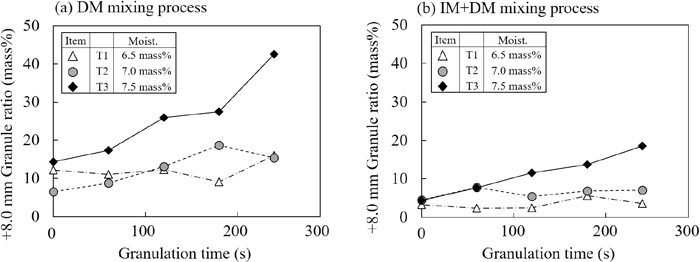
Relationship between granulation time and +8.0 mm ratio of granules on (a) DM mixing, (b) IM+DM mixing.
Figure 6 shows the frequency of small granules (−4.8 mm) at each granulation time in DM mixing and IM + DM mixing. In both mixing methods, the proportion of small granules decreased as the granulation time and moisture content increased. In addition, when compared with the same moisture content, the ratio of small granules after mixing (granulation time 0 s) was larger in IM + DM mixing than in DM mixing. This was because the granulated particles were collapsed by the agitating treatment.
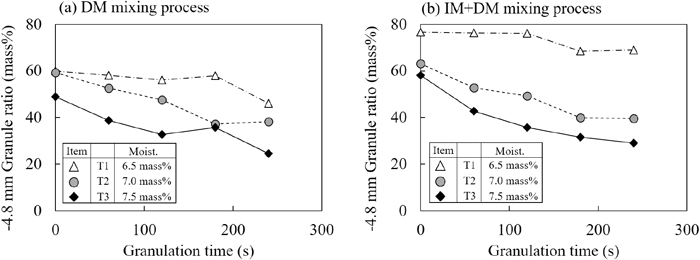
Relationship between granulation time and −4.8 mm ratio of granules on (a) DM mixing, (b) IM+DM mixing.
Figure 7 shows a cross-sectional photograph of large granules (+8.0 mm) after DM mixing with a target moisture content of 7.0 mass%. Most of the particles had a structure with one nuclear particle (+4.8 mm or more) inside, but some aggregated particles formed only of small granules were also observed. Granulated particles having two or more nucleus with a particle size of +4.8 mm were not observed.
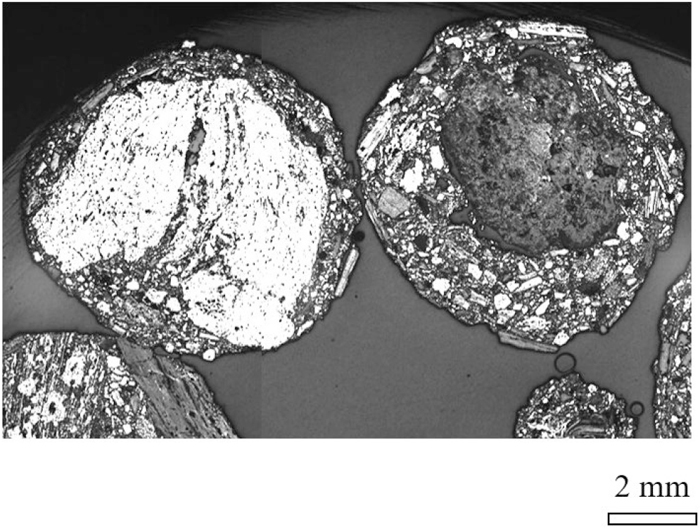
Cross-sectional photographs by optical microscopy of +8.0 mm granule’s on DM mixing with moist. 7.0 mass%.
In Figs. 3, 4, 5, 6, it was found that even if the target moisture of the raw material before granulation was the same, the growth behavior during granulation was significantly different due to the difference in the moisture distribution for each particle size. For example, as shown in Figs. 5 and 6, it was confirmed that the granulation rate increased remarkably at a moisture content of 7.0 to 7.5 mass%. As for the effect of water distribution on granulation, a model that estimates the amount of granules of 2 to 10 mm at the completion of granulation has been reported from the idea that only fine particles exceeding the critical moisture are adhered and granulation progresses.10) However, in this test, agglomeration progressed slowly with the granulation time, and this phenomena cannot be expressed by only the previous idea using critical moisture as the boundary of granulation progress. Therefore, in order to understand the granulation behavior, it is necessary to extract the granulation phenomena, clarify the influence of local moisture for each particle size, and evaluate the growth behavior of the particles.
Therefore, in Chapter 4.1, we analyzed the changes in the particle size distribution of the granulated particles macroscopically using a probability model, and examined the effects of particle size and moisture that contribute to the granulation. In Chapter 4.2, regarding the granulation phenomena considered in Chapter 4.1, a granulation rate equation was built for each particle size, and the moisture dependence of the granulation probability was newly formulated. Next, the moisture content of each particles was compared with the experimental results as a granulation growth parameter, and the mechanism governing the granulation phenomena was considered.
4.1. Analysis of Granulation Behavior by Probability ModelIn this study, the probability model8) was used to represent the granulation behavior. Assuming that the particle size distribution before granulation is vector F, the overall granulation probability is π, the granulation/ disintegration matrix is B, the unit matrix is E, and the number of steps per unit of 60 s granulation operation is N, the particle size distribution vector after granulation is GN. It is represented by Eq. (1).
| (1) |
Here, assuming that the frequency in each mesh is g1, g2, g3 and f1, f2, f3 from the small granule side, GN and F are expressed by Eq. (2).
| (2) |
| (3) |
Where qij (−) is 0 or a positive number. qij (i > j) is the probability that the particles agglomerates into a larger particle size (granulation factor), and qij (i < j) is the probability that the particles will become a smaller particle size (collapse factor).
For analysis of granulation behavior, calculation results were fitted into the experimental results with parameter B to obtain qij. However, the more variables there are, the more overfitting11) will occur, and there is concern that the granulation behavior cannot be interpreted correctly. In this study, considering that the granulation in the drum mixer progresses slowly and no strong impact is applied, the disintegration factor qij (i < j) is set to 0, and the granulation matrix B* is used.
| (4) |
Figure 8 shows the experimental and calculated results of small granules (−4.8 mm), medium granules (4.8–8.0 mm), and large granules (+8.0 mm) under the condition of granulation by (a) DM mixing and (b) IM + DM mixing at a moisture content of 7.0 mass%. The correlation between the calculation and the experimental result was high, and the correlation between the calculation and the experimental results was also found under other granulation conditions. Therefore, it was found that macroscopic granulation behavior can be expressed only by the granulation factor.
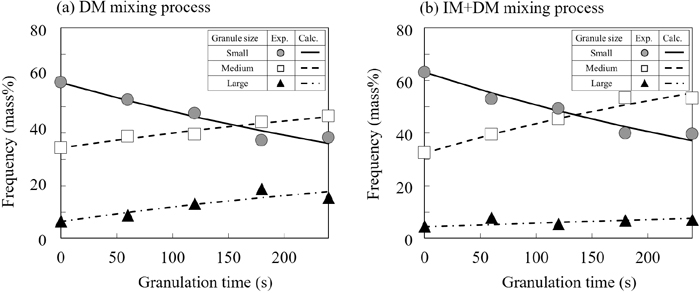
Granulation time dependency of frequency for each particle size on IM+DM mixing at target moisture of 7.0 mass%. (Small: −4.8 mm, Medium: −8.0+4.8 mm, Large: +8.0 mm)
Table 4 shows the fitting results of the granulation probability qij under each granulation condition. q11 indicates the probability that small granules will remain at their own particle size, and q22 indicates the probability that medium particles will stay at their own particle size. The larger those values are, the more slowly the granulation progresses. Under each granulation condition, q11 and q22 showed large values of 0.5 to 1.0. On the other hand, focusing on the probabilities about small granules change to medium granules (q21) and small granules to large granules (q31), the value of q31 was 0 to 0.1, which was smaller than that of q21. The probability that the medium granules changes to large granules (q32) also showed a relatively large value at a moisture content of 7.5 mass%. From the above results, the probability of rapid transition from small granules to large granules is small, and granulation behavior on these tests is a mode in which granulation grows while gradually shifting from small granule to medium granule and medium granule to large granules.
| Target moisture (mass%) | |||||||
|---|---|---|---|---|---|---|---|
| DM mixing | IM+DM mixing | ||||||
| 6.5 | 7.0 | 7.5 | 6.5 | 7.0 | 7.5 | ||
| Granulation Speed coefficient | q32 | 0.01 | 0.00 | 0.40 | 0.00 | 0.03 | 0.20 |
| q22 | 0.99 | 1.00 | 0.60 | 1.00 | 0.97 | 0.80 | |
| q31 | 0.00 | 0.14 | 0.00 | 0.01 | 0.02 | 0.00 | |
| q21 | 0.10 | 0.15 | 0.38 | 0.06 | 0.29 | 0.47 | |
| q11 | 0.90 | 0.71 | 0.62 | 0.94 | 0.69 | 0.53 | |
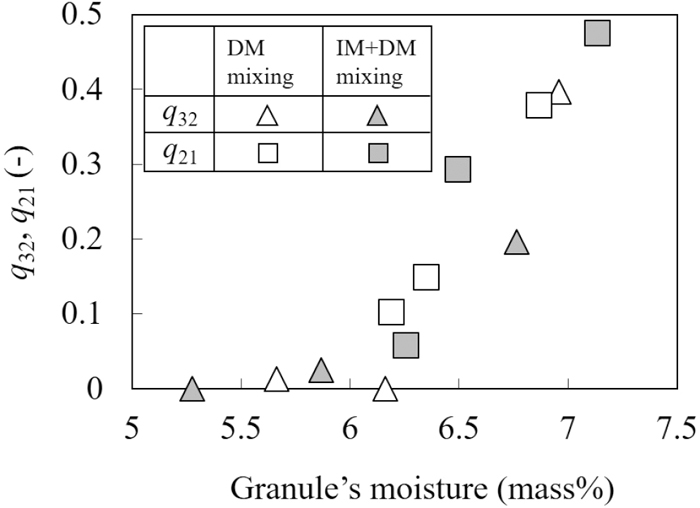
Therefore, next, we focused on the water dependence of q21 and q32. Figure 9 shows the relationship between the granulation probability and the target granulation moisture. The values of q21 and q32 tended to increase as the target granulated moisture content increased. Focusing on q21, the value of IM + DM mixing was higher than that of DM mixing when the moisture content was 7.0 mass% or more, and when focusing on q32, the value of DM mixing was higher when the moisture content was 7.5 mass%. Both the small granules granulation probability: q21 and the medium granule granulation probability: q32 show a correlation with the target granulation moisture, but they are not linear changes. This is because, as shown in Fig. 4, the moisture contents of the small granules and medium granules themselves differ greatly depending on the mixing method, and it is necessary to examine the moisture contents of each particle size.
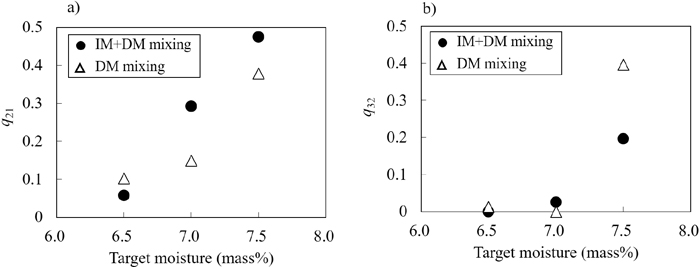
Relationship between target moisture and granulation speed coefficient on agglomeration of (a) small granule to medium granule; q21 and (b) medium granule to large particle; q32.
Therefore, next, for DM mixing and IM + DM mixing, the values of q21 and q32 were arranged by the moisture content of each particle size before granulation. The results are shown in Fig. 10. When the moisture content was less than 6 mass%, the granulation probability was almost 0, but when the moisture content was 6 mass% or more, the granulation probability tended to increase. In the granulation of iron ore, a certain amount of water is absorbed inside the particles, and the excess water remains on the surface of the particles and contributes to adhesion. Even though there is a difference in the critical moisture value depending on the method for measuring the absorbed moisture value, it is considered that 6 mass% of moisture corresponds to the critical moisture value in this test. If the moisture content is lower than this, the surface moisture content is insufficient, so granulation hardly progresses.12,13)
Relationship between granulation speed coefficient on agglomeration q21, q32 and granule’s moisture. q21 to small granule’s moisture, q32 to medium granule’s moisture in the case of DM and IM+DM mixing.
From the above, the raw material granulation behavior used in this study was a system in which the coalescence of particles gradually progresses: (1) small granules (−4.8 mm) to medium particles (4.8–8.0 mm) (2) medium particles (4.8–8.0 mm) to large granules (+8.0 mm). In addition, the granulation probabilities of (1) and (2) are organized by the moisture content of each particle size before granulation, and the granulation probability increases sharply at a critical moisture content of 6 mass% or more regardless of the mixing method. Therefore, next, a new granulation model was constructed from a kinetic point of view, considering the water dependence of the granulation probability.
4.2. Construction of a Model Considering the Moisture Dependence of Coalescence Rate and Granulation ProbabilityIt has been reported that the coalesce rate is proportional to the product of the particle number density and the frequency in the two particle size categories of interest.6,7,14) Regarding the structure of the granulated particles, there is a possibility that large granules having a plurality of nuclei particles could be formed, but as shown in Fig. 7, in this result, a plurality of nuclei particles (+4.8 mm) were not observed. Therefore, the following five items were assumed as the premise of the formulation.
1) There are 3 categories: small granules (−4.8 mm), medium granules (4.8–8.0 mm), and large granules (+8.0 mm).
2) Small granules and small granules are united to form medium granules. Small granules and medium granules are united to form large granules.
3) The generated medium and large granules don’t collapse.
4) The rate of frequency increase and decrease are proportional to the product of the frequency of the two categories involved in granulation.
5) The rate of decrease on small granules and medium granules due to the agglomeration of small granules and medium granules are apportioned according to the ratio of the frequency.
From these assumptions, the following Eqs. (5), (6), (7) were derived. Figure 11 shows a schematic diagram of the formulation.
| (5) |
| (6) |
| (7) |
Here, k: Granulation rate coefficient (1 / s),
g1 (t): Frequency of small granules (−4.8 mm) at granulation time t (−),
g2 (t): Frequency of medium granule (4.8–8.0 mm) at granulation time t (−),
g3 (t): Frequency of large granules (+8.0 mm) at granulation time t (−).
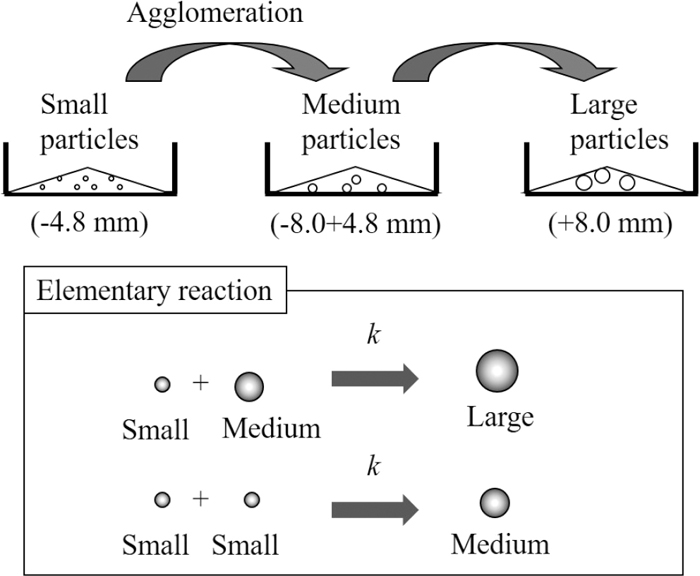
Schematic diagram of granulation model.
The granulation rate coefficient can be regarded as the granulation probability. As shown in Fig. 10, the granulation probability increased at the boundary of critical moisture. Therefore, as shown in Eq. (8), when the moisture content is lower than the critical moisture content, k was assumed to be set to 0 and otherwise, k is proportional to the difference between critical moisture and measured moisture.
| (8) |
wi: Moisture value in particle size category i (mass%),
wc: Critical moisture value (mass%).
Here, from the examination of Chapter 4.1, the critical moisture of ore A is assumed to be 6 mass%, and wc = 6 is used in this analysis.
Regarding wi, we examined whether to use wgn: the moisture content of the nuclear particles (larger side), wga: that of the adhering particles (smaller side), or wgg: that of the particles generated by granulation. For example, Eq. (7) shows the change in the weight of small granules and consists of the first term (−kg12) that represents growth into medium particles due to adhesion between small granules, and the second term (kg1g2·g1/(g1 + g2)) that means agglomeration of small granules with medium particles as nuclear particles. Regarding k in the first term, since it is a combination of small granules, wgn and wga have the same moisture value, and wgg has the moisture value of the medium granules.
In order to verify the moisture value to be used as wi, each particle moisture was applied to Eq. (8), and the experimental value and the calculated value were compared. Figure 12 shows the change in the particle size distribution of the IM + DM method at a moisture content of 7 mass% and the calculated values fitted by Eqs. (5), (6), (7), (8) using each particle moisture wgn, wga and wgg. When wgn was used, the results showed a good tendency to decrease the small granule ratio, increase the medium granule ratio, and suppress the increase in the large granule ratio. Next, when wga was used, the tendency of granulation growth from medium granules to large granules was highly estimated, and the large granules tended to gradually increase. As previously reported, the effect of the adhered fine particles on the granulation property is large,10) and the granulation rate between the small granules could be estimated by considering the moisture content of the small granules themselves. However, there is a problem in the reproducibility of the granulation behavior on the large granule side. When wgg is used at the end, there is a large discrepancy with the experimental results.
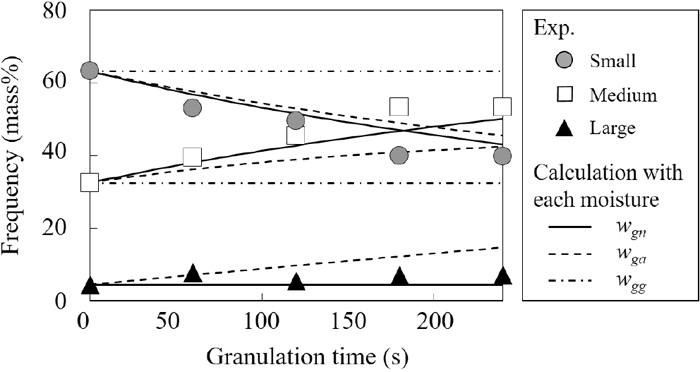
Frequency for each particle size on IM+DM process of experimental data and calculation data based on nucleus particle moisture, wgn, adherent particle moisture wga and generational particle moisture wgg in the case of T2 (moisture: 7.0 mass%).
From the above results, it was found that the granulation behavior from small granules to large granules can be predicted more accurately by adopting the moisture content of the nuclear particles rather than the adhered particles as the moisture content that controls the granulation probability. Figure 13 shows a schematic diagram of the agglomeration phenomena between particles. The nuclear particles have a larger volume than the adhered particles, and therefore the moisture content of the adhered particles is greatly affected by the water saturation of the nuclear particles and the capillary force. Figure 13(a) shows the case that the adhering particles comes into contact with the nuclear particles with low moisture content. If the absorbed moisture content in the nuclear particles is unsaturated and the surface moisture content of the adhering particles is excessive, water moves from the adhering particle to the nuclear particle side. As a result, the moisture content on the adhering particle side is reduced through the contact point, and the surface moisture content on the adhering particles side required for bonding is reduced. Next, it was considered that the adhering particles comes into contact with the nuclear particle having high moisture content as shown in Fig. 13(b). If the water saturation of the nuclear particle is high and the surface water is excessive, the surface water bonds with the adhering and nuclear particles. The small adhered particles has a large specific surface area, and the amount of water existing between the particles is larger than the amount of water that moves into the particles inside. Therefore, the adhered state is maintained. As described above, it is considered that water contents on particle could change depending on granule’s size and water absorption on the nuclear particle side, and as a result, granulation behavior changes.
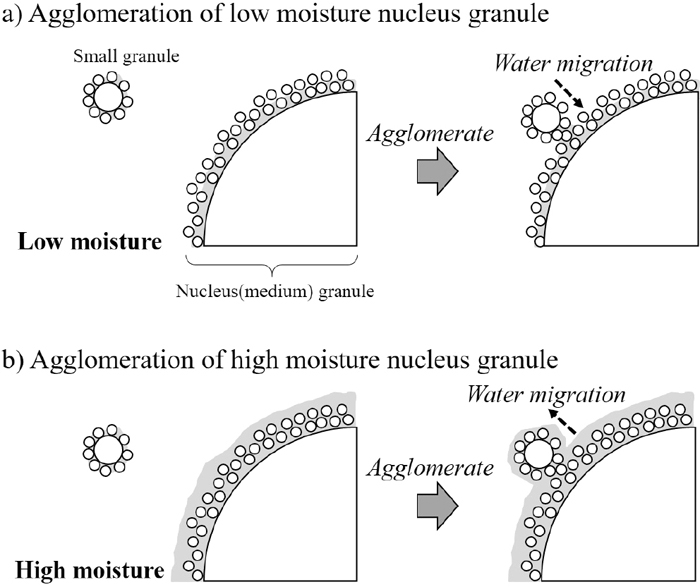
Schematic diagram of agglomeration on small granule and a) low moist. medium granule and b) high moist. medium granule.
Based on the above discussion, the granulation phenomena can be simulated by analyzing the changes in the particle size distribution and the granulated particle structure, and by reflecting the particle’s moisture into the granulation coefficient. In this study, we focused on a single ore brand and considered only two-layered granulated particles with a single nuclear particle. However granulation phenomena such as granule’s structure of multiple nuclear particles, and collapse of granulated particles can be considered under the excessive granulation moisture or a lot of fine particles. For such a system, it is necessary to set appropriate particle size classification for evaluation by considering the influence of the characteristics of iron ore and the particle size distribution of raw materials,12,15) and to set the parameters reflecting the water transfer into the particles and the local moisture distribution.
In this study, we investigated the effect of the target moisture content on the granulation rate of iron ore and the water distribution for each particle size, and obtained the following findings.
(1) The granulation rate varies greatly depending on the particle size distribution and the difference in moisture content for each particle size before granulation.
(2) By analysis using a probability model, the probability of gradual granulation growth among the three categories of small granule, medium granule, and large granule is evaluated. When the moisture content of the particle size category of interest is lower than the critical moisture content, granulation probability is extremely small, but when the moisture content is above the critical moisture level, the granulation probability increases sharply.
(3) A new granulation model was built in which the granulation probabilities reflected the difference between the moisture of each particle size and critical value. From the analysis, it was found that the granulation rate of each particle size can be arranged by considering the moisture content on the larger granule side, which is the nuclear particle on granulation.