Abstract
Heavy and medium plate (HMP) is a valuable and irreplaceable material that is widely used in pipelines, bridges, ships, building construction, and power plants. The quality of a plate’s surface is closely related to its strength, hardness, and corrosion resistance. HMP is still trimming to length after the continuous casting process. The goal of this research is to evaluate surface quality quickly by combining online detection information of normal and periodic defects with professional quality control skills. To begin, this study creates a set of assessment criteria for HMP surface quality based on length, total defect area, and total area of various types of surface defects on the plate. The analytic hierarchy process (AHP) is then developed to identify based on the operator’s experience and expert knowledge, the weights of the classified defects are then determined using the analytic hierarchy process (AHP). Finally, the evaluation grades for each plate may be calculated. The evaluation findings may benefit not only in improving production efficiency, lessening labor intensity, and reducing waste caused by cutting to length, but also in boosting the intelligent control capability of the HMP manufacturing technique.
1. Introduction
Due to its high strength, excellent corrosion resistance, high formability, and wear resistance, heavy and medium plate (HMP) plays an important role in shipbuilding and marine engineering, mining machinery, high-pressure boilers, power generation facilities at nuclear power plants, high-rise buildings, high-speed rails, cross-sea bridges, high-pressure gas pipeline, and military weapons and equipment.1) Surface quality is not only one of the most significant variables determining material service life (together with strength, toughness, corrosion resistance, and other attributes), but it is also related to productivity, production costs, and quality objections throughout the HMP rolling process.2) Over the last few decades, the surface flaws of steel plates were predominantly monitored by the human eye visual approach, which was readily impacted by various inspectors’ personal experience, a lack of continuity, timeliness, and accuracy.3) Fortunately, the fast development of machine vision and artificial intelligence technologies in recent years has made secondary electron (SE) pictures of materials,4) palletization process,5) character identification6) and surface defect segmentation7,8,9,10) in steel products more practical. While Kasahara studied the defect detection in concrete structures,11) Zhao detected surface defects of wind tubine blades using an alexnet deep learning algorithm,12) Koeipensri detected the electronic part surface defects based on CNN image classification.13) In industry, an online detection system was widely used, allowing not only online identification and classification of surface defects in high temperatures, dust, and fast-moving steel materials, but also surface quality evaluation (SQE) by analyzing the size, classification, and quantity of surface defects almost in real-time.
SQE based on machine vision has been a research hotspot in recent years. Feng compared the surface quality of single crystal 4H-SiC machined by hybrid laser-waterjet to that machined by laser method.14) Gupta studied surface quality by analyzing the effects of adjusting two crucial laser parameters, power, and transit speed.15) Pasalopoulos provided a methodology for assessing the quality of the non-sintered powder layer based on an optical evaluation of powder surface quality using 3D white light scanning.16) Scotton17) and Yu18) concentrated on printing quality and stereolithography apparatus 3D printing, respectively, whereas Jaafar developed a new method of measuring surface quality that allows simultaneous identification and quantification of induced machining defects, as well as evaluation of the performance of the obtained surface.19) While Oliveira20) and Akoto21) explored the surface water quality evaluation system.
However, measuring the surface quality of HMP has proven problematic because of the high-temperature surroundings, quicker movement speed, and complicated surface circumstances. Therefore, the accuracy of surface defect detection is heavily reliant on high-definition, high-resolution, real-time surface images, so the hot surroundings, fast moving speeds, and complex surface conditions could seriously affect the image quality of Heavy and Medium Plate through louder noise, lower sharpness, severe image smearing, causing the reduction of image resolution in turn brings great interference to image feature extraction and recognition using deep learning algorithms, and reduces the detection rate and classification accuracy of defects. To begin, a lower online identification and classification rate has a substantial influence on the SQE system’s accuracy. Second, how to express the link between specific defect levels as well as its information, which includes the number, size, position, and area of HMP, which is critical to the SQE system. Third, how to create a quality evaluation model for different HMP specifications with differing defect levels and quality expectations. The accurate and effective detection of the length, width, position and type of surface defects is the basis for the evaluation of the surface quality of HMP. For instance, those grades and partition of surface defects were determined by length for Scratch, if the defect type was wrongly split as Pressed foreign body, which is decided by total areas, it might have a significant impact on the calculating procedure for evaluating the surface quality of heavy and medium plate. Fortunately, utilizing deep learning approaches and updated models, the online detection model can rapidly, correctly, and efficiently discover and classify surface defects, particularly tiny dimension defects, and scratches, as well as other periodic confirmations. The high detection rate is an important factor in determining the quality of HMP.
To address the above-mentioned issue, our team is working on two approaches. On the one hand, high-quality surface images remain the foundation for detecting defects; we retrieved high-contrast and high-definition images throughout the HMP production method using specific light route design and light optimization. A novel surface defect detection model based on deep learning approaches, on the other hand, has been developed to improve the online identification rate and classification rate.22) In addition, the LSTM approach was employed to detect period defects such as roll printing and scratches.23)
The main idea is to figure out how to put together the SQE model based on the online detection findings of surface defects in HMP. Analytic hierarchy process (AHP) models, a multi-criterial decision making (MCDM) method,24) were widely used in banks, manufacturing systems, operators’ evaluation, software evaluation, website performance evaluation, strategy selection, supplier selection, organizational performance evaluation, staff recruitment, construction method selection, warehouse selection, technology evaluation, route planning, project selection, and customer requirement rating,25,26,27,28,29) surface water absorption test.30,31) The practice of evaluating quantitative and qualitative criteria and alternatives on the same preference scale is the primary advantage of AHP.
Above all, an assessment criteria model for HMP surface quality has yet to be created both at home and abroad to react to the research state and challenges. To that purpose, this study provides a system for evaluating HMP surface quality based on length, total defect area, and total area of steel plates of various types of surface defects. The weights of the categorized defects are then determined using the analytic hierarchy process (AHP). Finally, the evaluation grades for each HMP will be determined. The evaluation findings may benefit not only production efficiency, worker labor intensity, and waste caused by cutting to length, but they may also enhance the HMP manufacturing procedure’s intelligent control capacity.
2. The Surface Defects Formation and the Partitioning of HMP
Before identifying the various forms of surface defects HMP and analyzing their influence on overall quality, the fundamental cause of creation, features, and categorization of surface defects must be investigated. On this basis, the defect grades of the types, locations, numbers, lengths, and regions spread in the HMP may be recognized based on operator experiences and industry expertise.
2.1. Analyzes of Defects Formation
Surface defects in HMP are impacted by a few elements that are interlaced throughout the smelting, continuous casting, and cooling processes. Historically, it was understood that the smelting operation had a more direct influence on surface flaws during the production process. Transverse, longitudinal, and star cracks, for example, are frequently created during the smelting process and occur in the crystallizer meniscus area due to imbalanced solidification of molten steel and slag. While pockmarks, pressed iron oxide scale, scratches, impression, and fold defects are commonly created by the manufacturing procedure process, which is generally caused by the machinery, roll condition, and other operational reasons. Images and characteristics of surface defects in HMP are shown in Fig. 1 and Table 1.
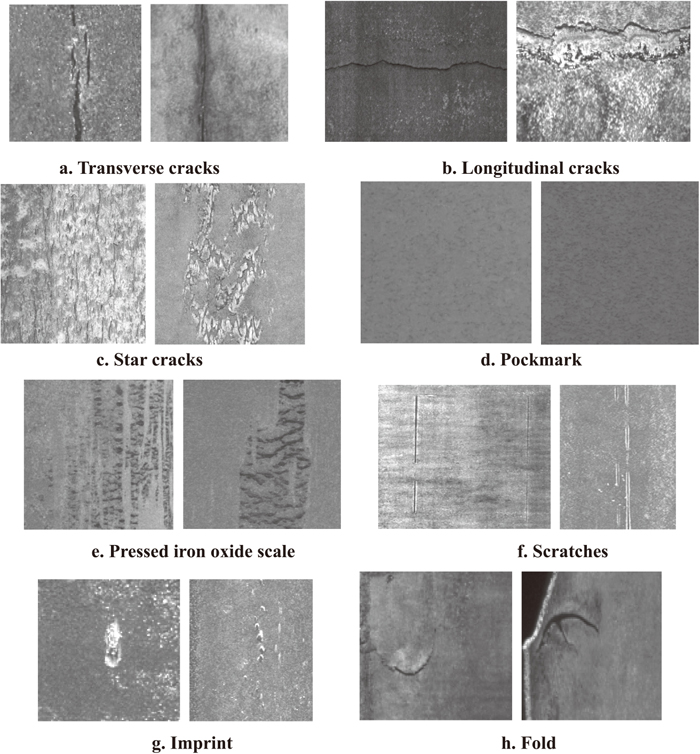
Table 1. The characteristics of surface defects in heavy and medium plate.
| Characteristics | Describes | Defects types |
|---|
| Depth and height | 2D defects (No Depth and height) | Inclusions, pressed iron oxide scale |
| 3D defects (have Depth and height) | Cracks, pockmark, scratches, indentations, convex hulls, pits |
| Colors | dark red | Pressed oxide scale, pockmark, cracks, inclusions |
| Light white | inclusions |
| Shapes | Straight | Horizontal scratches, vertical scratches |
| Cracked | Transverse cracks, longitudinal cracks |
| Mesh | Star cracks, roll anilox |
| Irregular shape | Indentation, folding, heavy leather, scarring, bubbles, inclusions |
| Distribution form | Point distribution | Pockmarks, pressed iron oxide scale |
| Periodic distribution | Roll anilox, convex hull, straightening machine roll mark and indentation |
The SQE system is based on HMP’s increased rate of surface flaw identification and categorization. However, due to substantial intra-class fluctuations and imbalanced training data, which means the number of positive and negative samples is not equal, causing findings to be skewed towards the categories with more training sets, while the categories with less training sets are considered as noise or ignored. The accuracy of present algorithms utilized in HMP defect classification is inadequate. Furthermore, due to the low contrast of the collected pictures, it is difficult to notice roll imprints on high-temperature plates. It may be understood as being impacted by the manufacturing environment and the camera’s installation position, and surface fault photos from different HMP production lines have varied resolutions and depths of field. Traditional defect detection methods have the disadvantage of being difficult to extract features from different scales of HMP surface defect images, and it is frequently necessary to design a variety of feature combinations and classifiers to detect different resolution depth of field images. Because self-encoders based on feed-forward neural networks can only take fixed-size pictures due to the number of neurons in the input layer, the original image must be scaled to a fixed size during training to fulfill the network’s input requirements.
Furthermore, the image quality of each HMP production line is quite different due to the influence of various interference factors such as water vapor, insufficient illumination, and reflection on the surface of the HMP, and there are problems such as noise, blur, and overexposure in the image. This is another major aspect influencing the extraction of image characteristics of surface imperfections on steel plates. In this research, several models identify both normal and period flaws at the same time. On the one hand, Mr. He and Xu3,22) discovered normal flaws using a novel hierarchical learning framework based on convolutional neural networks. In the novel model, a multi-scale receptive field is used to extract multi-scale features, which can better depict defects than feature maps created by a single convolutional layer.
Roll printing and Scratch defects on the surface of HMP generated by changes in the condition of the roll are known as periodic defects because they arise at regular intervals and have a periodic reaction in the time series of defects. If it is not discovered and treated in a timely manner, it will result in batch quality incidents and significant economic losses to the enterprise’s production organization. Long short-term memory network (LSTM) networks add input, forgetting, and output thresholds to the algorithm, making the weights of their own loops changeable and allowing the network to forget the collected knowledge, avoiding the problem of gradient disappearance or gradient enlargement. The LSTM network’s threshold mechanism lets it to store information for a long period, avoiding the problem of gradient vanishing. Each cell has input, forgetting, and output gates, and the three gates employ the sigmoid activation function to govern information transmission in the network, allocating particular information at the present time and then to the information needed by the network at the next moment.
When training samples are restricted, a collection of AutoEncoders is trained to minimize the dimension of the retrieved multi-scale features, which enhances generalization ability. Mr. Liu and Xu23) offer a technique for detecting periodic flaws based on a convolutional neural network (CNN) and LSTM. The CNN network is used to extract the features of the defect picture, and the recovered feature vectors are then input into an LSTM network for defect detection. The attention mechanism is induced into the defect identification network by first performing feature extraction on the periodic defect picture using the CNN convolutional network, and then passing the extraction vector to the Attention mechanism’s LSTM network. Combine all critical information entered in the preceding instant in the concealed state (memory module). The attention mechanism, on the other hand, is more specific about which earlier instant of information is significant (a faulty picture) and assigns matching weights based on the degree of relevance (how similar the input at that moment is to the hidden state at the previous moment). This enables the network to concentrate on the moment of faulty picture input while suppressing the moment of background image input. Improved memory deficiency features to avoid forgetting faulty features because of extended cycles. The enhanced technique determines the validity of earlier input information and applies a quantitative weight depending on its relevance. Finally, the location, kind, length, quantity, and area of surface defects, as well as information on periodic flaws, could be retrieved.
2.3. Defects in Partitioning
Individual MHP defect grades are required for quality evaluation, which is defined by the defects’ influence degree on plate quality, omitting the head, tail, and edge defect information of the plate in the actual manufacturing method. Transverse cracks (TCD), longitudinal cracks (LCD), scratches (SRD), scarring (SAD), fold (FD), and pressed foreign body (PFD) are all key factors influencing MHP quality. Thus, based on expert expertise and unique MHP quality management needs, the various defect classes will be partitioned by the length and areas of individual defects based on their features, as indicated in Table 1. Those prone to flaky and continuous defects, such as indentation (ID), roll printing (RPD), pressed iron oxide scale (PID), and pockmark (PMD), will be split by the plate’s defect area percent. Finally, Table 2 displays the surface defect grades and distribution in HMP. A defect with a higher rating may be thought to be better than one with a lower grade.
Table 2. Grades and partition of surface defects in heavy and medium plate.
| No. | Defects types | Judgement method | Judgment criteria | Quality grade |
|---|
| 1 | Transverse cracks TCD | Length L | L≥1 m | 5 |
| 2 | Longitudinal cracks LCD | 0.5 m≤L<1 m | 4 |
| 3 | Scratch SRD | L<0.5 m | 3 |
| 4 | Scarring SAD | Total areas S | S≥4 cm2 | 5 |
| 5 | Fold FD | 1 cm2<S<4 cm2 | 4 |
| 6 | Pressed foreign body PFD | S<1 cm2 | 3 |
| 7 | Indentation ID | Defects area percent of plate S | S≤5% | 0 |
| 8 | Roll printing RPD | 5%<S≤10% | 1 |
| 9 | Pressed Iron oxide scale PID | 10%<S≤15% | 2 |
| 15%<S≤20% | 3 |
| 10 | Pockmark PMD | 20%<S≤25% | 4 |
| 25%<S≤30% | 5 |
Table 3. Scale for pairwise comparison.
| Intensity of importance | Definition |
|---|
| 1 | Equal importance |
| 3 | Moderate importance |
| 5 | Strong importance |
| 7 | Very strong importance |
| 9 | Extreme importance |
| 2, 4, 6, 8 | The middle value between the above adjacent |
3. AHP Evolution Model
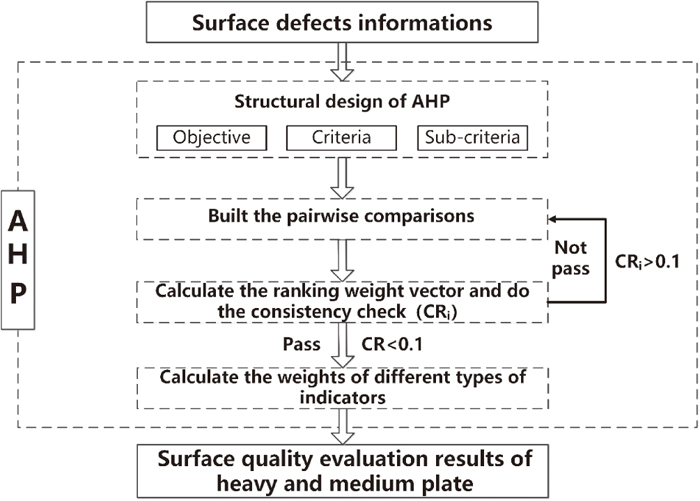
Figure 2 depicts the calculating technique of the SQE process in HMP via AHP, and the essential steps of this approach are as follows.
Step 1: Declare the aims and expected outcomes clearly, then structure the problem into a level hierarchy. The structure of AHP is separated into three components in this paper: objective, criteria, and sub-criteria. The aim level’s purpose is to attain HMP surface quality evaluation findings. Based on defect data, the criterion level is used to define rules for various flaws, particularly those that have a substantial influence on the continuous production method and quality control. The sub-criteria are used to get SQE ratings of HMP.
Step 2: Compare things on the same level using a pairwise comparisons matrix. While a rating scale is used to establish evaluations of the relative attractiveness of each flaw, the exact meaning is indicated in Table 2. A flaw with a higher grade is often seen to be superior (or more enticing) to one with a lower rating.
Step 3: Using the eigenvector approach, compute the ranking weight vector and check for consistency (CRi). If all of the intuitionistic preference relations have sufficient consistency and the Consistency Ratio (CR) is less than 0.1, go to Step 5. Otherwise, continue to Step 4.
Step 4: Repair the pairwise comparisons relations following the decision-makers until they are acceptable.
Step 5: Determine the weights of various sorts of indicators and run the overall ranking and consistency test for the level.
Step 6: Obtain the HMP surface quality evaluation findings.
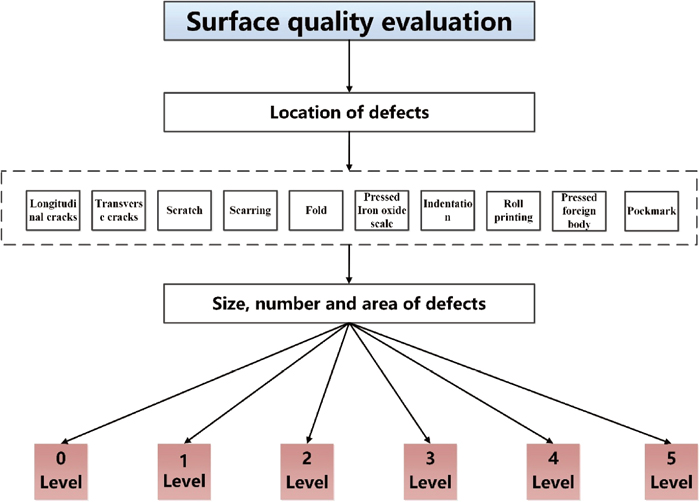
Figure 3 displays the HMP SQE structural design. If there are any flaws in the HMP’s head or tail, they will be easily removed by successive shearing, therefore flaw location is crucial. As a result, when real-time defect data enters the model, the initial step is to check the location of such flaws. Other flaw data, such as size, quantity, and area, should then be discovered and categorized into six levels ranging from 0 to 5.
4. Results and Discussions
The SQE of HMP began with the defects detection system, in which normal defects were identified and classified by a hierarchical learning framework based on convolutional neural networks, and periodic defects, including SRD and RPD, were detected by CNN and LSTM models, and the locations, classifications, numbers, lengths, and areas of surface defects were immediately obtained. The pairwise comparisons matrix derived from the experimental study, special talks, and expert consultations will subsequently be constructed using AHP, as shown in Table 4. And the judgment criterion is achieved by professional knowledge and hands-on experience with the HMP production technique. The greatest eigenvalue of the matrix and the related normalized eigenvector are then computed; the comparative results are displayed in Table 5, which is the outcome of a normalization operation on a column vector from Table 4, and its main function is to compute weights for the relative relevance of different sorts of defects to the impact of quality. As a result, the magnitude of the lambda-n value may be used to quantify consistent matrix A’s degree of inconsistency. However, when generating pairwise comparison matrices, it is not viable to demand the fulfilment of several of the preceding equations. As a result, it is needed that the pairwise comparison matrix have a particular degree of consistency, allowing for some irregularity in the pairwise comparison matrix. According to the results of the investigation, the maximum eigenvalue of absolute value for pairwise comparison matrices that are entirely consistent is equal to the dimensionality of the matrix.
Table 4. Pairwise comparisons matrix for each surface defect.
| Aij | PID | RPD | ID | SAD | LCD | PFD | SRD | TCD | FD | PMD |
|---|
| PID | 1 | 1/3 | 1/3 | 2 | 1/9 | 1/5 | 1/7 | 1/9 | 1/5 | 1/5 |
| RPD | 3 | 1 | 1/3 | 5 | 1/7 | 1/3 | 1/5 | 1/7 | 1/3 | 1 |
| ID | 3 | 3 | 1 | 3 | 1/5 | 1 | 1/3 | 1/5 | 1/3 | 3 |
| SAD | 1/2 | 5 | 1/3 | 1 | 1/9 | 1/5 | 1/7 | 1/7 | 1/5 | 1/3 |
| LCD | 9 | 7 | 5 | 9 | 1 | 7 | 3 | 1 | 5 | 5 |
| PFD | 5 | 3 | 1 | 5 | 1/7 | 1 | 1/3 | 1/5 | 1 | 3 |
| SRD | 7 | 5 | 3 | 7 | 1/3 | 3 | 1 | 1/3 | 3 | 5 |
| TCD | 9 | 7 | 5 | 7 | 1 | 5 | 3 | 1 | 5 | 7 |
| FD | 5 | 3 | 3 | 5 | 1/5 | 1 | 1/3 | 1/5 | 1 | 2 |
| PMD | 5 | 1 | 3 | 3 | 1/5 | 1/3 | 1/5 | 1/7 | 1/2 | 1 |
Table 5. Comparison result of a normalized column vector.
| name | PID | RPD | ID | SAD | LCD | PFD | SRD | TCD | FD | PMD |
|---|
| PID | 0.0211 | 0.0109 | 0.0172 | 0.0426 | 0.0323 | 0.0105 | 0.0164 | 0.0320 | 0.0121 | 0.0073 |
| RPD | 0.0632 | 0.0328 | 0.0172 | 0.1064 | 0.0415 | 0.0175 | 0.0230 | 0.0411 | 0.0201 | 0.0363 |
| ID | 0.0632 | 0.0983 | 0.0517 | 0.0638 | 0.0581 | 0.0524 | 0.0384 | 0.0576 | 0.0201 | 0.1090 |
| SAD | 0.0105 | 0.0066 | 0.0172 | 0.0213 | 0.0323 | 0.0105 | 0.0164 | 0.0411 | 0.0121 | 0.0121 |
| LCD | 0.1895 | 0.2293 | 0.2586 | 0.1915 | 0.2906 | 0.3671 | 0.3454 | 0.2879 | 0.3018 | 0.1816 |
| PFD | 0.1053 | 0.0983 | 0.0517 | 0.1064 | 0.0415 | 0.0524 | 0.0384 | 0.0576 | 0.0604 | 0.1090 |
| SRD | 0.1474 | 0.1638 | 0.1552 | 0.1489 | 0.0969 | 0.1573 | 0.1151 | 0.0960 | 0.1811 | 0.1816 |
| TCD | 0.1895 | 0.2293 | 0.2586 | 0.1489 | 0.2906 | 0.2622 | 0.3454 | 0.2879 | 0.3018 | 0.2542 |
| FD | 0.1053 | 0.0983 | 0.1552 | 0.1064 | 0.0581 | 0.0524 | 0.0384 | 0.0576 | 0.0604 | 0.0726 |
| PMD | 0.1053 | 0.0328 | 0.0172 | 0.0638 | 0.0581 | 0.0175 | 0.0230 | 0.0411 | 0.0302 | 0.0363 |
The conditions for consistency for pairwise comparison matrices, the highest eigenvalue of the absolute value transformed to a matrix, and the dimensions of the matrix are not dissimilar. Assessing whether or not the hierarchy can be validated necessitates a consistency test, and the so-called consistency test refers to the permissible range for finding inconsistencies on A, λ is the largest feature root, n is the only non-zero feature root. Consistency must meet two conditions: one is that the only non-zero feature root of the nth-order conjunctient array is n, and the other is that the greatest feature root of the nth-order positive and reciprocal array A, λ≥n, and A is a conjunction array if and only if λ=n. The larger the degree of inconsistency of the eigenvector corresponding to the largest eigenvalue value as the weight vector indicating the degree of effect of the comparable component on an upper layer factor, the bigger the judgment mistake.
After that, the matrix is consistent, and the results are displayed in Table 6. CI represents the consistency metrics; there is total consistency when CI=0, good consistency when CI is near to 0, and inconsistencies get more severe as CI increases. To quantify the amount of CI, the Stochastic Consistency Indicator RI is introduced. The findings of the Stochastic Consistency Indicator RI are connected to the number of influencing elements, which are normally fixed values; in this article, RI is 1.49. while CR = CI/RI. In general, when the consistency ratio CR is 0.1, the degree of inconsistency of A is deemed to be within bearable limits, and there is sufficient consistency, which passes the consistency test. Accordingly, CR is 0.0617, which is slower than 0.1, suggesting that the conformance test was successful. It was also observed that the defect weight may be represented by the normalized feature vector.
Table 6. Check results of consistency ratio.
| n = 10 |
|---|
|
CI=
λ-n
n-1
| 0.0919 |
| RI | 1.49 |
| Consistency Ratio CR | 0.0617 < 0.1 |
| Pass |
When crack flaws develop during the production process, the operator must normally respond immediately to deal with them and examine the causes. More significantly, periodic flaws should pay more attention to its repeated harm for HMP, which might result in considerable economic losses. As a result, the ‘defect weights’ must account for both the mutual important connection between various types of flaws and the ‘level weights’ of distinct defects within the same type. As indicated in Table 7, the conventional defect levels are classified into 0–5 comprehend and apply to the defect judgment criteria. Items of grade 0 are qualified, while products of grade 5 are rejected; each level is allocated a level weight, as shown in Table 8. Finally, the final score was determined by multiplying the defect weights by the level weights; the findings are displayed in Table 9. The steel types of HMP are Q235, while the quality level is from 0 to 5. According to Table 8, the SAD and TCD have a big influence on the evaluation results, while SRD and PID have little impact on the results. It should be emphasized that the number of periodic flaws, including SRD and RPD, must be larger than two, and the number of large-area defects, including PMD and ID, must be greater than four.
Table 7. Ranking weight for quality grades of plate.
| Grades Level | 0 Level | 1 Level | 2 Level | 3 Level | 4 Level | 5 Level |
|---|
| Weight | 1 | 3 | 5 | 7 | 9 | 11 |
Table 8. Calculation process for surface quality evaluation of heavy and medium plate.
| Rules | Defects
weight | Scaling
defect
weight | Length/L | Area/A | Area percent in plate/S |
|---|
| L<0.5 m | 0.5 m
≤L<1 m | 1 m≤L | A<1 cm2 | 1 cm2
<A<4 cm2 | A≥4 cm2 | S≤5% | 5%<S≤10% | 10%<S≤15% | 15%<S≤20% | 20%<S≤25% | 25%<S≤30% |
|---|
| TCD | 0.2624 | 3.7536 | 26.28 | 33.78 | 41.29 | | | | | | | | | |
| LCD | 0.2712 | 3.8800 | 27.16 | 34.92 | 42.68 | | | | | | | | | |
| SRD | 0.1463 | 2.0923 | 14.65 | 18.83 | 23.01 | | | | | | | | | |
| | | | | | | | | | | | | | |
| SAD | 0.0788 | 1.1272 | | | | 7.89 | 10.15 | 12.40 | | | | | | |
| FD | 0.0393 | 0.5625 | | | | 7.87 | 10.12 | 12.37 | | | | | | |
| PFD | 0.0699 | 1.0003 | | | | 7.00 | 9.00 | 11.00 | | | | | | |
| | | | | | | | | | | | | | |
| ID | 0.0598 | 0.8560 | | | | | | | 0.86 | 2.57 | 4.28 | 5.99 | 7.70 | 9.42 |
| RPD | 0.0364 | 0.5202 | | | | | | | 1.04 | 3.12 | 5.20 | 7.28 | 9.36 | 11.44 |
| PID | 0.0188 | 0.2688 | | | | | | | 1.08 | 3.23 | 5.38 | 7.53 | 9.68 | 11.83 |
| PMD | 0.0171 | 0.2452 | | | | | | | 0.98 | 2.94 | 4.90 | 6.87 | 8.83 | 10.79 |
Table 9. Surface quality evaluation results of heavy and medium plate.
| Slab Number | Steel types | Length/m | Defects number | Main defects | Quality level |
|---|
| S20210123688 | Q235 | 13.3 | 15 | SRD | 0 |
| S20210123689 | Q235 | 9.6 | 7 | SRD | 0 |
| S20210123690 | Q235 | 12.1 | 21 | SRD, PID, FD | 2 |
| S20210123691 | Q235 | 14.3 | 12 | SRD, ID | 0 |
| S20210123692 | Q235 | 11.3 | 25 | SRD, SAD | 3 |
| S20210123693 | Q235 | 13.1 | 36 | SRD, ID, SAD, TCD | 5 |
| S20210123694 | Q235 | 15.5 | 13 | PID, ID | 0 |
| S20210123695 | Q235 | 9.7 | 16 | PID, FD | 1 |
The surface quality assessment system is utilized in combination with the MES system in the manufacturing method to generate the online quality classification, which may direct the auto cut for the head, tail, and edge of plates. The online detection system, in particular, could be used to determine the causes, size, and coordinate position of surface defects, after which the grading norms for the surface quality of MHPs chosen by experts could be developed. After examining the new surface flaws, the SQE system will read the sub-meter data given by the MES system and display the steel grading standard data based on the grade data. Finally, the SQE system was able to get the HMP surface quality ratings. Following that, the data will be timely transmitted to the relevant inspection point via the MES system, resulting in a multi-point quality monitoring system.
The following are the advantages of the AHP model as presented in this research. To begin, the type, position, size, and amount of surface defects in HMP were generated as a paired comparison matrix, which ideally represented the effect of surface defects on HMP surface quality, setting a suitable basis for the future quality evaluation. Second, unlike traditional evaluation models that use the same standard to evaluate the parameters,28,29) our study found that different calculation methods were used for different types of index scores, such as scratches, transverse cracks, longitudinal cracks, scarring, folding, and so on, which have a noticeable impact on HMP quality. Because length has a direct impact on the plates, TCD, LCD, and SRD flaws are determined by length for a quality grade. The SAD, FD, and PFD are computed using total areas for the same reasons, but the ID, RPD, PID, and PMD are calculated using plate area percentage. These numerous indications, which correspond to the division of different calculation techniques, assist in indicating the severity of the damage caused by various sorts of defects to the surface quality, and may better fit the plate’s quality grade value index. Third, the HMP’s cutting position in the length direction is based on defect data and the outcomes of the surface quality assessment model, which could also optimize the waste of previous cutting to length, minimize worker labor intensity, and increase the intelligence level of the manufacturing method.
5. Conclusions
The generation of surface defects on HMP was studied initially, followed by methods for recognizing normal and periodic flaws using a new hierarchical learning framework based on convolutional neural networks (CNN) and long short-term memory (LSTM). On this basis, the defects grades division model was created, based on expert experiences and the unique requirements of corporate quality management. Then, in HMP, AHP devised a surface quality evaluation procedure based on the length, total defect area, and total area of steel plates of different types of surface defects, with different calculation techniques utilized for different types of defects. Finally, overall assessment ratings will be calculated. The findings of the quality assessment might not only minimize waste from the previous cutting to length approach, but also enhance quality evaluation throughout the smelting process, boost production efficiency, and reduce quality objections.
Acknowledgments
The authors would like to express their gratitude to National Key R&D Program of China (2021YFB3202400&2021YFB3202403) and National Natural Science Foundation of China for their financial support (51874022).
References
- 1) T. P. Bui, Y. Miyashita, Y. Morikage, T. Tagawa, T. Handa, Y. Mutoh and Y. Otsuka: ISIJ Int., 61 (2021), 424. https://doi.org/10.2355/isijinternational.ISIJINT-2020-311
- 2) H. Duan, J. Wei, L. Qi, X. Wang, Y. Liu and M. Yao: Steel Res. Int., 92 (2021), 2100168. https://doi.org/10.1002/srin.202100168
- 3) D. He, K. Xu, P. Zhou and D. Zhou: Opt. Lasers Eng., 117 (2019), 40. https://doi.org/10.1016/j.optlaseng.2019.01.011
- 4) J. Na, G. Kim, S. H. Kang, S. J. Kim and S. Lee: Acta Mater., 214 (2021), 116987. https://doi.org/10.1016/j.actamat.2021.116987
- 5) X. Wu, X. Liu and F. Yuan: ISIJ Int., 61 (2021), 269. https://doi.org/10.2355/isijinternational.ISIJINT-2020-295
- 6) H. Wang, S. Wei, R. Huang, S. Deng, F. Yuan, A. Xu and J. Zhou: ISIJ Int., 59 (2019), 2044. https://doi.org/10.2355/isijinternational.ISIJINT-2019-128
- 7) S. Zhou, S. Wu, K. Cui and H. Liu: ISIJ Int., 61 (2021), 2111. https://doi.org/10.2355/isijinternational.ISIJINT-2021-024
- 8) W. Wang, K. Lu, Z. Wu, H. Long, J. Zhang, P. Chen and B. Wang: ISIJ Int., 61 (2021), 1579. https://doi.org/10.2355/isijinternational.ISIJINT-2020-451
- 9) R. Wei, Y. Song and Y. Zhang: ISIJ Int., 60 (2020), 539. https://doi.org/10.2355/isijinternational.ISIJINT-2019-335
- 10) D. He, K. Xu and P. Zhou: Comput. Ind. Eng., 128 (2019), 290. https://doi.org/10.1016/j.cie.2018.12.043
- 11) J. Y. Louhi Kasahara, S. Minato, A. Moro, H. Woo, A. Yamashita and H. Asama: J. Jpn. Soc. Precis. Eng., 86 (2020), 975. https://doi.org/10.2493/jjspe.86.975
- 12) X. Zhao, C. Dong, P. Zhou, M. Zhu, J. Ren and X. Chen: IEICE Trans. Fundam. Electron. Commun. Comput. Sci., E102.A (2019), 1817. https://doi.org/10.1587/transfun.E102.A.1817
- 13) T. Koeipensri, T. Yasuda and M. Jindai: Proc. Jpn. Jt. Autom. Control Conf., 63 (2020), 268. https://doi.org/10.11511/jacc.63.0_268
- 14) S. Feng, C. Huang, J. Wang and Z. Jia: Mater. Sci. Semicond. Process., 93 (2019), 238. https://doi.org/10.1016/j.mssp.2018.12.037
- 15) A. K. M and K. Gupta: Optik, 196 (2019), 163199. https://doi.org/10.1016/j.ijleo.2019.163199
- 16) S. Pasalopoulos, P. Avrampos and G. C. Vosniakos: Procedia Manuf., 51 (2020), 748. https://doi.org/10.1016/j.promfg.2020.10.105
- 17) R. S. Scotton, L. M. Guerrini and M. P. Oliveira: Prog. Org. Coat., 158 (2021), 106389. https://doi.org/10.1016/j.porgcoat.2021.106389
- 18) B. Yu, K. Son and K. Lee: J. Prosthet. Dent., 126 (2021), 231. https://doi.org/10.1016/j.prosdent.2020.04.028
- 19) M. Jaafar, H. Makich and M. Nouari: J. Manuf. Process., 69 (2021), 567. https://doi.org/10.1016/j.jmapro.2021.07.062
- 20) M. D. de Oliveira, O. L. T. de Rezende, J. F. R. de Fonseca and M. Libânio: J. Water Process Eng., 32 (2019), 100890. https://doi.org/10.1016/j.jwpe.2019.100890
- 21) O. Akoto, A. Adopler, H. E. Tepkor and F. Opoku: Groundw. Sustain. Dev., 15 (2021), 100654. https://doi.org/10.1016/j.gsd.2021.100654
- 22) D. He, K. Xu and D. Wang: Image Vis. Comput., 89 (2019), 12. https://doi.org/10.1016/j.imavis.2019.06.008
- 23) Y. Liu, K. Xu and J. Xu: Appl. Sci., 9 (2019), 3127. https://doi.org/10.3390/app9153127
- 24) A. Ishizaka and A. Labib: Expert Syst. Appl., 38 (2011), 14336. https://doi.org/10.1016/j.eswa.2011.04.143
- 25) T. Wang, Z. Du, K. Zhang, K. Chen, F. Xiao and P. Ye: Energy Rep., 7 (2021), 90. https://doi.org/10.1016/j.egyr.2021.02.017
- 26) E. Fernando and P. Siagian: Procedia Comput. Sci., 179 (2021), 232. https://doi.org/10.1016/j.procs.2021.01.002
- 27) M. Mondal, S. Haldar, A. Biswas, S. Mandal, S. Bhattacharya and S. Paul: Reg. Stud. Mar. Sci., 44 (2021), 101779. https://doi.org/10.1016/j.rsma.2021.101779
- 28) E. B. Agyekum, F. Amjad, L. Shah and V. I. Velkin: Sustain. Energy Technol. Assess., 47 (2021), 101521. https://doi.org/10.1016/j.seta.2021.101521
- 29) Y. Liu, C. M. Eckert and C. Earl: Expert Syst. Appl., 161 (2020), 113738. https://doi.org/10.1016/j.eswa.2020.113738
- 30) N. Ikawa, Y. Tamaoka and A. Hosoda: Concr. Res. Technol., 29 (2018), 101. https://doi.org/10.3151/crt.29.101
- 31) S. Komatsu, R. Tajima and A. Hosoda: Concr. Res. Technol., 29 (2018), 33. https://doi.org/10.3151/crt.29.33