Casting and Solidification
Comprehensive Understanding of the Role of Carbon Black in the Sintering and Melting Behavior of Mold Flux
2022 Volume 62 Issue 8 Pages 1657-1665
Details
2022 Volume 62 Issue 8 Pages 1657-1665
Carbon materials play an important role in controlling the sintering and melting behaviors of mold flux. However, the reactions between carbon and mold fluxes and corresponding effects on the properties of mold fluxes are ignored in previous studies. The effects of carbon black on the sintering and melting behavior of mold flux during the heating process were systematically investigated by TG-FTIR, DSC, XRD, TEM, SEM, XPS, Raman spectroscopy, and viscosity measurement. The results showed that: carbon black between the mineral particles was visualized by TEM, and Ca4Si2O7F2 as sintering phase was not formed until 1300°C in CaO–SiO2–CaF2–Na2O slag on account of the insulation of carbon black. Residual carbon black absorbed on the surface of slag droplets suppressed the melting by preventing the aggregation of droplets. Besides, SiC as production of the carbon-slag reaction significantly increased the slag viscosity by improving the polymerization degree of molten slag.
As an essential silicate material in the continuous casting process, mold flux is of great significance for the smoothness of continuous casting production and improvement of slab quality.1,2,3,4,5,6) In general, mold fluxes will go through two vital stages during the whole continuous casting process. One is the heating stage. After being added to the mold, mold powder will successively undergo the sintering and melting processes under the heating of molten steel and form a three-layer structure containing powder layer, sintering layer, and molten slag layer. A reasonable layer structure has an essential influence on thermal insulation, oxidation protection, lubrication, and inclusion absorption performance of mold fluxes.7,8,9) The other one is the cooling stage, in which the molten slag will infiltrate into the gap between the water-cooled copper mold and steel shell and partially solidify to form solid slag film. The simultaneous existence of liquid slag film and solid slag film enables mold fluxes to realize the lubrication and heat transfer control at the same time.10,11,12,13)
Mold fluxes typically contain SiO2, CaO, Na2O, CaF2, and carbon additives with minor amounts of alkali metal oxides. Carbon additives play a vital role in the sintering and melting behaviors of mold flux during heating.14,15) Due to the characteristics of high melting point, large specific surface area, and large contact angle with liquid slag, carbon additives can be dispersed between other raw materials, maintain solid-state during heating, and delay the aggregation and growth of slag droplets so as to inhibit the sintering and melting behavior of mold fluxes.16) Typical carbon additives include carbon black, graphite, and coke.17) Due to the smaller size and larger specific surface area, carbon black has the most remarkable effect on the sintering and melting behavior of mold flux, so it has become the most commonly used carbon additive. Theoretically, carbon additives in mold fluxes will burn out during the heating process and will not affect the performance of molten slag. However, the temperature gradient and low oxygen atmosphere in the three-layer slag structure result in forming a carbon-rich layer between the sintering and molten layers.18) The direct contact between the carbon-rich layer and the liquid slag layer makes carbon dissolve in the liquid slag and changes the physical and chemical properties of liquid slag.19,20,21)
It is worth noting that there are still two deficiencies in the study of carbon additives in the field of mold fluxes.2,8,22) Firstly, researchers generally believe that carbon additives do not react with mold fluxes. Therefore, carbon additives will be removed in advance in the measurement of melting point, viscosity, crystallization properties of mold fluxes. However, the affinity of carbon to oxygen at high temperatures is larger than that of Cu, Fe, Al, Si.23,24,25,26,27) Hence, carbon could be used to reduce SiO2 to silicon.28) Yu29) also found that carbon could react with CaO–SiO2–CaF2 slag at high temperatures to produce SiC, and the addition of SiC would affect the viscosity of slag.30,31) In consequence, the results of performance tests obtained from carbon-removed slag will deviate from the actual one. Secondly, an essential premise for carbonaceous materials to control the sintering and melting behavior of mold flux is that carbon can be evenly distributed among other mineral raw materials. and the surface of molten slag droplets. Scholars hold that carbonaceous particles will be distributed on the surface of mineral raw particles and molten slag and act as isolation materials to delay the sintering phase formation and slag droplets’ aggregation.17) However, the above explanation of the distribution of carbonaceous materials is mainly based on theoretical reasoning, and has not been verified by experiments, resulting in insufficient understanding of the actual action mechanism of the carbonaceous materials in mold fluxes. In summary, the lack of research on the distribution of carbonaceous materials, the reaction mechanism between carbonaceous materials and slag, and its influence on slag properties prevent the slag rim and carbon-rich layer related to carbonaceous materials from being effectively controlled. It further leads to the deterioration of steel shell quality and steel leakage accidents in the actual continuous casting process. Therefore, researches on the distribution of carbonaceous materials, the reaction between carbonaceous materials and slag, and its influence on slag performances have important value for improving the quality of steel shell and ensuring the smoothness of the continuous casting process.
In this paper, the reaction mechanism between carbon black and CaO–SiO2–CaF2–Na2O slag during the heating process and the corresponding temperature ranges were characterized by TG-FTIR, DSC, and XRD. Besides, TEM, XPS, and SEM were employed to determine the distribution of carbon black in mold powder and molten slag, and the effect of carbon-slag reaction on the viscosity of slag was evaluated by rotational viscometer. It could provide a better understanding of the role carbon plays in mold flux during the heating process and a theoretical guidance for the design of mold fluxes.
All experimental samples were prepared from reagent grade powders of CaO, amorphous SiO2, CaF2 and Na2CO3 (99.9% purity, purchased from Shanghai Aladdin Biochemical Technology Co., Ltd.). Carbon black (Taiyuan, China, shown in Table 1) was added to the CaO–SiO2–CaF2–Na2O slag to explore the effect of carbon additive on the reaction behavior of mold fluxes during the heating process. All materials were mixed and ground thoroughly in a 100 mm diameter agate mortar according to the proportion in Table 2. Sample A without carbon black was used as blank sample.
| Average size [um] | Specific surface area [m2g] | Purity | Mineralogical phase | |
|---|---|---|---|---|
| Carbon black | 1.9 | 106 | 92% | amorphous |
| Sample | Chemical compositions | ||||
|---|---|---|---|---|---|
| CaO | SiO2 | CaF2 | Na2CO3 | Carbon black | |
| A | 35.6 | 25.4 | 16.5 | 22.5 | – |
| B | 29.4 | 21.0 | 13.6 | 18.5 | 17.5 |
The reaction mechanism between carbon and slag was investigated by TG-FTIR. The TG (STA 449F3, Netzsch, German) and FTIR (Nicolet Is50, Thermofisher, America) were connected by a stainless steel pipe equipped with a 300°C heater. Before the experiment, standard weights were used to calibrate the balance of TG. Then, 200 mg sample was heated at a constant rate of 10°C/min from 100°C to 1400°C in a zirconia crucible (99.8% purity) with a diameter of 18 mm and a height of 10 mm under N2 (99.999%, 80 mL/min).
2.2.2. DSCThe temperature range of reaction in slag during the heating process was determined by DSC (STA 449F3, Netzsch, German). Before the experiment, four metal samples (ln, Zn, Al, Au) were used to calibrate the temperature and sensitivity of the instrument. After that, 15 mg sample was placed in an zirconia crucible (99.9% purity) (Φ6.4 mm×h4 mm) and heated from 100°C to 1400°C at a heating rate of 10°C/min in N2 atmosphere. (99.999%, 80 mL/min).
2.2.3. XRDThe formed mineralogical phases in the samples were identified by XRD (EMPYREAN, Panalytical, Netherlands). The XRD patterns were collected utilizing Cu–Ka radiation at a scan rate of 10°/min with the 2θ range from 10° to 90°.
2.2.4. TEMTEM (Libra 200, Carl Zeiss, Germany) with a 200 kV accelerating voltage was adopted to visualize the distribution of carbon in slags. Samples were first wet ground into powders in an agate mortar. Then, the powders were dispersed in pure ethanol and ultrasonically agitated for 30 mins. Eventually, drops of the suspension were placed on copper TEM grids.
2.2.5. SEMSEM (JSM-7800F, JEOL, Japan) was employed to record the morphology of samples pretreated at different temperatures during the heating process.
2.2.6. XPSThe elements changes of slag after melting were characterized by XPS (ESCALAB 250xi, Thermo Scientific, USA) equipped with an Al Kα X-ray source (1253.6 eV) operating at 3.0 kV and 25 mA.
2.2.7. Viscosity MeasurementThe viscosity of samples was measured by a Brookfield viscometer (model DV2TLV, Brookfield Engineering Laboratories, USA), as shown in Fig. 1. A graphite crucible containing about 200 g well-mixed powder sample was placed into the MoSi furnace. Then, the sample was heated to 1300°C for 30 min in N2 gas (99.99%, 0.5 L/min) to ensure the slag was utterly melted and homogeneous. After that, the spindle was slowly immersed into the melt and rotated at 20 rpm. Finally, the viscosity measurement started as the temperature was cooled from 1300°C to 1000°C at a rate of 5 K/min.

Experimental apparatus for viscosity measurement in the study. (Online version in color.)
After the viscosity measurement, the slag samples were reheated to 1300°C for 60 min and then were rapidly quenched into water. Then, glassy samples were grounded to fine powders and characterized by the LabRAM HR Evolution system (LabRAM HR Evolution, HORIBA Jobin Yvon S.A.S, France) with a 532 nm laser source. An affiliated microscope was used to keep the laser beam focused on the samples.
Figure 2 shows the TG curves of the two samples. It can be seen that both samples A and B underwent three stages of weight loss during the heating process. The first stage range from 400°C to 600°C, was owed to the evaporation of bound water in CaO. The mass loss of sample B is smaller than that of sample A ascribed to the decrease of CaO. The weight loss of samples between 600°C to 900°C was attributed to the decomposition of unstable Na2CO3. What should be paid more attention to is that the last stage (900°C to 1400°C), the massive difference in mass loss of samples A and B, indicated the existence of reaction between carbon and mold fluxes.
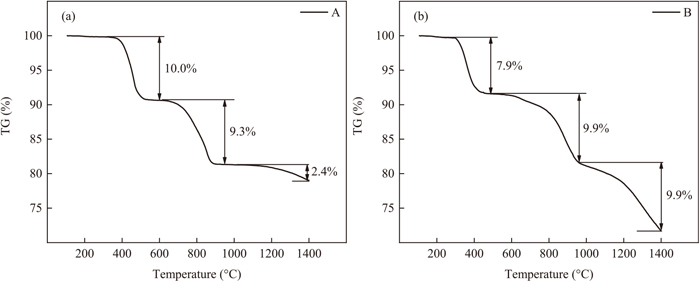
TG results of samples. (a) A; (b) B.
The detailed evolution of gas products from the samples can be explained using the FTIR spectrogram combined with the corresponding derivative weight loss curve in Fig. 3. It can be observed that the release of H2O and CO2 have good accordance with the weight loss, which strongly proves the results of TG. Surprisingly, the formation of CO from sample B was detected in the range of 1000°C to 1400°C accompanied by sharp weight loss, which was caused by the reaction between carbon and mold fluxes. Moreover, the slight mass loss of sample A occurred from 1000°C to 1400°C, while no peak was observed in FTIR curves. This abnormal phenomenon would be explained by the following XPS results.

The FTIR absorbance of main gaseous products from samples and corresponding DTG curves. (a) A; (b) B. (Online version in color.)
The thermal behavior of samples during the heating process was determined by DSC to analyze the difference in the reaction mechanism more clearly. Figure 4 depicts the DSC curves of both samples during the heating process. Similar endothermic peaks were observed in samples A and B at 466°C and 450°C, respectively, which further verified the evaporation of bound H2O. The endothermic peak in the DSC curve of sample B at 890°C could be due to the decomposition of Na2CO3, which is in good agreement with the results of TG-FTIR. However, three exothermic peaks occurred in sample A between 660°C to 1000°C, although the overall endothermic trend. It may come from the simultaneity of solid-phase reactions and decomposition of Na2CO3. As the temperature continued to rise, the sharp endothermic peak at 1130°C associated with no substantial mass loss demonstrated sample A had melted. As for sample B, the exothermic peak representing the melting behavior did not appear, suggesting the addition of carbon black significantly impeded the melting of mold flux. The endothermic peak with 1200°C to 1400°C was in accord with TG-FTIR results, further indicating the occurrence of carbon-slag reaction and the melting of mold fluxes.

DSC curves of samples. (a) A; (b) B.
According to the results of TG-FTIR and DSC, several temperature points in the solid-phase reactions stage of samples A and B were selected, respectively. Under the same conditions as the TG-FTIR experiment, 800 mg sample A was divided into three parts and heated at 600°C, 800°C, 1000°C, and 1400°C for 30 minutes in the TG to obtain sample A-600°C, A-800°C, A-1000°C, A-1400°C, and sample B-1000°C, B-1200°C, B-1300°C, and B-1400°C were obtained by similar steps. The above samples were used for XRD, SEM, and XPS characterizations in order to investigate the changes in microstructure, phases, and compositions of mold fluxes during heating.
Figure 5 shows the formed phases in samples A and B during the heating process. As shown in Figs. 5(a), 5(b), 5(c), 5(d), and 5(e), cuspidine (Ca4Si2O7F2) formed at 800°C in sample A, which was detected in sample B until 1300°C. It evidently attests that carbon black inhibited the sintering of mold flux in view of cuspidine is the main sintering phase.32,33) In addition, SiC as the product of the reaction between carbon black and mold flux was found firstly in sample B at 1300°C. The peak for SiC enhanced as temperature raised to 1400°C, accompanied by the formation of CaO and CaF2, corresponding to the previous study. According to the comprehensive characterization of TG-FTIR, DSC, and XRD, the essence of the reaction between carbon black and mold fluxes had been uncovered. As shown in Eq. (1),29) cuspidine was reduced to CaO, CaF2, SiC, and CO partly by the added carbon black at high temperatures. Considering that SiC could influence the viscosity of slag,31) the effect of reaction between carbon black and mold fluxes on the performance of mold fluxes will be evaluated below.
| (1) |

XRD analysis of samples at different temperatures. (a) A at 600°C; (b) A at 600°C; (c) B at 1000°C; (d) B at 1200°C; (e) B at 1300°C; (f) B at 1400°C.
As mentioned above, the premise that carbon black can control the sintering and melting behavior of mold fluxes is that carbon black is sustainably absorbed on the surface of mold fluxes throughout the heating process. TEM-EDS was utilized to characterize the initial distribution of carbon black in mold fluxes before heating. As shown in Fig. 6(a), the mineral particles in sample A directly contacted each other, and low melting-point phase will form at the contact point through the solid-phase reactions between various mineral particles during the heating process. As a result, the sintering and melting behaviors in mold fluxes without carbon black will appear in advance. On the contrary, the mineral particles were isolated by carbon black in sample B (Fig. 6(b)), which could be clearly verified by the EDS data. As shown in Fig. 7, the existence of carbon black between the mineral particles effectively impeded the diffusion and subsequent solid-phase reactions between mineral particles, resulting in cuspidine was not formed as the main sintering phase until 1300°C (Fig. 7).

TEM images of samples before heating. (a) A; (b) B. (Online version in color.)

Schematic diagram of inhibition of carbon black on sintering. (Online version in color.)
Figure 8 shows the morphology of sample B pretreated at 1000°C and 1400°C. It can be seen from Figs. 8(a), 8(b) that the mineral particles maintained irregular shapes at 1000°C. However, a great number of spherical particles with similar size to the mineral particles were formed in sample B as the temperature reached 1400°C (Figs. 8(c), 8(d)), and the ultra-large particles formed by further aggregation of spherical particles were not observed. It was because the irregular mineral particles melted to form droplets under surface tension when the temperature closed to the melting point, while the residual carbon black on the surface of droplets prevented the aggregation and growth of droplets relying on its non-wetting characteristics with liquid slag.
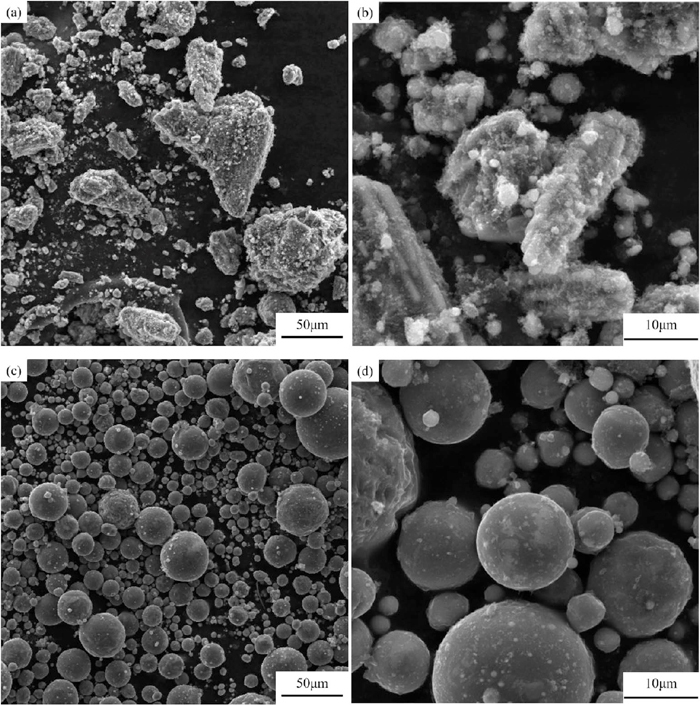
SEM images of sample B at different temperatures and magnification. (a) 1000°C, 500×; (b) 1000°C, 3000×; (c) 1400°C, 500×; (d) 1400°C, 3000×.
Although the results of TEM and SEM have proved the inhibiting effects of carbon black on the sintering and melting behavior of mold fluxes, what should be mentioned is that the above conclusion is based on residual carbon black was still absorbed on the surface of droplets after heating. In order to confirm this hypothesis, XPS with shallow detection depth was conducted to investigate the distribution of carbon in samples A and B after heating. Sample B that had been heated to 1400°C was divided into two parts, and one of them was pretreated at 900°C for 2 h in a muffle furnace (air atmosphere) again to remove the residual carbon black. Sample A without carbon black was acted as a blank sample. Figure 9 shows the C1s spectra of samples. A small peak was obtained in the C1s curve of sample A, which may come from CO2 absorbed on the surface. Sharp peaks were also observed in the C1s curve of sample B before and after the removal of carbon black, and the peak intensity markedly decreased after decarburization, which demonstrates that carbon black was coated on the surface of droplets in sample B as expected.

Detailed XPS spectra curves of C1s of samples at 1400°C. * represents the sample without decarburization pretreatment. (Online version in color.)
Furthermore, it is confusing that samples A showed slight weight loss without any detected gas volatile. XPS was adopted to determine the composition change of samples before and after melting to solve this puzzle. Figure 10 exhibits the detailed XPS spectra of samples A and B at 1000°C and 1400°C. It can be found that the Na and F peaks sharply decreased in both samples A and B with temperature increased from 1000°C to 1400°C, which could be explained by the volatilization of NaF, and the similar phenomenon had been observed in previous studies.34,35,36) Besides, the reason why FTIR could not detect NaF volatile is that NaF had condensed in the pipe due to its high boiling point (1695°C). It is important to note that the intensity of O peak in sample B also weakened as the temperature raised due to the generation of CO.

Detailed XPS spectra curves of Na1s, F1s, and O1s of samples at 1000°C and 1400°C. (a) A–Na; (b) A–F; (c) A–O; (d) B–Na; (e) B–F; (f) B–O. (Online version in color.)
Figure 11 presents the viscosity measurement results of samples A and B. The samples used for viscosity measurement had been heated to 1300°C for 30 minutes before the measurement, and sample B was thoroughly decarbonized in a muffle furnace to avoid the influence of residual carbon on the viscosity measurement results. It could be seen from the viscosity-temperature curves in Fig. 11 that the viscosity of both slags was decreased with the increasing temperature. What should be paid more attention to is that B’s viscosity was significantly larger than that of A, owing to SiC produced by the carbon-slag reaction, which may be caused by SiC complicated the microstructure of molten slag.

Measured viscosity values as a function of temperatures for samples. (Online version in color.)
Considering the viscosity of melt is related to its structure, Raman spectroscopy was adopted to understand the quantitative structural information of molten slag to verify the influence of SiC on the viscosity of molten slag.37,38,39,40) The silicate network tetrahedral vibration band of between 800 cm−1 to 1200 cm−1 deconvoluted by Gaussian method was used to analyze the [SiO4]4− tetrahedral structural unit.41,42,43) Figure 12 shows the deconvoluted Raman peaks of samples A and B. The complexity of slag microstructure was evaluated by the content of Qn and degree of polymerization represented as the quantity ratio of Q3/Q2, as shown in Table 3. Obviously, the formation of SiC led to the fraction of Q0 and Q1 decreased companied with the increase of Q2 and Q3, and DOP reveals the same trend. In view of carbon mainly attaches to Si in the form of Si–C bond in the silicon oxy-carbide glass,44,45,46) four possible connection modes named CMx (x=1–4, x represents the number of Si–C bonds) were established to describe the existence of C atom in silicate network, as shown in Fig. 13. On the one side, one single C atom could link several Si atoms by playing the role of bridging, just like CM2, CM3, and CM4. On the other side, the unsaturated carbon atom in CM1 to CM3 may connect to non-bridging oxygen in the silicate network.47,48) It means the network structure of silicate was complicated by SiC, resulting in the increase of viscosity, which is consistent with that discussed earlier.

Deconvoluted Raman peaks of samples: (a) A; (b) B. (Online version in color.)
| Sample | DOP (Q3/Q2) | Qn species | |||
|---|---|---|---|---|---|
| Q0 | Q1 | Q2 | Q3 | ||
| A | 0.24 | 17.61 | 8.30 | 59.74 | 14.35 |
| B | 0.26 | 14.60 | 7.67 | 61.51 | 16.22 |

Four possible connection modes of C atom in the silicate network. (Online version in color.)
The distribution of carbon black, the reaction between carbon black and slag, and its influence on slag performances were deeply considered by TG-FTIR, DSC, XRD, TEM, SEM, and XPS. The main conclusions were as follows:
(1) Three main stages of weight loss were observed in both slags during the whole heating process. The first two stages of both slags came from the moisture evaporation from 400°C to 600°C and carbonate decomposition from 400°C to 600°C. For CaO–SiO2–CaF2–Na2O slag, the last mass loss is attributed to NaF volatilization. In contrast, the more considerable mass loss of CaO–SiO2–CaF2–Na2O–C slag was the result of NaF volatilization and carbon-slag reaction.
(2) The sintering and melting behavior of mold fluxes were suppressed by the sustained existence of carbon on the surface of mineral particles and slag droplets during the heating process. The main sintering phase (Ca4Si2O7F2) was not formed until 1300°C in CaO–SiO2–CaF2–Na2O–C slag, and the melting temperature ranges of CaO–SiO2–CaF2–Na2O–C slag was also higher than that of CaO–SiO2–CaF2–Na2O slag.
(3) Carbon black added in mold fluxes reacted with Ca4Si2O7F2 to produce SiC, which remarkably increased the viscosity of molten slag by improving the structural complexity of molten slag.
This work was supported by the National Natural Science Foundation of China (No. 51574050).