Abstract
Zn–Ni alloys were electrodeposited on a Cu electrode at 10–5000 A·m−2, 5 × 10⁴ C·m−2, 293 K, 313 K, and 333 K in unagitated zincate solutions containing the reaction product of epichlorohydrin and imidazole (IME) as a brightener. The synergistic effect of IEM and solution temperature on the deposition behavior of Zn–Ni alloys was investigated. The transition current density at which the deposition behavior shifted from normal to anomalous one decreased with IME at 293 K, but did not change regardless of IME addition at 313 K and 333 K. The suppression effect of IME on the Zn and Ni depositions during alloy deposition was observed at 293 K while at 313 K and 333 K, the suppression effect decreased on the Zn deposition but was maintained on the Ni deposition. Therefore, Ni content in deposits significantly decreased with IME as the temperature increased. The current efficiency of Zn deposition significantly decreased with IME at 293 K, with a small degree of decrease at 313 K and 333 K. The C content in deposits was the highest at 293 K and decreased with increasing solution temperature, indicating that the adsorption ability of IME on the cathode decreases with the increasing temperature. As a result, the suppression effect of IME on the Zn deposition decreases with the increasing temperature. The gloss of deposited films was the highest at 293 K, attributed to the IME adsorption ability being large at 293 K and deposited films with fine crystals becoming smooth.
1. Introduction
Zn–Ni alloy plating exhibits a better corrosion resistance than Zn plating; thus, it is applied to automobiles, home appliances, building material parts, etc.1,2,3,4,5,6) Zn–Ni alloy plating is industrially performed from a sulfate or a chloride solution. However, zincate solution is also used to improve the throwing power.7,8,9,10,11) Reportedly, in Zn–Ni alloy deposition from sulfate and chloride solutions, anomalous co-deposition behavior occurs, in which the electrochemical base Zn deposits preferentially over noble Ni.12,13,14,15,16) Unlike the sulfate and chloride solutions, a brightener is typically added to the zincate solution for Zn–Ni alloy deposition. Although many reports have demonstrated the relationship between the appearance qualities of the deposited films from the zincate solution and the brightener,17,18,19,20,21) few have reflected the effect of the brightener on the electrochemical reaction.22,23) Therefore, the authors selected a reaction product of epichlorohydrin and imidazole (IME) as a brightener, reported to have a brightening effect in Zn deposition from a zincate solution in the previous report, and the effect was investigated. The deposition behavior shifts from normal to anomalous type at the transition current density. When IME is added, the transition current density is reduced due to suppression of hydrogen evolution, and both Zn and Ni deposition are suppressed to reduce the current efficiency of alloy deposition, the Ni content of the deposited films decreases because Ni deposition is more strongly suppressed.24,25)
Conversely, although the solution temperature affects the deposition overpotential, throwing power, metal salt solubility and solution conductivity, etc.,26) and is an extremely important factor in electrodeposition, few studies have reported the effect of solution temperature on the deposition behavior of Zn–Ni alloy from zincate solution. In the region wherein the charge transfer process is rate-determining, Ni deposition is promoted more than Zn deposition when the solution temperature is increased. Therefore, the Ni content of the deposited films increases with the solution temperature.27) Reportedly, the Ni content increases significantly as the solution temperature increases above 323 K,28) but the details are unknown. In the electrodeposition from an electrolytic solution with a brightener, the effect of the brightener may differ depending on the solution temperature, with a possible synergistic effect of the brightener and solution temperature on the deposition behavior, but the details are unknown. The synergistic effects of IME and solution temperature on the deposition behavior were investigated based on the partial polarization curves of Zn and Ni deposition, hydrogen evolution, the appearance, and microstructure of the deposited films.
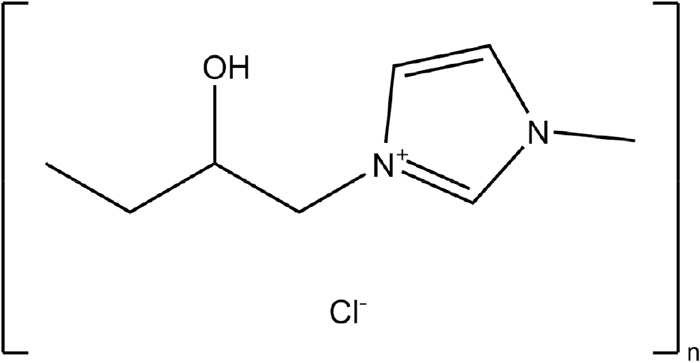
2. Experimental
Table 1 shows the composition of the zincate solution and the electrolysis conditions for the Zn–Ni alloy deposition. The electrolytic solutions were prepared by dissolving the reagent-grade ZnO (0.15 mol·dm−3), NiSO4·6H2O (0.016 mol·dm−3), N(CH2CH2OH)3 (0.34 mol·dm−3), and NaOH (2.5 mol·dm−3) in distilled and deionized water. The reaction product of epichlorohydrin and IME was prepared as previously reported.29,30) 6.81 g of IME was placed in 100 ml of pure water, and the temperature was raised to 313–323 K. Then, 9.25 g of epichlorohydrin was gradually added dropwise below 333 K while stirring the solution with a magnetic stirrer. After the epichlorohydrin addition, the temperature was raised to 353 K and refluxed for about 2 h with stirring to obtain IME. The structural formula of IME is shown in Fig. 1. Electrolysis was performed by the constant current electrolysis method without stirring at the current density of 10–500 A·m−2, amount of electricity of 5 × 10⁴ C·m−2, and solution temperatures of 293 K, 313 K, and 333 K. The amount of electricity of 5 × 10⁴ C·m−2 corresponds to a film thickness of 2.4 μm assuming the deposition of pure Zn at a current efficiency of 100%. A Cu plate (1 cm × 2 cm) was used as the cathode and Pt plate (1 cm × 2 cm) as the anode. However, when preparing samples for gloss evaluation, scanning electron microscopy (SEM) observation, and XRD analysis, a Fe plate (1 cm × 2 cm) was used as the cathode. The obtained deposited films were dissolved in nitric acid, and Zn and Ni were determined by the ICP optical emission spectroscopy to obtain the composition of the deposited alloy and the current efficiencies of Zn and Ni deposition. Partial current densities for Zn and Ni deposition and hydrogen evolution were calculated by multiplying the total current density by the respective current efficiency (%)/100. An Ag/AgCl electrode (saturated KCl, 0.199 V vs. NHE, 298 K) was used as a reference electrode to measure the polarization curves, but the potentials were converted to the standard hydrogen electrode and displayed. The gloss of the deposited films was evaluated by a spectrophotometer (Konica Minolta, Inc. CM-3610d). The light source was a pulsed xenon lamp with a diameter of 8 mm. The diffuse illumination was performed using an integrating sphere, and the total reflectance (SCI method, including specular reflectance) and diffuse reflectance (SCE method, removing specular reflectance) were measured in the 8° direction. The gloss was evaluated by subtracting the diffuse reflectance (SCE method) from the total reflectance (SCI method).31)
Table 1. Solution compositions and electrolysis conditions.
| ZnO | (mol∙dm−3) | 0.15 | Current density (A∙m−2) | 10–500 |
| NiSO4∙6H2O | (mol∙dm−3) | 0.016 | Temperature (K) | 293, 313, 333 |
| N(CH2CH2OH)3 | (mol∙dm−3) | 0.34 | Amount of charge (C∙m−2) | 5 × 10⁴ |
| NaOH | (mol∙dm−3) | 2.5 | Cathode | Cu (1 × 2 cm2) |
| Reaction product of epichlorohy- drin and imidazole (IME) | (ml∙dm−3) | 0, 3, 5 | Anode | Pt (1 × 2 cm2) |
| Quiescent bath | |
To quantify the IME codeposited in the deposited films, the emission intensities of C, Cu, Zn, and Ni were measured by the high-frequency glow discharge optical emission spectrometry (rf-GDOES) with the following conditions: analysis diameter: φ2 mm, argon pressure: 600 Pa, power: 40 W, pulse frequency: 2000 Hz, duty cycle: 0.125. The surface morphology of the deposited films was observed by SEM, and the phase identification was performed via an X-ray diffractometer (Cu-Kα, tube voltage 40 kV, tube current 15 mA).
3. Results
3.1. Effect of IME and Solution Temperature on the Deposition Behavior of Zn–Ni Alloys
Figure 2 shows the total and the partial polarization curves of Zn, Ni deposition, and hydrogen evolution when Zn–Ni alloy deposition was performed at a solution temperature of 293 K. The equilibrium potential EZneq of Zn deposition (ZnO22−+2H2O+2e−→Zn+4OH−) assuming that pure Zn is deposited at a solution temperature of 298 K is −1.27 V.32) In addition, the equilibrium potential ENieq of the deposition (Ni(TEA)22++2e−→Ni+2TEA) was calculated −0.41 V based on the complex stabilization constant K = 104.74 of triethanolamine (TEA) coordinated to the Ni2+ ion assuming that pure Ni is deposited at a solution temperature of 298 K.33) In the total polarization curve (Fig. 2(a)), without IME, even though increased the current density from 10 to 50 A·m−2 in the potential region nobler than the equilibrium potential (−1.27 V) of Zn, the potential rarely changed, while on exceeding 50 A·m−2, it moved largely (approximately 0.4 V) in less noble potential direction, and on reaching the equilibrium potential of Zn, the shift of potential became small even on increasing the current density. During deposition from the solution containing 3 and 5 ml·dm−3 of IME, the total polarization curve shifted to a less noble potential range when the current density exceeded 10 A·m−2 and the current density at which the potential began to shift was smaller than that without IME. Even in the solution containing IME, at the equilibrium potential of Zn, the shift of the potential to the less noble side became small despite increasing the current density. The partial polarization curve (Fig. 2(b)) of Zn deposition from the solution without IME showed a rise in the potential region nobler than the equilibrium potential of Zn, as in the total polarization curve, followed by a shift toward the less noble potential region, and then a sharp rise at potential less noble than the equilibrium potential of Zn (−1.27 V). In contrast, the partial current density of Zn deposition from the solution containing 3 and 5 ml·dm−3 of IME was not detected in the potential region nobler than the equilibrium potential of Zn, and increased in the potential region less noble than the equilibrium Zn potential. Comparing the partial current density of Zn deposition from the solution containing 3 and 5 ml·dm−3 of IME with that from IME-free solution at same potential, it was lower with IME than that from IME-free solution. The partial polarization curve of Ni deposition (Fig. 2(c)) also showed a similar trend to that of Zn deposition (Fig. 2(b)) (suppression of Ni deposition by IME in the region E < EZneq). The hydrogen evolution (Fig. 2(d)) from the Zn–Ni alloy deposition solution was observed at potential nobler than the equilibrium potential of Zn in the presence and absence of IME, decreased once despite the shift to a less noble potential, and increased at potential less noble than the equilibrium potential of Zn. The partial current density of hydrogen evolution, which started decreasing despite the shift to the less noble potential, was smaller for the solution containing IME.
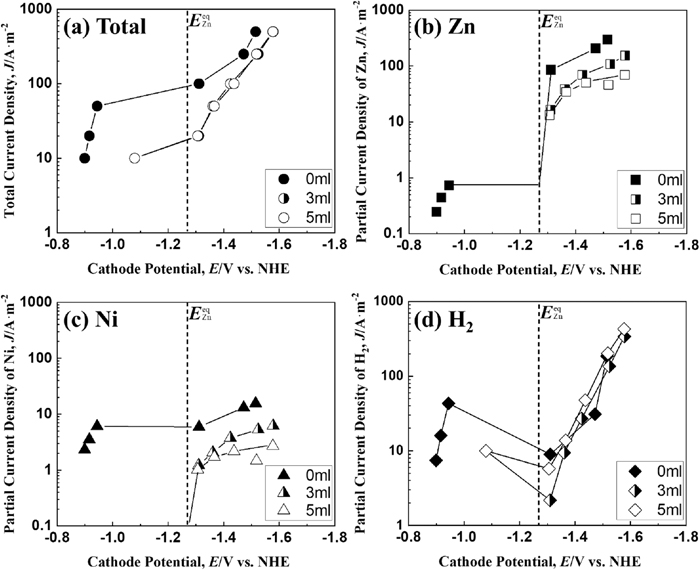
Figure 3 shows the total and partial polarization curves of Zn and Ni deposition and hydrogen evolution during the Zn–Ni alloy deposition at a solution temperature of 313 K. The total polarization curve (Fig. 3(a)) shows a large (approximately 0.4 V) shift to a less noble potential region when the current density exceeds 50 A·m−2 regardless of the presence or absence of IME, and the shift of potential to the less noble direction becomes smaller at the equilibrium Zn potential, despite increasing the current density. For the current density above 50 A·m−2, the effect of IME on the total polarization curve was not observed at 313 K, unlike at 293 K (Fig. 2(a)). Conversely, the partial current density of Zn deposition (Fig. 3(b)) was almost the same at potentials less noble than the equilibrium potential of Zn, regardless of the presence or absence of IME, and showed a different trend from that for 293 K (Fig. 2(b)). In contrast, the partial current density of Ni deposition (Fig. 3(c)) was lower in the solution containing 3 and 5 ml·dm−3 of IME than that in IME-free solution in the potential region less noble than the equilibrium potential of Zn, showing a similar trend to that of the solution at 293 K. Hydrogen evolution from the Zn–Ni alloy electrolytic solution (Fig. 3(d)) was observed at potentials nobler than the equilibrium potential of Zn with or without IME, and as at 293 K (Fig. 2(d)), decreased once despite the shift to a less noble potential, and increased at potential less noble than the equilibrium potential of Zn. However, unlike the solution temperature of 293 K, the partial current density of hydrogen evolution, which started to decrease at potentials nobler than the equilibrium potential of Zn, was about 50 A·m−2 with and without IME and almost the same for both cases.
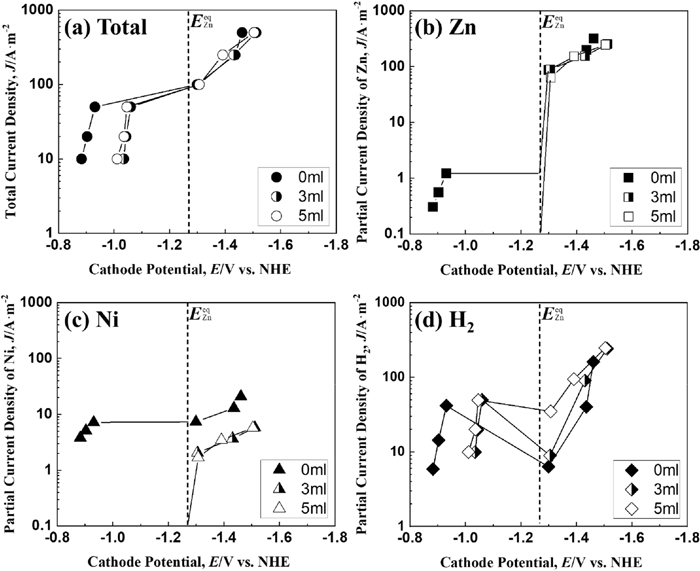
Figure 4 shows the total and the partial polarization curves of Zn and Ni deposition and hydrogen evolution during the Zn–Ni alloy deposition at a solution temperature of 333 K. The total polarization curve (Fig. 4(a)) shows a large (approximately 0.4 V) shift to a less noble potential region when the current density exceeds 100 A·m−2 with/without IME, and the shift to the less noble potential became smaller at the equilibrium potential of Zn, despite increasing the current density. For the current density above 100 A·m−2, the effect of IME on the total polarization curve was not observed at 333 K, as with 313 K (Fig. 3(a)). The partial current density of Zn deposition (Fig. 4(b)) was slightly smaller with 3 ml·dm−3 of IME at potentials less noble than the equilibrium potential of Zn, but the degree of decrease with 3 ml·dm−3 of IME was slight comparing with that at 293 K (Fig. 2(b)). In contrast, the partial current density of Ni deposition (Fig. 4(c)) was clearly lower in the solutions containing 3 and 5 ml·dm−3 of IME at the potential range less noble than the equilibrium potential of Zn, showing the same trend as the solution temperatures of 293 K and 313 K. Conversely, the partial polarization curve of hydrogen evolution (Fig. 4(d)) showed a large shift from the region of noble potential to that of less noble potential, regardless of the presence of IME. The partial current density at which the potential began to shift was almost same to be about 100 A·m−2 with/without IME, unlike at 293 K.
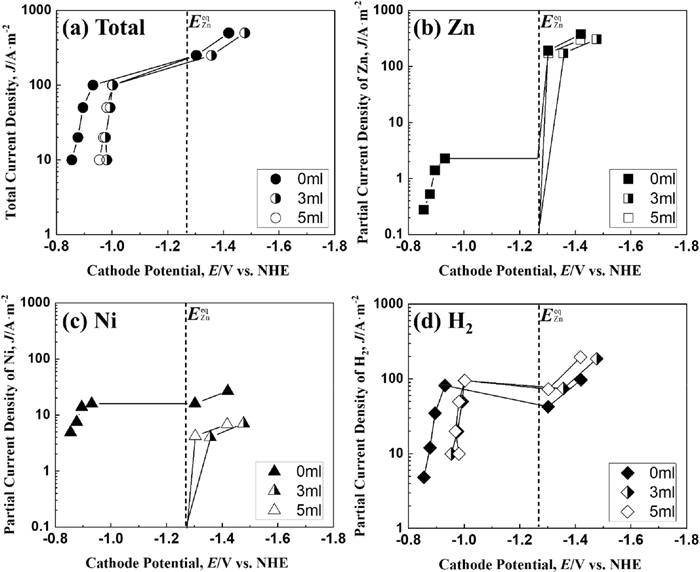
Figure 5 shows the correlation between the current density and current efficiency of Zn–Ni, Zn, and Ni depositions during Zn–Ni alloy deposition at a solution temperature of 293 K. The current efficiency of Zn–Ni alloy deposition shown below is the sum of the current efficiencies of Zn and Ni depositions. In IME-free solution, the current efficiency of Zn–Ni alloy deposition (Fig. 5(a)) was low (14%–26%) in the low current density range of 10–50 A·m−2, but rapidly increased above 50 A·m−2, became maximum at 100 A·m−2, and then, decreased as the current density increased. In the solution containing 3 or 5 ml·dm−3 IME, the current efficiency was almost zero at a current density of 10 A·m−2 but rapidly increased above 10 A·m−2 and reached its maximum from 20 to 50 A·m−2 and significantly decreased above 50 A·m−2. The current efficiency of Zn deposition during the alloy deposition (Fig. 5(b)) showed a similar behavior to that of alloy deposition (Fig. 5(a)), except for the low current density range of 10–50 A·m−2 from the solution without IME. The current efficiency of alloy deposition with and without IME increased rapidly at low to high current density region (Fig. 5(a)) because of the increase in the current efficiency of Zn deposition. The current density to start increasing the current efficiency of Zn deposition was lower in the solution containing 3 or 5 ml·dm−3 of IME. For high current densities above 100 A·m−2, the current efficiency of Zn deposition decreased significantly (approximately 40–60%) with IME addition. The degree of decrease became larger when IME was increased from 3 to 5 ml·dm−3. Conversely, the current efficiency of Ni deposition (Fig. 5(c)) was lower with IME than that without IME for the entire current density range. The current efficiency of Ni deposition decreased with the increasing current density in the solution without IME, whereas it in the solutions containing 3 and 5 ml·dm−3 of IME showed a similar current density dependence as that of Zn deposition.

Figure 6 shows the correlation between the current density and current efficiency of Zn–Ni, Zn, and Ni deposition during Zn–Ni alloy deposition at a solution temperature of 313 K. The current efficiency of Zn–Ni alloy deposition (Fig. 6(a)) increased rapidly at current density above 50 A·m−2, regardless of the presence of IME, reached its maximum at 100 A·m−2, and decreased with further increase in the current density. The current efficiency of Zn deposition during the alloy deposition (Fig. 6(b)) was similar to that of the alloy deposition (Fig. 6(a)), except for the low current density region of 10–50 A·m−2 from the solution without IME. In the high current density region above 100 A·m−2, the current efficiency of Zn deposition decreased with the addition of IME, but the degree of decrease was lower than that at 293 K (Fig. 5(b)). In the high current density region above 250 A·m−2, the current efficiency of Zn deposition did not decrease much despite increasing the IME from 3 to 5 ml·dm−3. The current efficiency of Ni deposition (Fig. 6(c)) was lower with the addition of IME in the total current density range.
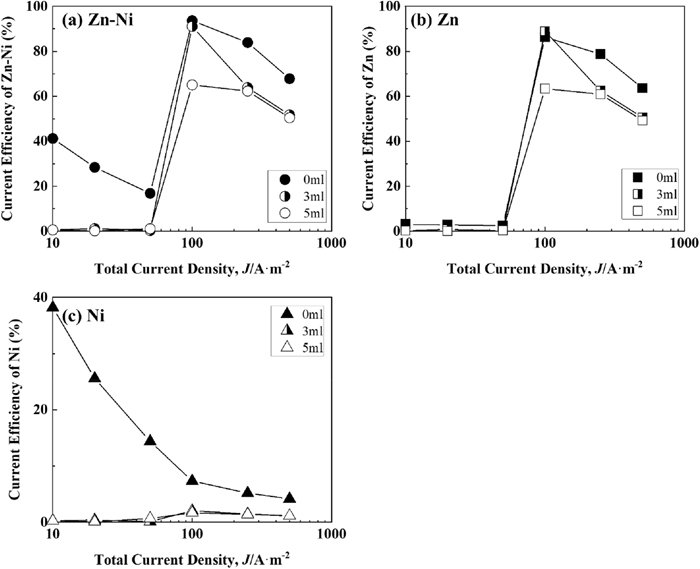
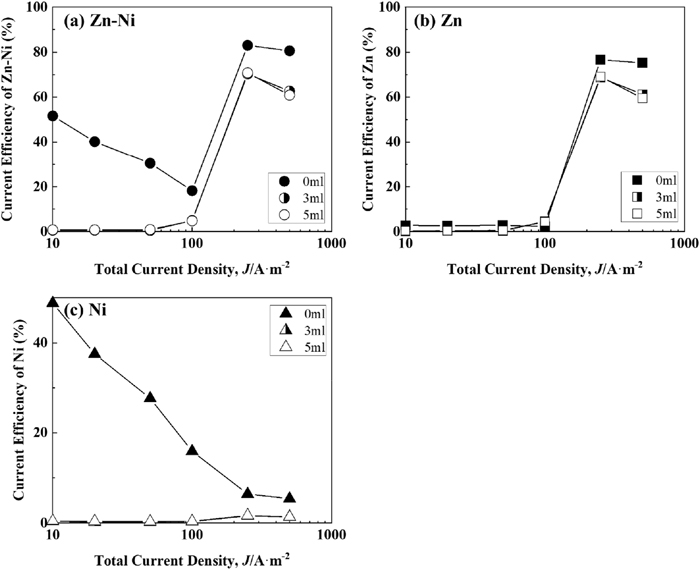
Figure 7 shows the correlation between the current density and current efficiency of Zn–Ni, Zn, and Ni deposition during Zn–Ni alloy deposition at a solution temperature of 333 K. The current efficiency of Zn–Ni alloy deposition (Fig. 7(a)) increased rapidly at the current density above 100 A·m−2, reaching its maximum at 250 A·m−2 with/without IME, and further decreased with the increase in the current density. The current efficiency of Zn deposition during alloy deposition (Fig. 7(b)) was similar to that of the alloy deposition (Fig. 7(a)), except in the low current density region of 10–100 A·m−2 from the solution without IME. In the high current density region above 250 A·m−2, the current efficiency of Zn deposition decreased with the addition of IME, but the degree of decrease was lower than that at 293 K (Fig. 5(b)). The current efficiency of Zn deposition rarely decreased despite increasing the IME from 3 to 5 ml·dm−3. The current efficiency of Ni deposition (Fig. 7(c)) was lower with the addition of IME for the entire current density range.
The current efficiency of Zn deposition (Figs. 5(b), 6(b), and 7(b)) was compared with the total polarization curves (Figs. 2(a), 3(a), and 4(a)). The current density to rapidly increase the current efficiency of Zn deposition was consistent with that at which the potential significantly shifted from nobler than the equilibrium potential of Zn to where it was less noble in the total polarization curve. The current density at which the potential significantly shifted from nobler than the equilibrium potential of Zn to less noble was lower with IME at a solution temperature of 293 K (Fig. 2(a)), while it almost remained unchanged by the addition of IME at the solution temperatures of 313 K and 333 K (Figs. 3(a) and 4(a)).
Figure 8 shows the correlation between the current density and Ni content of Zn–Ni alloy deposited films for each solution temperature. The broken line in the figure shows the composition reference line (CRL) of Ni, which means that the Ni content in the solution is identical to that in the deposited films. When the Ni content in the deposited films is greater than CRL, normal codeposition occurs, in which electrochemically nobler Ni deposited in preference to Zn. In contrast, when the Ni content in the deposited films is lesser than CRL, anomalous codeposition occurs, in which less noble Zn deposited in preference to Ni. As shown in Fig. 8(a), in IME-free solution at 293 K, the Ni content in deposited films significantly (approximately 80%) changed at current density region of 50–100 A·m−2. Below 50 A·m−2, the Ni content was above the CRL at around 90 mass%, indicating normal-type codeposition, whereas above 100 A·m−2, it was below the CRL, indicating anomalous codeposition. With the addition of 3 and 5 ml·dm−3 of IME, the Ni content in deposited films significantly changed at current density range of 10–20 A·m−2. Above 20 A·m−2, the content was below the CRL, showing anomalous codeposition. The deposition behavior shifted from normal to anomalous at a certain current density, and its current density is called the transition current density.34,35,36) This transition current density was consistent with the current density where the potential of the total polarization curve shown in Fig. 1(a) shifted abruptly from the nobler than the equilibrium potential of Zn to less noble region, and the current density where the current efficiency of Zn changed significantly (Fig. 5(b)). The transition current density evidently decreased with an addition of IME at 293 K. In contrast, at a solution temperature of 313 K (Fig. 8(b)), the transition current density ranged from 50 to 100 A·m−2 regardless IME, showing a different trend from that at 293 K. Figures 8(d), 8(e), and 8(f) show enlarged images of the Ni content in the high current density region where anomalous codeposition occurred. The Ni content in the region of anomalous codeposition decreased with the IME addition at all solution temperatures; the decrease in Ni content was small at 293 K (Fig. 8(d)) but became more pronounced as the solution temperature increased to 313 K (Fig. 8(e)) and 333 K (Fig. 8(f)). At 293 K, the Ni content was lower for 5 ml·dm−3 IME than for 3 ml·dm−3 IME (Fig. 8(d)), whereas the effect of amount of IME on the Ni content was not observed at 313 K and 333 K.
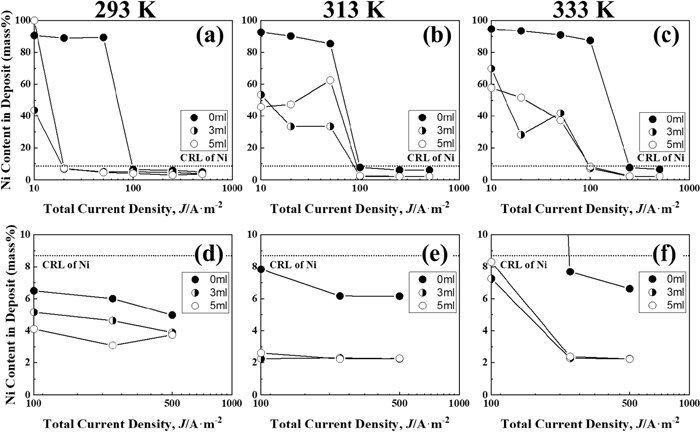
Figure 9 shows the appearance of the Zn–Ni alloy deposition films obtained at 500 A·m−2 from a solution of 293 K, 313 K, and 333 K containing various concentrations of IME. When IME was not included (Figs. 9(a), 9(d), and 9(g)), the deposited films were gray and matte at any solution temperature, with several bubble traces at 313 K and 333 K. With the addition of 3 and 5 ml·dm−3 of IME, it became silvery and glossy in a solution of 293 K (Figs. 9(b), 9(c)). However, as the solution temperature increased to 313 K and 333 K, the gloss decreased (Figs. 9(e), 9(f), 9(h), and 9(i)).

Figure 10 shows the correlation between the concentration of IME and the glossiness of Zn–Ni alloy films obtained at 250 and 500 A·m−2 for each solution temperature. The glossiness of films deposited at 250 A·m−2 from IME-free solution was low at all the solution temperatures (Fig. 10(a)), however, the addition of 3 ml·dm−3 of IME greatly increased the glossiness at solution temperatures of 293 K and 313 K, which was especially pronounced at 293 K. However, when the solution temperature was increased to 333 K, the addition of IME did not increase the glossiness. At solution temperatures of 293 K and 313 K, the increase in IME addition from 3 to 5 ml·dm−3 decreased the gloss. Conversely, the gloss of the deposited films obtained at 500 A·m−2 (Fig. 10(b)) also increased significantly with the IME addition, and the degree of increase in gloss was greater for the deposited films obtained at 500 A·m−2 than for that at 250 A·m−2. As described above, the glossiness of the deposited films obtained from the solution containing IME was highest at a solution temperature of 293 K and decreased on increasing it to 313 K and 333 K.
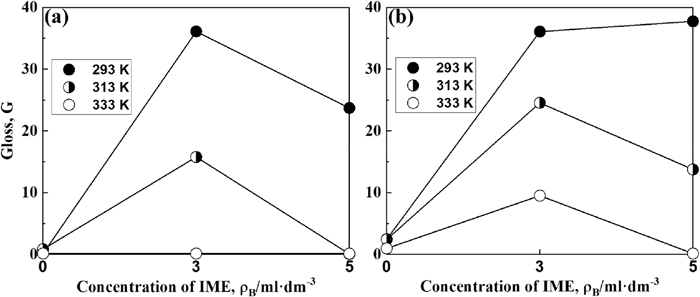
Figure 11 shows the X-ray diffraction patterns of the deposited films obtained in the solution containing 3 ml·dm−3 of IME at different solution temperatures and current densities. At 293 K (Fig. 11(a)), the peaks related to the Fe of the substrate and η-Zn phases were detected in the deposited films obtained at 250 A·m−2, whereas at 313 K (Fig. 11(b)) and 333 K (Fig. 11(c)), the peaks related to the γ-phase (intermetallic compound of Ni2Zn11) were detected besides the Fe and η-phase. The Ni content of the deposited films was 4.6, 2.2, and 2.3 mass% at 293 K, 313 K, and 333 K, respectively, indicating that the γ phase was formed even though the Ni content of the deposited films decreased with the increasing solution temperature. In contrast, in the deposited films obtained at 500 A·m−2, only the peaks related to Fe and η phases were detected regardless of the solution temperature. At 313 K and 333 K, the Ni contents of the films obtained at the current densities of 250 and 500 A·m−2 were almost the same (2.3 mass%). These results indicate that the γ-phase was more easily formed in the deposited films obtained from the solution containing 3 ml·dm−3 IME at higher a solution temperature and a lower current density, i.e., lower overpotential for deposition.

Figure 12 shows the SEM images of the deposited films obtained in the solution containing 3 ml·dm−3 IME at different solution temperatures and current densities. The films deposited at 250 A·m−2 were smooth, consisting of fine plate-like crystals at 293 K (Fig. 12(a)). However, when the solution temperature increased to 313 K (Fig. 12(b)) and 333 K (Fig. 12(c)), the crystals became more rounded and lumpier. As mentioned earlier, for the deposition at 250 A·m−2 at 293 K, the deposited film (Ni content, 4.6 mass%) consisted of a single phase of η, whereas at 313 K and 333 K, the deposited films (Ni content, 2.2–2.3 mass%) consisted of η and γ phases. The γ phase of deposited Zn–Ni alloys is reported to consists of rounded granular crystals.37,38) The surface morphology of the deposited films obtained at 250 A·m−2 differed greatly depending on the solution temperature, possibly attributed to the difference in the phase structures. Conversely, the films obtained at 500 A·m−2 showed fine plate-like crystals and smooth surface at solution temperatures of 293 K (Fig. 12(d)) and 313 K (Fig. 12(e)), while the surface became slightly rough at a higher solution temperature of 333 K (Fig. 12(f)). The films obtained at 500 A·m−2 consisted of η phase with Zn content in films higher than 90 mass% at all the solution temperatures, and the grain size became larger at a higher solution temperature of 333 K because the overpotential for deposition became smaller. By comparing the SEM images of the Zn–Ni alloy deposited films shown in Fig. 12 with the gloss levels shown in Fig. 10, since the deposited films (Figs. 12(a), 12(d)) obtained in a solution containing 3 ml·dm−3 IME at a solution temperature of 293 K had fine crystals and a smooth surface, the glossiness of the films was higher. The glossiness of the films obtained from the solution containing IME was larger for those obtained at 500 A·m−2 than for those at 250 A·m−2 (Fig. 10), probably because the former films consisted of finer crystals (Fig. 12).

4. Discussion
Table 2 summarizes the results of the effect of IME on the deposition behavior of Zn–Ni alloys at 293 K and 333 K from alkaline zincate baths. The effects of IME on the transition current density at which the deposition behavior shifted from normal to anomalous, the current efficiency of alloy deposition, and the composition of the deposited films, varied with the solution temperature. Next, the factors are discussed for each potential range nobler than the equilibrium potential of Zn (normal type codeposition region) and less noble than the equilibrium potential of Zn (anomalous type codepositgion region).
Table 2. Effect of IME on the deposition behavior of Zn–Ni alloy at 293 and 333 K.
| Potential | E > EZneq | E < EZneq |
|---|
| Deposition type | Normal codeposition | Anomalous codeposition |
| 293 K | Zn deposition | – | Suppressed |
| Ni deposition | Suppressed | Suppressed |
| H2 evolution | Suppressed | Not affected |
| Transition C.D. | Decrease | – |
| Current efficiency | Decrease | Significantly decrease |
| Ni% in deposit | – | Slightly decrease |
| 333 K | Zn deposition | – | Not affected |
| Ni deposition | Suppressed | Suppressed |
| H2 evolution | Not affected | Not affected |
| Transition C.D. | Not affected | – |
| Current efficiency | Significantly decrease | Slightly decrease |
| Ni% in deposit | – | Decrease |
Figure 13 shows the relationship between the transition current density and IME concentration in the Zn–Ni alloy deposition for each solution temperature. The transition current density at which the deposition behavior shifted from normal to anomalous corresponded to the current density at which the potential shifted abruptly from a potential range nobler to less noble than the equilibrium potential of Zn in the total polarization curve. The transition current density shown in Fig. 13 was evaluated by the current density at which the potential began to shift from nobler to less noble in total polarization curve. As shown in Figs. 2, 3, and 4, hydrogen evolution was dominant in the region nobler than the equilibrium potential of Zn, therefore, the transition current density could be approximated by the current density of hydrogen evolution when the potential shifts from nobler to less noble. As shown in Fig. 13, the transition current density increased with the increasing solution temperature regardless of the presence of IME because the higher the solution temperature, the more hydrogen evolution was promoted. Regarding the effect of IME on the transition current density, at a solution temperature of 293 K, the transition current density decreased significantly with the addition of 3 ml·dm−3 of IME, suggesting that IME suppressed the hydrogen evolution in the Zn–Ni alloy deposition in the potential region nobler than the equilibrium potential of Zn at solution temperature 293 K. However, at 313 K and 333 K, the transition current density did not change with the addition of IME, indicating that the suppression effect of IME on hydrogen evolution decreased with increasing the solution temperature.

As shown in Figs. 2(b), 3(b), and 4(b), slight partial current density of Zn deposition from the solution without IME was detected at around −0.9 V, nobler than its equilibrium potential, regardless of the solution temperature possibly due to the underpotential codeposition of Zn. However, no underpotential codeposition of Zn occurred from the solutions containing 3 and 5 ml·dm−3 of IME at all the solution temperatures. The underpotential codeposition of Zn in Zn–Ni alloy deposition reportedly occurs due to the formation of a stable intermetallic compound Ni5Zn21 by deposition, considerably reducing the activity coefficient of Zn in the deposited films.39,40,41,42) In other words, Ni codeposition is essential for the occurrence of Zn underpotential codeposition; however, in the current study, Ni deposition was greatly suppressed at all solution temperatures in the solution containing IME, suggesting that Zn underpotential codeposition did not occur because Ni did not deposit in the potential region nobler than the equilibrium potential of Zn.
4.2. Electrodeposition Behavior in the Potential Region Less Noble than the Equilibrium Potential of Zn (Region of Anomalous Codeposition)
The inhibitory effect of IME on the Zn and Ni deposition during the alloy deposition was compared for each solution temperature. At a temperature of 293 K, the partial current density of Zn was significantly reduced by the IME addition when the partial current density of Zn was compared at the same potential in the potential range less noble than the equilibrium potential of Zn (Fig. 2(b)). Similarly, the partial current density of Ni was clearly decreased by the addition of IME (Fig. 2(c)). Conversely, at 313 K and 333 K, the partial current density of Zn did not decrease with IME addition in the potential range less noble than the equilibrium potential of Zn (Figs. 3(b) and 4(b)), while that of Ni clearly decreased with the IME addition (Figs. 3(c), 4(c)). The inhibitory effect of IME on Zn and Ni deposition in the potential range less noble than the equilibrium potential of Zn varied with the solution temperature, and the inhibitory effect of IME on Zn deposition decreased with the increasing solution temperature, while maintaining the inhibitory effect on Ni deposition. The current efficiency in the anomalous region of 250–500 A·m−2 showed that the current efficiency of Zn deposition decreased significantly (approximately 40–60%) with the addition of IME at a solution temperature of 293 K (Fig. 5(b)), while the decrease is smaller at solution temperatures of 313 K and 333 K (Figs. 6(b), 7(b)). In contrast, the current efficiency of Ni deposition in the anomalous region of 250–500 A·m−2 decreased with the addition of IME to the same extent regardless of the solution temperature (Figs. 5(c), 6(c), 7(c)). The Ni content in the deposited films in the anomalous range of 250–500 A·m−2 decreased significantly (approximately 4–6 mass%) with the addition of IME at high solution temperature (Figs. 8(d), 8(e), 8(f)). These results for the current efficiency of Zn and Ni deposition and the Ni content of the deposited films reflect that the inhibitory effect of IME on Zn deposition decreased with increasing the solution temperature, while maintaining the inhibitory effect on Ni deposition.
To clarify the effect of solution temperature on the Ni content of the deposited films, the results of Fig. 8 were summarized for each IME concentration. The Ni content of the deposited films in the anomalous region of 250–500 A·m−2 increased with increasing the solution temperature without IME (Fig. 14(d)), while it decreased with increasing the solution temperature with 3 or 5 ml·dm−3 of IME (Figs. 14(e), 14(f)). The effect of solution temperature on the Ni content of the deposited films showed an opposite trend depending on the presence or absence of IME. Since Ni deposition was more accelerated than Zn deposition at higher solution temperatures for all current densities in the Zn–Ni alloy deposition from solutions without IME, Ni content was reported to increase with the increasing solution temperature,2,7,27,28) and the same result was obtained in this study. Conversely, in the case of IME, the Ni content of the deposited films decreased with the increasing solution temperature, possibly because the inhibitory effect of IME on Zn deposition decreased with increasing the solution temperature, while the inhibitory effect on Ni deposition was maintained.

Since the inhibitory effect of IME on Zn deposition decreased with increasing the solution temperature, the adsorption ability of IME on the cathode surface was expected to vary with the solution temperature. In general, in the electrodeposition of metals, the amounts of additive components incorporated into the deposited films is reported to increase as the adsorption ability of the additive to the cathode increases.43,44) Therefore, to evaluate the adsorption ability of IME on the cathode, the amount of C, which is a component of IME incorporated into the deposited films, was measured by GDOES, whose results are shown in Fig. 15. For the deposition from the solution without IME (Figs. 15(a), 15(b), 15(c)), C was codeposited in the deposited films, possibly due to triethanolamine added as a complexing agent for Ni2+. In the films obtained from the solution containing IME (Figs. 15(d), 15(e), and 15(f)), the amount of C codeposited clearly increased, suggesting that the components of IME were codeposited. The amount of C codeposited in the deposited films was the highest at a solution temperature of 293 K (Fig. 15(d)) and decreased as the temperature increased. Based on this result, it is expected that the adsorption ability of IME on the cathode surface decreases with the increasing solution temperature. Therefore, the inhibitory effect of IME on Zn deposition decreased with increasing the solution temperature.

In contrast, the inhibitory effect of IME on Ni deposition was maintained even when the solution temperature was increased, indicating that IME inhibited the Ni deposition despite the decreasing adsorption ability. Focussing on the difference in inhibitory effect of IME on the Ni and Zn deposition, the Ni content in the films deposited in the anomalous codeposition region decreased with the addition of IME, regardless of the solution temperature, indicating that Ni deposition was more strongly inhibited by IME (Figs. 8(d), 8(e), 8(f)). Reportedly, the Ni deposition from hydrated ions proceeds with a multistep reduction mechanism via a hydroxyl-containing adsorption intermediate, NiOHad, and the overpotential for deposition was large due to the limited sites at which NiOHad could be adsorbed.45,46,47,48) In the Zn–Ni alloy deposition, the added IME blocks the adsorption sites of NiOHad which are restricted inherently, more strongly suppressing the Ni deposition. Even though the adsorption ability of IME decreases with the increasing solution temperature, the inhibitory effect of IME on the Ni deposition seems to be larger than that on Zn deposition. The highest gloss of the Zn–Ni alloy deposited films was observed at 293 K due to the large adsorption ability of IME and fine and smooth grains of the deposited films.
5. Conclusion
The synergistic effect of IEM and solution temperature on the deposition behavior of Zn–Ni alloy from alkaline zincate solutions was investigated. The transition current density, at which the deposition behavior shifted from the normal to anomalous type decreased with the addition of IME at 293 K but did not change regardless of IME addition at 313 K and 333 K. This indicates that the inhibitory effect of IME on the hydrogen evolution decreases with increasing the solution temperature. The suppression effect of IME on the Zn and Ni depositions during the alloy deposition was observed at 293 K, while at 313 K and 333 K, the suppression effect was decreased on the Zn deposition, though maintained on the Ni deposition. Therefore, Ni content in the deposits significantly decreased with IME as the temperature increased. The current efficiency for Zn deposition significantly decreased with IME at 293 K, while decreasing insignificantly at 313 K and 333 K. The C content in the deposits was the highest at 293 K, and decreased with the increasing solution temperature, indicating that the adsorption ability of IME on the cathode decreases with the increasing temperature. As a result, the suppression effect of IME on the Zn deposition seems to decrease with increasing the temperature. The gloss of the deposited films was the highest at 293 K, attributed to the adsorption ability of IME being large at 293 K and deposited films with fine crystals becoming smooth.
Acknowledgement
This work was supported by JST SPRING, Grant Number JPMJSP2136.
References
- 1) R. Ramanauskas: Appl. Surf. Sci., 153 (1999), 53. https://doi.org/10.1016/S0169-4332(99)00334-7
- 2) Z. Feng, Q. Li, J. Zhang, P. Yang, H. Song and M. An: Surf. Coat. Technol., 270 (2015), 47. https://doi.org/10.1016/j.surfcoat.2015.03.020
- 3) S. H. Mosavat, M. H. Shariat and M. E. Bahrololoom: Corros. Sci., 59 (2012), 81. https://doi.org/10.1016/j.corsci.2012.02.012
- 4) O. Girčienė, L. Gudavičiūtė, R. Juškėnas and R. Ramanauskas: Surf. Coat. Technol., 203 (2009), 3072. https://doi.org/10.1016/j.surfcoat.2009.03.030
- 5) M. Yano, H. Fukushima, H. Nakano and T. Akiyama: Tetsu-to-Hagané, 86 (2000), 176 (in Japanese). https://doi.org/10.2355/tetsutohagane1955.86.3_176
- 6) A. El Hajjami, M. P. Gigandet, M. De Petris-Wery, J. C. Catonne, J. J. Duprat, L. Thiery, F. Raulin, N. Pommier, B. Starck and P. Remy: Appl. Surf. Sci., 254 (2007), 480. https://doi.org/10.1016/j.apsusc.2007.06.016
- 7) V. Narasimhamurthy and L. H. Shivashankarappa: J. Adv. Electrochem., 6 (2020), 188. https://doi.org/10.30799/jaec.061.20060103
- 8) S. Anwar, Y. Zhang and F. Khan: RSC Adv., 8 (2018), 28861. https://doi.org/10.1039/c8ra04650f
- 9) C. Cachet, B. Saidani and R. Wiart: J. Electrochem. Soc., 138 (1991), 678. https://doi.org/10.1149/1.2085657
- 10) A. Abibsi, J. K. Dennis and N. R. Short: Trans. Inst. Met. Finish., 69 (1991), 145. https://doi.org/10.1080/00202967.1991.11870911
- 11) M. G. Hosseini, H. Ashassi-Sorkhabi and H. A. Y. Ghiasvand: Surf. Coat. Technol., 202 (2008), 2897. https://doi.org/10.1016/j.surfcoat.2007.10.022
- 12) A. Brenner: Electrodeposition of Alloys, Vol. 2, Academic Press, New York, (1963), 194.
- 13) H. Fukushima, T. Akiyama, J.-h. Lee, M. Yamaguchi and K. Higashi: J. Met. Finish. Soc. Jpn., 33 (1982), 574 (in Japanese). https://doi.org/10.4139/sfj1950.33.574
- 14) H. Fukushima, T. Akiyama, M. Yano, T. Ishikawa and R. Kammel: ISIJ Int., 33 (1993), 1009. https://doi.org/10.2355/isijinternational.33.1009
- 15) H. Nakano, S. Kobayashi, T. Akiyama, T. Tsuru and H. Fukushima: Tetsu-to-Hagané, 89 (2003), 64 (in Japanese). https://doi.org/10.2355/tetsutohagane1955.89.1_64
- 16) H. Nakano, M. Matsuno, S. Oue, M. Yano, S. Kobayashi and H. Fukushima: J. Jpn. Inst. Met., 69 (2005), 548 (in Japanese). https://doi.org/10.2320/jinstmet.69.548
- 17) Z. Feng, Q. Li, J. Zhang, P. Yang and M. An: RSC Adv., 5 (2015), 58199. https://doi.org/10.1039/C5RA09582D
- 18) L. M. Muresan, J. Eymard, D. Blejan and E. Indrea: Stud. Univ. Babes-Bolyai Chem., (2010), LV, 1, 37. https://www.researchgate.net/publication/235654567, (accessed 2010-01-01).
- 19) G. Y. Li, J. S. Lian, L. Y. Niu and Z. H. Jiang: Surf. Coat. Technol., 191 (2005), 59. https://doi.org/10.1016/j.surfcoat.2004.04.062
- 20) S. H. Mosavat, M. E. Bahrololoom and M. H. Shariat: Appl. Surf. Sci., 257 (2011), 8311. https://doi.org/10.1016/j.apsusc.2011.03.017
- 21) Z. Feng, L. Ren, J. Zhang, P. Yang and M. An: RSC Adv., 6 (2016), 88469. https://doi.org/10.1039/C6RA18476F
- 22) Z. Feng, D. Li, Q. Sun, L. Wang, P. Xing and M. An: J. Alloys Compd., 765 (2018), 1026. https://doi.org/10.1016/j.jallcom.2018.06.300
- 23) Z. Feng, D. Li, L. Wang, Q. Sun, P. Lu, P. Xing and M. An: Ionics, 25 (2019), 1857. https://doi.org/10.1007/s11581-018-2786-x
- 24) S. Bae, S. Oue, I. Son and H. Nakano: Tetsu-to-Hagané, 107 (2021), 229 (in Japanese). https://doi.org/10.2355/tetsutohagane.TETSU-2020-108
- 25) S. Bae, S. Oue, I. Son and H. Nakano: ISIJ Int., 61 (2021), 2256. https://doi.org/10.2355/isijinternational.ISIJINT-2021-080
- 26) S. Haruyama: Hyomen Gizyutsusya no tameno Denkikagaku (Electrochemistry for Surface Engineer), Maruzen, Tokyo, (2005), 173 (in Japanese).
- 27) S. Bae, S. Oue, Y.-k. Taninouchi, I. Son and H. Nakano: Tetsu-to-Hagané, 108 (2022), 120 (in Japanese). https://doi.org/10.2355/tetsutohagane.TETSU-2021-092
- 28) H. Y. Lee and S. G. Kim: Surf. Coat. Technol., 135 (2000), 69. https://doi.org/10.1016/s0257-8972(00)00731-3
- 29) H. Nezu, S. Fujii, N. Kaneko and N. Ofuchi: J. Met. Finish. Soc. Jpn., 32 (1981), 17 (in Japanese). https://doi.org/10.4139/sfj1950.32.17
- 30) S. Konishi, S. Eguchi, N. Ozeki and M. Uesugi: J. Met. Finish. Soc. Jpn., 20 (1969), 263 (in Japanese). https://doi.org/10.4139/sfj1950.20.263
- 31) M. Vidal, M. Ostra, N. Imaz, E. Garcia-Lecina and C. Ubide: Chemom. Intell. Lab. Syst., 149 (2015), Part A, 90. https://doi.org/10.1016/j.chemolab.2015.10.004
- 32) M. Pourbaix: Atlas of Electrochemical Equilibria in Aqueous Solutions, Pergamon Press, New York, (1966), 406.
- 33) D. D. Perrin: Stability Constants of Metal-ion Complexes, Part B: Organic Ligands, Pergamon Press, Oxford, (1979), 466.
- 34) T. Akiyama, H. Fukushima and K. Higashi: Tetsu-to-Hagané, 72 (1986), 918 (in Japanese). https://doi.org/10.2355/tetsutohagane1955.72.8_918
- 35) H. Nakano, S. Shibata, S. Arakawa, S. Oue and S. Kobayashi: ISIJ Int., 53 (2013), 1858. https://doi.org/10.2355/isijinternational.53.1858
- 36) H. Nakano, S. Shibata, S. Arakawa, S. Oue and S. Kobayashi: Tetsu-to-Hagané, 99 (2013), 346 (in Japanese). https://doi.org/10.2355/tetsutohagane.99.346
- 37) N. Lotfi, M. Aliofkhazraei, H. Rahmani and G. B. Darband: Prot. Met. Phys. Chem. Surf., 54 (2018), 1102. https://doi.org/10.1134/S2070205118060187
- 38) S. Fashu and R. Khan: Anti-Corros. Methods Mater., 66 (2019), 45. https://doi.org/10.1108/ACMM-06-2018-1957
- 39) H. Nakano, S. Arakawa, Y. Takada, S. Oue and S. Kobayashi: Mater. Trans., 53 (2012), 1946. https://doi.org/10.2320/matertrans.M2012241
- 40) H. Nakano, S. Arakawa, Y. Takada, S. Oue and S. Kobayashi: J. Jpn. Inst. Met., 76 (2012), 443 (in Japanese). https://doi.org/10.2320/jinstmet.76.443
- 41) H. Nakano, S. Arakawa, S. Oue and S. Kobayashi: Tetsu-to-Hagané, 99 (2013), 425 (in Japanese). https://doi.org/10.2355/tetsutohagane.99.425
- 42) H. Nakano, S. Arakawa, S. Oue and S. Kobayashi: ISIJ Int., 53 (2013), 1864. https://doi.org/10.2355/isijinternational.53.1864
- 43) K. Fuchi, S. Oue, Y. Kikuchi, S. Akamatsu, Y. Kashiwa and H. Nakano: Mater. Trans., 59 (2018), 1767. https://doi.org/10.2320/matertrans.M2018243
- 44) K. Fuchi, S. Oue, Y. Kikuchi, S. Akamatsu, Y. Kashiwa and H. Nakano: J. Jpn. Inst. Met. Mater., 82 (2018), 281 (in Japanese). https://doi.org/10.2320/jinstmet.J2018020
- 45) K. Fukuda, Y. Kashiwa, S. Oue, T. Takasu and H. Nakano: ISIJ Int., 61 (2021), 919. https://doi.org/10.2355/isijinternational.ISIJINT-2020-105
- 46) K. Fukuda, Y. Kashiwa, S. Oue, T. Takasu and H. Nakano: Tetsu-to-Hagané, 105 (2019), 988 (in Japanese). https://doi.org/10.2355/tetsutohagane.TETSU-2019-045
- 47) K. Fukuda, Y. Kashiwa, S. Oue, T. Takasu and H. Nakano: ISIJ Int., 59 (2019), 1632. https://doi.org/10.2355/isijinternational.ISIJINT-2019-023
- 48) Y. Kashiwa, N. Nagano, T. Takasu, S. Kobayashi, K. Fukuda and H. Nakano: ISIJ Int., 59 (2019), 514. https://doi.org/10.2355/isijinternational.ISIJINT-2018-676