1. Introduction
Sintering is the process to agglomerate iron ore fines into large size particles to make them suitable for feeding into the blast furnace. The blast furnace feed typically consists of around 70% or more of sinter with the balance made up of lump ore and pellets.1) Hence it is important to produce sinter to meet the feed requirement and maintain the quality which in turn helps in effective and fast reduction of iron oxide to metallic iron and maintains the basicity.
The iron ores from Australia and Brazil are the main component of the blend mix in the China and Asia-Pacific region to produce sinter. Due to the high demand for iron ore, many new iron ore mines are coming into operation to maintain the demand and supply balance in the iron ore market. With ever-changing ore types coming from different mines around the world, it is important to optimise the sintering conditions to maximise the sinter productivity and quality. The quality parameters of the sinter product such as strength and reducibility are very much dependent on the raw material composition, and sintering parameters such as temperature, residence time, and flame front speed. Previous work has established that the post-ignition flow rate is critical to control these parameters and that this is dependent on the pre-ignition flow rate and resistance of the flame front.2)
Flame front speed denotes the movement of the high temperature zone from the start to the end of the sintering process and is one of the most crucial parameters to control the sinter quality.2,3,4,5,6) The flame front speed is driven by the suction pressure applied at the bottom of the bed and the permeability of the bed during sintering. Several zones can be classified based on temperature alone which contributes to the total pressure-drop during sintering, i.e., humidified bed (HB) zone (< ~60°C), de-humidification and goethite dehydroxylation zone (~100°C to ~620°C), calcination zone (> ~700°C), combustion zone (> ~727°C), melting zone (> ~1200°C) and sintered bed (SB) zone (< ~1200°C on the cooling side).7,8,9,10,11,12,13)
Some studies have specifically focused on resistance to air flow in the flame front zone,5,10,14,15,16,17,18,19) however, the characteristics of this zone including the bed structure that contributes to flow resistance are complex and still not well understood. Loo7) defined the flame front as a zone with a leading-edge where the coke particles start to combust and a trailing edge where the coke particles are fully combusted and reported that the flame front is responsible for maximum pressure drop in the bed during sintering.5,7) In a previous work of the authors,14) it was shown that the maximum pressure-drop occurs in a zone called as “region of maximum resistance” (RMR), which starts from 100°C in the leading-edge and includes Loo’s flame front (coke combustion) along with other physico-chemical processes such as de-humidification, goethite dehydroxylation, flux calcination and granulate melting.
In the current study, a typical Chinese ore blend (comprising 60% Australian Brockman - Marra Mamba fines, 10% Channel Iron Deposit fines, 20% Brazilian fines, 10% Magnetite concentrate) is studied using a milli-pot to obtain a detailed understanding of the resistance of the flame front. Previous work has established that a milli-pot is a useful tool for fundamental sintering studies and can produce realistic sinter product.14,20) In the experimental work, the region of maximum resistance was investigated at a greater spatial resolution, with varied suction pressure. The resistance of different zones was quantified by examining the dependency of bed pressured drops during sintering with the specific energy. Also, the yield of the sinter product with bed temperature was investigated.
2. Methods and Materials
2.1. Raw Material
In this work, the sintering experiments were conducted in a lab scale milli-pot. An iron ore blend composed of 60% Australian Brockman - Marra Mamba fines, 10% Channel Iron Deposit fines, 20% Brazilian fines and 10% Magnetite concentrate was used and mixed with 7% coke breeze, limestone and dolomite to achieve 1.9 basicity, and a fixed level of 20% return fines. The proportions were in total dry mass basis. The sinter chemistry was: TFe = 56.7%, Basicity = 1.9, SiO2 = 5.0%, MgO = 2.0% and Al2O3 = 1.9%. The aim moisture for the feed was set at 6.5% on a total wet mass basis.
2.2. Experimental Apparatus and Procedure
A typical sintering procedure was followed for conducting the sintering experiments in a milli-pot (diameter 53 mm, height 500 mm) apparatus.5,14,16,21,22) The milli-pot was fitted with six taps to record temperature and pressure at the same location. The taps in the milli-pot were distributed along the height to obtain a better spatial resolution in the lower part of the milli-pot. Two taps, 100 mm apart, were located in the upper half and four taps, 50 mm apart, were located in the bottom half of the pot.
To measure the temperature during sintering experiments, R type thermocouples were fabricated by welding the tip of a 0.35 mm Platinum and Platinum/13% Rhodium wire by using a hydrogen flame torch. The thermocouples were insulated by a 3 mm, 2-bore ALSINT sheath while keeping a bare tip at the end to increase the sensitivity of the thermocouples. The insulted thermocouples were inserted to the centre of the bed at each tap location. For measuring pressure a differential pressure transmitter (Dwyer) was used with one end connected to the tap and another to the atmosphere. The taps were in T-piece shape to enable measurement of pressure and temperature at the same location, as shown in Fig. 1(a). The taps were labelled T1 to T6 (for temperature) and P1 to P6 (for pressure) from top to bottom.

The sinter pot was fitted to a wind box which was connected to a water ring vacuum pump to create negative pressure in the system (Fig. 1(b)). A hot wire anemometer was fitted at the top of the bed to measure the air flow rate. All instruments were connected to an in-house built data logging system to record the measured data. The detailed experimental set up is shown in Fig. 1(b).
For granulation purpose, the raw mixture was first dry mixed for two minutes in a granulation drum (diameter 500 mm, length 310 mm) and then was wet mixed for 3 minutes after adding water to attain aim moisture. A portion of granules was separated for measuring moisture content, apparent density and particle size distribution.21) The wet granules were poured into the sinter milli-pot and the filled pot was placed on the wind box set at a suction pressure of 5 kPa. The granule packed bed in milli-pot was ignited from the top using an LPG gas burner at a temperature of ~1200°C for 90 seconds. After ignition, suction pressure was applied, and the ignition hood was replaced with a flow measuring tube fitted with a hot wire anemometer for air flow rate measurement. The suction pressure was varied from 8 to 14 kPa in a series of experiments. The maximum temperature in the wind box indicated the completion of the sintering process. The air flow was continued through the bed in the post sintering stage to cool the bed down to 40°C. Sintered product was removed afterwards from the milli-pot for further quality measurements. Further details of the sintering equipment are given elsewhere.14)
To analyse the structural transformation of a green bed to sintered bed, quenching was conducted with the same procedure as adopted in Hara et al.23) To quench the sintering process, it was necessary to extinguish the flame front and prevent any further coke combustion in the system. In the present study, the flame front was quenched in the bottom half of the bed by flooding the bed with nitrogen gas. The quenched sintered part was mounted on molten resin to prepare CT samples. Samples were scanned at the ‘National Laboratory for X-ray Micro Computed Tomography Laboratory (CT Lab)’ based at the Australian National University (ANU) using a HeliScan MicroCT system with an optimized space-filling trajectory to yield sharp images at a resolution of 41 μm/voxel.24,25,26)
2.3. Sinter Yield
A repeated drop test procedure was adopted on the sintered plug material from the milli-pot followed by screening at 5 mm to produce sinter product and return-fines fractions. The sintered material was divided into three parts: top product (upper bed ~200 mm), middle product (middle bed ~150 mm) and bottom product (lower bed ~150 mm). Due to relatively low product mass, the drop tests were conducted at a height of 1.5 m and repeated four times.14) The product yield of the sinter product (remaining +5 mm particle size) was quantified as follows:
|
Yield=
Mass of+5 mm sinter product after drop, Kg
Mass of total sinter product before drop, Kg
|
3. Results and Discussion
3.1. Zone Identification and Pressure Profile
In our previous work,14,27) the region of maximum resistance (RMR) was defined with the help of simultaneous measurement of temperature and pressure in the bed. The flame front zone contributing to the RMR was defined as a temperature range from ~100°C at the leading edge of the flame front to ~1200°C at the trailing edge of the flame front. This is plotted in Fig. 2 for present experimental results at 10 kPa total suction pressure across the bed. Figure 2 shows three slopes in the pressure profile obtained during sintering, with the steepest slope occurring in the RMR.14)

In the present work, the definition of RMR is examined in more detail through the analysis of the transient pressure reading of different taps, with higher spatial resolution. The resistance quantification was conducted in different zones by examining the slope of pressure drop per unite length (ΔP/L) vs v2 (v = superficial velocity) curves obtained at different suction pressure levels during sintering. Processes occurring in the RMR were further analysed and their contributions to the overall bed pressure-drop were quantified.
With the rapid rise in bed temperature during the sintering process and the overlapping temperature range for some of the processes, it was hard to distinguish each process uniquely. The starting temperature of the different processes was taken from the literature8,9,10,11,13,14,28) while a numerical model10,29,30) was used to estimate the end temperature of a process at which conversion of a specific species such as water content in granules and goethite, carbonates, coke etc., was at least 95%.
All these mentioned processes significantly depend on several factors such as reaction kinetics, particle diameter, local gas composition and pressure. For this reason, each of these processes does not have a well-defined completion temperature, which results in some inevitable overlaps between successive processes, as shown in Fig. 3. Due to the overlapping of different processes, the temperature range from 100°C to 1200°C (heating front) in RMR was defined as pre-melt reaction zone (PMRZ) and investigated as such.
3.2. Bed Pressure-drop
To quantify the pressure-drop contribution of each process, transient variations in pressure-drop in seven different sections of the sinter bed were analysed. These sections were classified as follows - section 0: bed top to tap 1, section 1: tap 1 to tap 2, section 2: tap 2 to tap 3, section 3: tap 3 to tap 4, section 4: tap 4 to tap 5, section 5: tap 5 to tap 6 and section 6: tap 6 to wind box (Fig. 1(a)). The pressure-drop in a particular section of the milli-pot bed was determined by taking the difference of the readings between the two adjacent pressure taps. In the humidified bed (HB) and sintered bed (SB) section, pressure gradient (pressure-drop per unit length) was measured to be ~37 kPa/m and ~3.5 kPa/m, respectively. The remaining pressure-drop occurred in the RMR, varying from 40 kPa/m in the top section to 100 kPa/m in the bottom section as the flame front moved from the top to the bottom of the bed. All the reported pressure-drop values above were obtained within ±10% deviation. The fraction of pressure-drop contribution measured in a section containing the RMR zone increased down the bed (from section 0 to 6). As sintering progressed, the temperature increased down the bed, resulting in a decrease in the thickness of the HB section, and an increase in the thickness of the SB section.
The pressure-drop within a section and movement of various processes at two different times during sintering, ~55% and ~75% sintering completion, in the RMR are shown in schematic form in Figs. 4 and 5. Within less than 1 minute (from t=14.1 min to 14.9 min) the first portion of the RMR (PMRZ) moved from section 2 to section 3, while the pressure drop contribution of section 2 dropped from 32.8% to 8.1% of the suction pressure and the pressure drop contribution of section 3 increased from 9.5% to 30.6% (see Fig. 4). Clearly the changing physical and thermal processes occurring in these sections must be critical to the overall resistance to flow. In comparison, the fully sintered and un-sintered region had relatively insignificant pressure-drop contributions i.e. sections 0, 1, 4, 5, and 6, at time 14 min, Fig. 4. The fully sintered regions (sections 0, 1) contributed to ~3% each of the overall pressure-drop. In contrast, the un-sintered region (humidified bed) contributed from ~12% to ~34% of overall pressure-drop due to unchanged physical and thermal processes in this region. The variation in pressure-drop contribution in humidified bed was due to the varied thickness of the section.
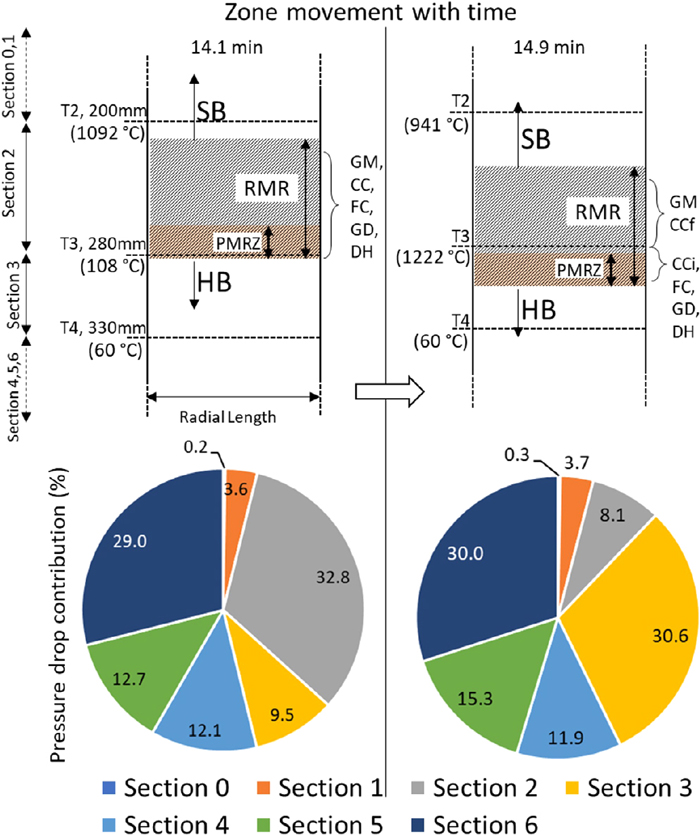
A common observation during sintering is that accumulation of heat occurs in the lower part of the bed and consequently thickness of the high temperature zone increases. The accumulation of heat was observed at 75% sintering where the thickness of RMR increased from ~65 mm to ~110 mm with sintering progression from ~55% to 75%. At 75% sintering completion, the pressure-drop contribution was dominated by section 4 and 5. The pressure-drop contribution significantly decreased from ~ 36% to 3% in section 4 and increase from ~19% to 52% in section 5 at 18.1 min and 18.6 min. During the same time, the RMR moved from section 4 to section 5. Figure 5 shows that pressure drop contributions of fully sintered (section 0 to 3) and un-sintered (section 6) regions remained unchanged and were ~3% and ~35%, respectively.
The pressure-drop variation was further investigated by quantifying the effect of individual processes. Figure 6 shows the variations in pressure-drop with a rapid rise in temperature at ~75% sintering completion for a coke rate of 7% at 10 kPa suction pressure. At t=18.1 min, section 5 and 6 both were humidified bed and had pressure-drop contributions of ~18% and ~34%, respectively. The difference was mainly due to the difference in heights of these two sections as the pressure gradient value (ΔP/L) was similar (~40 kPa/m ±5%). The measured temperatures of tap 5 at time 18.1 min and 18.57 min were 100°C and 1204°C (see Fig. 5), respectively which marked the movement of individual process from section 4 to section 5.

With the movement of the individual process from section 4 to section 5, the pressure-drop contribution of section 4 started to decrease rapidly from 36% and reached 3% within less than 1 minute, even though most of the high temperature zone (GM+CCf) was still contained in section 4. The pressure-drop contribution of section 5 increased from ~19% to 52% swiftly as the individual processes entered in section 5. The variation in pressure-drop contribution in section 4 and 5 indicated it to be due to the pre-melt processes. The main pre-melt reactions include de-humidification of water in the granules, goethite dehydroxylation, flux calcination and coke combustion. These individual processes collectively defined as PMRZ, contribute to the pressure-drop in bed.
In the course of granule de-humidification, the loss of water content leads to structural deformation of the granules which contributes to the corresponding increased pressure-drop.31) During the goethite dehydroxylation process, goethite particles release water vapours. Strezov et al. (2011) reported that during temperature rise, goethite particles physically deteriorate with the evolution of water during decomposition of the hydroxyl bonds in the goethite content32) and reduce the local bed voidage. Release of large volume for combustion gases results in high resistance during flux calcination and coke combustion processes. The same trend was observed for sintering at a different time and suction pressures (not shown here).
It is noted that the transition in bed structure is quite abrupt which led pressure-drop to shift quickly from one section to another. To capture the transition of the physical structure of humidified bed to sintered bed, an interrupted test was conducted where the sinter bed was quenched by flooding it with nitrogen during sintering. The quenched bed was set in resin to stabilise the structure prior to CT scanning. The CT image of the quenched bed is shown in Fig. 7. Unfortunately, the introduction of resin made it impossible to quantify the spatial distribution of voidage in the PMRZ and humidified bed due to the similar X-ray attenuation of resin and coke breeze. Although the spatial distribution of voidage in humidified bed was unknown, the overall voidage was estimated by volume balance. The overall voidage in humidified bed was ~0.34 compared to ~0.64 in the sintered bed. It was observed from the CT image that the transition from the humidified bed to a region with big channels occurred over a distance of ~10 mm to 20 mm. The abrupt transition of structure over a small distance was consistent with the steep change in pressure-drop within a small span of time.

Variation in air flow resistance in the bed was examined by dividing it into three separate zones, (i) Pre-melt reaction zone (PMRZ): DH + GD + FC+CCi combined, (ii) GM + CCf + sintered bed zone (SBZ) and (iii) Humidified bed zone (HBZ). To examine the resistance of different zones in the sinter bed, the ΔP/L and the superficial air flow rate were analysed. When a tap reached a temperature of 100°C, the bed height below that particular tap was taken as the thickness of HBZ. The thickness of PMRZ was calculated by multiplying the average flame front speed across the bed with the time difference when a certain tap temperature reached 100°C and 1200°C. The thickness of CCf, GM and SBZ was found by subtracting the thickness of PMRZ and HBZ from the total milli-pot height of 500 mm. The thickness of SBZ was also adjusted by assuming a linear progression of shrinkage with total sintering time.
The air flow resistance in the PMRZ was quantified by correlating pressure gradient (ΔP/L) with the specific kinetic energy of air flow (v2) at different suction pressure levels. These plots showed good linear correlations (R2 ≥ 0.96). The high suction across the bed results in faster movement of PMRZ which increases the uncertainty in temperature and pressure measurements, the same effect can be seen in relatively large variation in regression line for 14 kPa. The slope of these linear trends represents the resistance to air flow. It can be noted that Loo and Hutchens (2003)5) also reported that the resistance in flame front depends on suction pressure along with other parameters, although there was no quantification on the variation of air flow resistance with the suction pressure. It is apparent from Fig. 8 that the resistance in PMRZ is dependent on the suction pressure across the bed and the higher the suction pressure, the lower was the resistance in PMRZ and the opposite also held true.
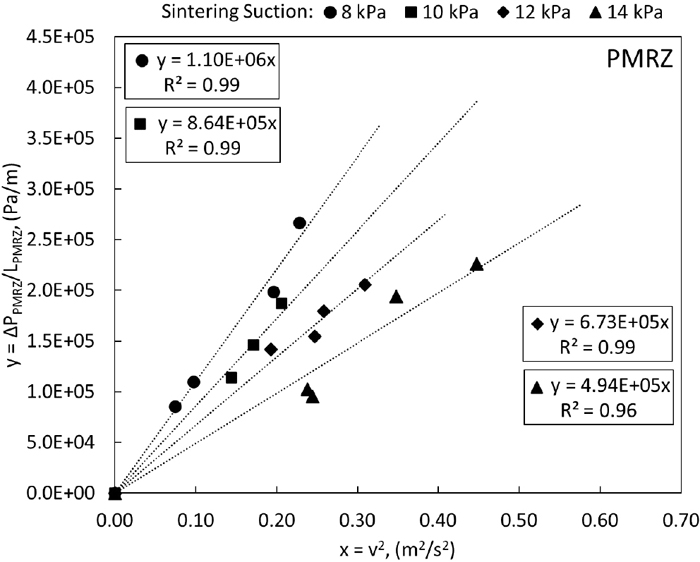
For further investigation, the resistance of PMRZ was obtained assuming it takes the form of Eq. (1), where v is superficial velocity (m/s), ρ is the density of air (kg/m3), ΔP/L is pressure gradient (Pa/m), R is the air flow resistance (1/m) and P is the permeability (m) of the packed bed. The superficial velocity and air density were taken at the inlet conditions of 25°C and 101 kPa.
|
ΔP
L
=R*
ρ
v
2
2
=
1
P
*
ρ
v
2
2
| (1) |
In a similar manner, the air flow resistance in the other two zones, HBZ and GM+CCf+SBZ was also estimated and compared with PMRZ in Fig. 9. The resistance was calculated at different tap locations and averaged for a particular case. The comparison clearly shows that the resistance in the PMRZ is dominant compared to the other two zones for all cases. Resistance of the GM+CCf+SBZ was almost negligible which can be attributed to the formation of large flow channels during the melting of granules (see Fig. 7). High resistance of the PMRZ was due to physical transformation of the bed, coupled with volumetric expansion of air and higher gas viscosity in the vicinity of high temperature zone. In contrast, although gas viscosity was higher in the GM+CCf+SBZ, bed voidage was comparatively large which resulted in lower air flow resistance.

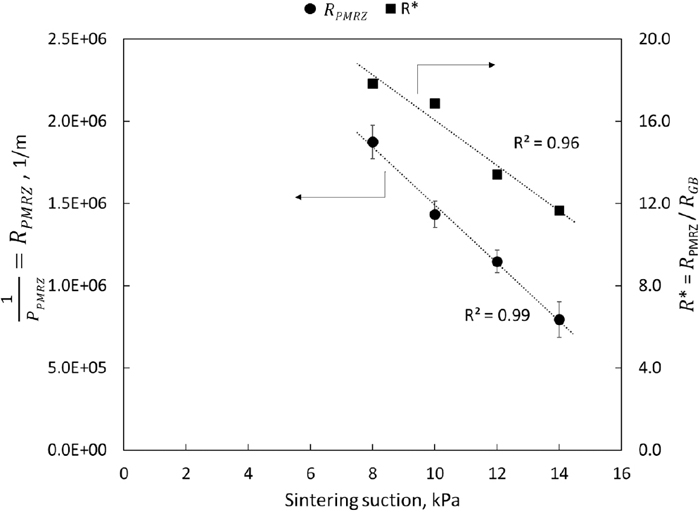
The permeability of the PMRZ (inverse of resistance in PMRZ, RPMRZ) was investigated at different suction pressures across the bed. The permeability of the PMRZ was low for a low suction pressure and showed an increasing trend with suction pressure across the bed, Fig. 10. The PMRZ contains a number of different reactions with reaction rates that may vary with suction pressure. It is thought that a high rate of coke combustion at a high suction pressure (high excess oxygen supply) will produce a relatively high voidage in PMRZ which will increase the permeability of this zone. Similar results were reported by Loo and Hutchens (2003) where the 1/k5 factor (equivalent to permeability) was low for low suction pressure compared to high suction pressure across the bed.5) The non-dimensional bed resistance R* expressed as the ratio of RPMRZ to the corresponding green bed resistance (RGB), showed a decreasing trend with suction pressure during sintering, Fig. 10.
On a sinter strand, the yield and the productivity of the sinter product (+5 mm sinter product in tonnes/day/m2) are the two key outcomes to be controlled. The resistance to air flow in the bed, the raw mix composition and the total suction pressure across the bed are the main factors to control the agglomeration of the particles which subsequently effects the sinter product yield and productivity.
The variation in yield, productivity and sintering time were analysed with sintering suction and shown in Figs. 11(a) and 11(b). The yield was over ~0.7 within a small range between 0.74 to 0.76 and remained almost unchanged with suction in all cases except 8 kPa (0.62) which might be attributed to excessive melting. The similar observations were reported by Loo et al. (2012) where the highest flame front speed was observed at high suction value across the bed.2) Umadevi et al. (2013) also investigated the sinter quality for varied suction pressure and reported that the sinter strength (tumble index and sinter mean size) increased with suction from 9 kPa (15 kPa/m) to 13 kPa (21.7 kPa/m) and then decreased with suction up to 17 kPa (28.3 kPa/m), even though the holding time over 1200°C was high for 9 kPa suction pressure.11) There was no explanation provided for the reported peak of sinter strength at 13 kPa. The effect of excessive melting of the granules on sinter yield was also reported by Zhang et al. (2018) and Harvey et al. (2019).33,34)
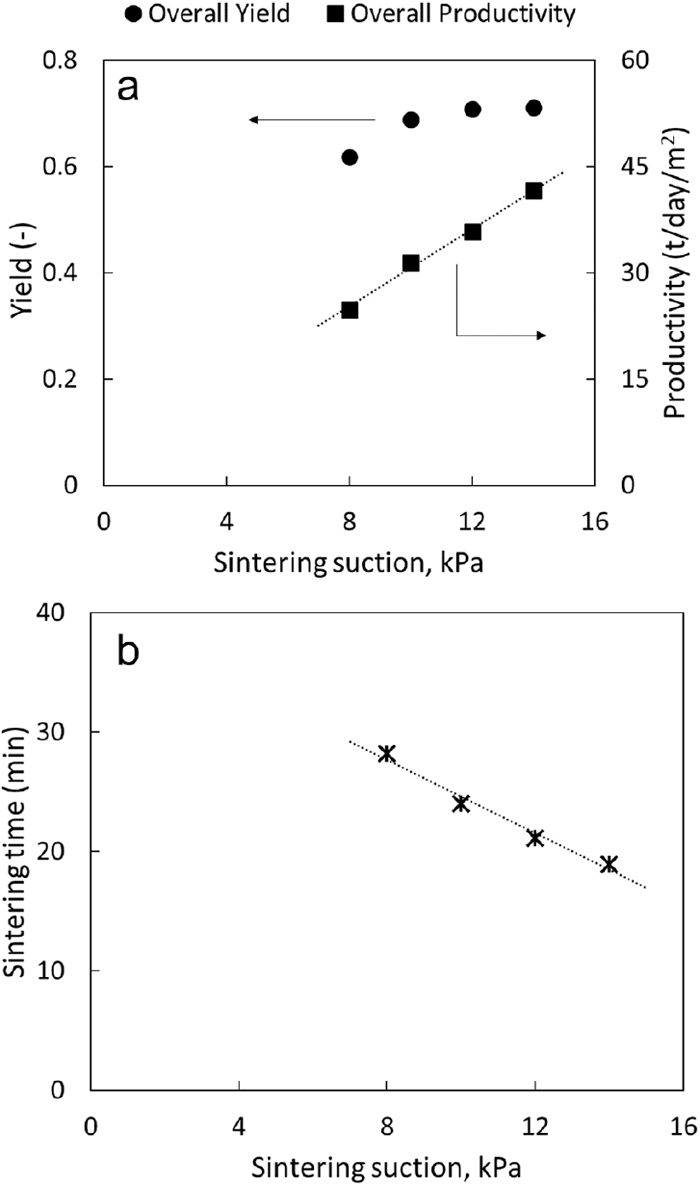
A high suction pressure generates a low air flow resistance in the bed which in-turn will decrease the sintering time (faster flame front speed), while maintaining a high peak sintering temperature and residence time at high temperature (for acceptable yield) improves the productivity of sinter product. The overall productivity was highest (41.5 t/day/m2) for the lowest resistance to air flow at 14 kPa suction pressure in the bed was mainly due to relatively lower sintering time.
3.5. Sinter Yield Prediction
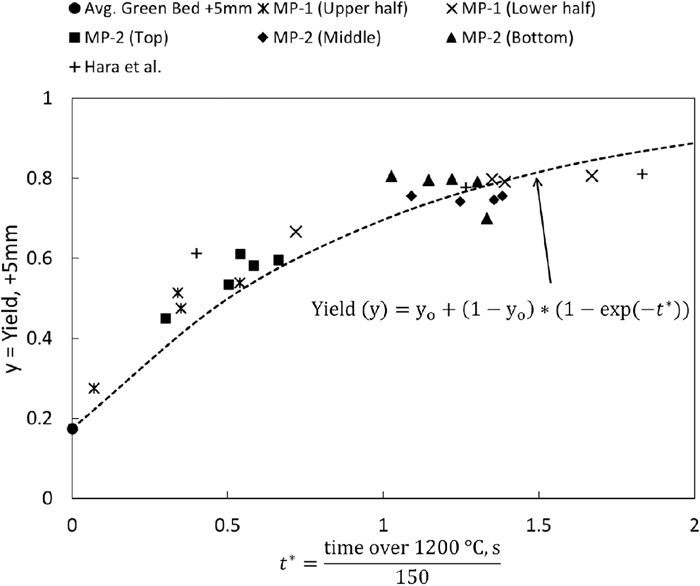
A specific focus of this study was to establish a functional dependency of the sinter product yield on residence time at high temperature to describe the process dynamics. Often the enclosed area over 1100°C is used to quantify the sinter strength.2,3,35) In this work, a high residence time at temperature over 1200°C (defined as holding time over 1200°C) is believed to produce a sinter product with a relatively high yield value.23,36) The increment in thickness of the high temperature zone in the bottom part of the bed produces large values of holding time over 1200°C resulting in higher yield in the lower sections. In the present work, it was noted that the extent of sintering in the lower half of the milli-pot was relatively better than the upper half and a minimum holding time over 1200°C of 150 seconds was recorded. This resulted in a minimum 70% yield, which is consistent with previous work.14)
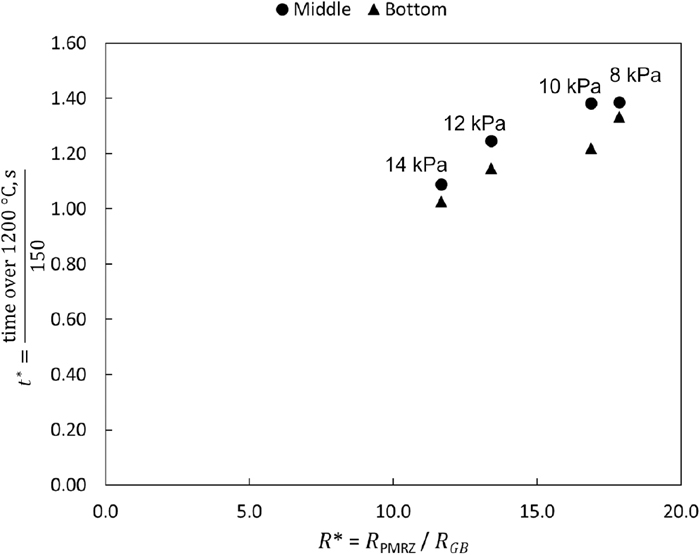
Among all discussed zones, it was observed that resistance in PMRZ was maximum and acted as the bottleneck to the air flow. A high value of R* (high PMRZ resistance) will produce a high holding time over 1200°C in bed. A non-dimensional holding time (t*) was introduced by normalising the holding time over 1200°C by the minimum time for 70% yield i.e., 150 s to compare it with R*. In Fig. 12, the ‘t*’ was plotted with ‘R*’ in the middle (tap location: T3 and T4) and bottom part (tap location: T5 and T6) of the bed for sintering experiments at different suction pressure. It was observed that the t* was high for a high R* value as discussed. Note that for the 8 kPa suction pressure single temperature tap measurements T3 and T6 only were used due to issues with the other thermocouples.
The yield values obtained from both present experiments and previous work were collectively examined and it was found that the yield was highly dependent on the holding time above 1200°C. The sinter yield varies from 0 to 1 and a limited range function i.e., exponential growth function with a range from 0 to 1 was assumed to predict yield by taking t* as a fitting parameter after minimising the sum of squared errors between experimental and predicted results. The proposed function for predicting the product yield (y) for a given green feed of +5 mm size fraction as follows:
|
y=
y
o
+(
1-
y
o
)
*(
1-exp(-
t
*
)
)
| (2) |
where y is the yield (–), yo is the green bed +5 mm fraction and t* is the normalised dimensionless time.
In Eq. (2), a green feed +5 mm fraction (yo) was measured initially in all the experiments, and an average value of 0.175 was used. The predicted yield value is compared with yield data from Hara et al. (2019)23) and this study in Fig. 13, which shows a good agreement with the root-mean-square deviation = 0.05. It should be noted that the variation in sinter yield for t*>1 is not as significant as for t*<1 which can be seen in yield of middle and bottom for MP-2. It has been observed that high t* results in excessive melting which reduce the yield. The present equation does not account for the effect of excessive melting at high t* values, which is the subject of future work.