Regular Article
Direct Observation of Atomic Arrangement in Multicomponent Calcium Ferrite Using Scanning Transmission Electron Microscopy

2023 Volume 63 Issue 10 Pages 1567-1575
Details
2023 Volume 63 Issue 10 Pages 1567-1575
To reduce the reducing agent ratio and CO2 emissions in blast furnace operation, it is important to control the material structure of sintered ore, which affects its metallurgical and mechanical properties. Multicomponent calcium ferrites (also called CF or SFCA (silico-ferrite of calcium and aluminum)), which is a type of melting and solidification structure, has attracted considerable interest recently, and the chemical composition and crystal structure of each CF have been researched. Although the crystal structure of CF has conventionally been analyzed mainly by XRD, the atomic arrangement could not be observed directly. Therefore, in this study, CF was investigated at the atomic level by scanning transmission electron microscopy (STEM). This research revealed that acicular CF, which was previously understood to be SFCA-I, has a SFCA (≠ SFCA-I) structure. It was also found that columnar CF had a non-periodic SFCA structure induced with a magnetite-like structure. Furthermore, a CF in which SFCA and SFCA-I were alternately stacked repeatedly was also discovered. This research clarified the fact that CF has a non-periodic structure at the atomic level.
In recent years, the steel industry has been required to reduce CO2 emissions and decreasing the reducing agent ratio in the blast furnace is an urgent issue for achieving this goal. In blast furnace operation, it is important to control and improve the quality of the raw materials, represented by reducibility and strength, and especially the properties of sintered ore, which is one of the main iron sources. The main chemical components of sintered ore are Fe, O, Ca, Si, Al, and Mg, and it is produced by agglomerating iron ore, limestone, and auxiliary raw materials at a high temperature. Sintered ore is also a complex material composed of various oxides such as hematite, magnetite, calcium ferrite (CF), calcium silicate. In particular, many studies of CF have been done because it is the major binding phase and has a lot of structures.
The crystallographic, morphological, and chemical characteristics of CF have been studied extensively.1) Among its crystallographic structures, a large number of CF structures have been reported. As simple binary types of CaO and Fe2O3, CaFe2O4,2) Ca2Fe2O5,3) CaFe4O74) are known. On the other hand, it is known that laboratory or actual sintered ore contain many multicomponent CF structures, represented by silico-ferrite-calcium-aluminate (SFCA).1,5,6,7,8,9) The structures of these SFCAs have been analyzed extensively by X-ray diffraction (XRD) measurement, and the structures SFCA,6) SFCA-I,7) SFCA-II,8) and SFCA-III9) have been reported. These structures can be treated as stacked structures of spinel (S) and pyroxene (P), in which the atoms are arranged in the order ‘SP-SP-’ in SFCA and ‘SSP-SSP-’ in SFCA-I.
In the morphological classification of CFs, acicular structures and columnar structures are known, and these structures seem to change depending on various factors such as the cooling rate and composition.1) Although it is known that structures which appear to be acicular or columnar in cross-sectional observation have a complicated structure such as a plate-like structure,10,11) in this study, we will refer to these structures simply as acicular and columnar. Regarding the effect of morphology on reducibility, it has been reported that sintered ore having an acicular structure had better reducibility than that with a columnar structure,12,13) and the acicular structure is considered preferable. Although SFCA is thought to be columnar, and SFCA-I is considered to have an acicular structure based on a comparison of observation and XRD analysis results,1,14,15) the conventional research does not include direct crystallographic identification of each area in sintered ore.
Structural analysis by XRD is an effective technique for analyzing the crystal structure, but as mentioned above, the structure of sintered ore is very complex, and it is difficult to analyze local disturbances in the crystal structure by XRD since the diffraction patterns obtained by XRD measurements represent an average phase. Furthermore, since the general XRD measurement technology has low spatial resolution, it is very difficult to compare the correspondence of XRD results with the structures obtained by observation.
Recently, Murao and Miki reported a method of evaluating the structure of sintered ore by electron backscatter diffraction (EBSD) as a crystallographic phase identification method with high spatial resolution.16) In EBSD, crystal information (Kikuchi pattern) is obtained for each area with a focused electron beam (FIB), and the closest structure at each point is selected by comparison with the reference from a candidate structure. While it is possible to evaluate the crystal phase fraction with a certain degree of spatial resolution, it is difficult to explain all the Kikuchi lines because this analysis technique uses very complex data and is also very sensitive to surface conditions such as damage on the sample.
To further understand the atomic arrangement of the crystals on each CF, such as acicular or columnar, in this research, we analyzed the structure of CFs by scanning transmission electron microscopy (STEM), which is very useful for direct observation of the atomic arrangement at higher spatial resolution. In this study, acicular and columnar CFs were evaluated and suitable areas for investigation were selected by using EBSD, and STEM samples were prepared. The atomic arrangements and composition distributions of each CF were then discussed based on the results of STEM observation and atomic-level energy dispersive X-ray spectroscopy (EDS).
As samples, sintered ore prepared in the laboratory with the chemical compositions shown in Table 1 were used. Sinters 1 and 2 were prepared by sintering under the conditions of 4.0 mass% and 4.5 mass% coke breeze, respectively, by a pot test. Sinter 3 was produced by mixing iron ore, silica powder, and limestone and tableting, followed by sintering in an electric furnace. The sintering conditions of Sinter 3 was 1200°C in an air atmosphere. Table 1 shows that the FeO content of Sinter 3 is 0.0 mass%, but it is possible that trace amounts of Fe2+ was present in the microstructure due to residual Fe2+ from the raw material. Observation was performed after these samples were processed as specimens for cross-sectional observation. Here, three sintered ore samples were used due to the difficulty of finding the optimum area for STEM observation, as explained in the next paragraph. The optimum areas were found for acicular CF in Sinter 1, for columnar CF in Sinter 2, and SFCA-I in Sinter 3, respectively.
| T. Fe | FeO | SiO2 | CaO | Al2O3 | MgO | |
|---|---|---|---|---|---|---|
| Sinter 1 | 57.4 | 4.0 | 5.3 | 10.3 | 2.1 | 0.5 |
| Sinter 2 | 58.1 | 8.3 | 5.2 | 10.0 | 1.9 | 0.4 |
| Sinter 3 | 56.2 | 0.0 | 6.0 | 12.1 | 1.0 | 0.1 |
For atomic resolution STEM observation, it is necessary to observe the sample from the direction of the zone axis. Therefore, in this study, the crystal phase and crystal orientation were identified from the cross-sectional sample of the sintered ore by EBSD, and the area where the crystal zone axis was oriented in the horizontal direction of the sample surface was selected. The STEM samples were then processed by FIB (JEOL, JIB-4700F) so that the crystal zone axis was in the direction perpendicular to the thin film. SEM observation and EBSD were performed (JEOL, JSM IT800HL) at an acceleration voltage of 15.0 kV and an irradiation current of 90 nA. To compare the results obtained by STEM observation and the CF structure, structural models were drawn using VESTA.17)
2.2. Observation by Scanning Transmission Electron MicroscopyFor atomic resolution structural analysis, STEM was performed. In STEM observation, a row of atoms (atomic column) can be observed from the direction of the crystal zone axis, and the crystal can be observed as if it were an orthographic projection. Simultaneous measurement by the annular dark field method (ADF) and the annular bright field method (ABF) is also possible in STEM observation. Because ADF has the feature of obtaining contrast roughly proportional to the square of the atomic number of the observed atomic column, an atomic column having atoms with a high atomic number such as Fe has a large contrast, but light elements such as O display a weak contrast, so simultaneous observation with heavy elements is difficult. On the other hand, the advantage of the ABF method is that light and heavy elements can be observed simultaneously. Therefore, it is possible to identify the positions of atomic columns such as Fe and O that constitute SFCA by combining the ADF method and the ABF method. STEM observation also enables elemental mapping with atomic resolution in combination with EDS. If an atomic column contains a mixture of various elements, it is difficult to identify the element species that constitute that column. Therefore, in this study, observation and EDS analysis were performed from the direction where the elements of the SFCA structure could be observed relatively separately (e.g., SFCA [0 -1 1]). STEM observation (JEOL, JEM-ARM200F NEOARMex) and EDS mapping (JEOL, EDS_Dual-SDD, detector area: 158 mm2) were performed at an accelerating voltage of 200 kV. The acceptance angle of the detector was 49 to 197 mrad for the ADF method and 12 to 19 mrad for the ABF method.
Figure 1(a) shows an SEM image of acicular CF observed at Sinter 1. In this texture, a lot of pores existed between CFs as previously reported.10,11) EBSD was performed in the area indicated by the white frame. Figure 1(b) shows an IPF (Inverse Pole Figure) map of the area identified as SFCA by EBSD. As a result of EBSD, most of this region was determined to be SFCA with a confidence index (CI) > 0.1. Next, the area where SFCA [0 - 1 1] existed in the horizontal direction of the sample surface was searched from the IPF map, and the area indicated by the yellow frame in the STEM sample was processed by FIB. Since this area was the region where the SFCA [0 -1 1] direction was parallel to the longitudinal direction of the needle, STEM samples were taken in the area shown by the yellow frame.

Figure 2(a) shows a low magnification ADF-STEM image. The area indicated by the white arrow was the crystal determined to be SFCA [0 -1 1] by EBSD. Figure 2(b) shows a high magnification ADF-STEM image of the area shown in Fig. 2(a). In the ADF-STEM image, the white dots represent atomic positions. In this view, the atoms were regularly arranged, and a periodically uniform structure was observed.

In order to understand the atomic positions in the STEM image, Fig. 3 shows schematic images of those observed from the zone axis of SFCA measured by EBSD and SFCA-I as a reference.7) Sites occupied by multiple atoms are color-coded to reflect their ratios. It should be noted here that the structure of SFCA reported by Hamilton et al.6) was thought to contain typographical errors, as reported by D. C. Liles et al.18) Therefore, in this study, the SFCA structure measured by Mumme et al.7) was used as a model. SFCA is a model viewed from the [0 -1 1] direction, and SFCA-I is a model viewed from the [0 1 0] direction. These figures show the structures seen from the direction parallel to the stacking plane of the spinel and pyroxene structures. The appearance of the spinel layer is also relatively similar in these models. However, the pyroxene structure has different atomic arrangements in SFCA and SFCA-I. Specifically, the Ca columns indicated by the red frames in the two structures are arranged in a row in SFCA, but are arranged in a zigzag manner in the [0 1 0] direction in SFCA-I. Therefore, in SFCA-I, the two Ca columns appear to be closely aligned. In SFCA-I, Ca replaces Fe in the atom column indicated by white arrows. Thus, despite their similar pyroxene structures, differences of this type exist in SFCA and SFCA-I.
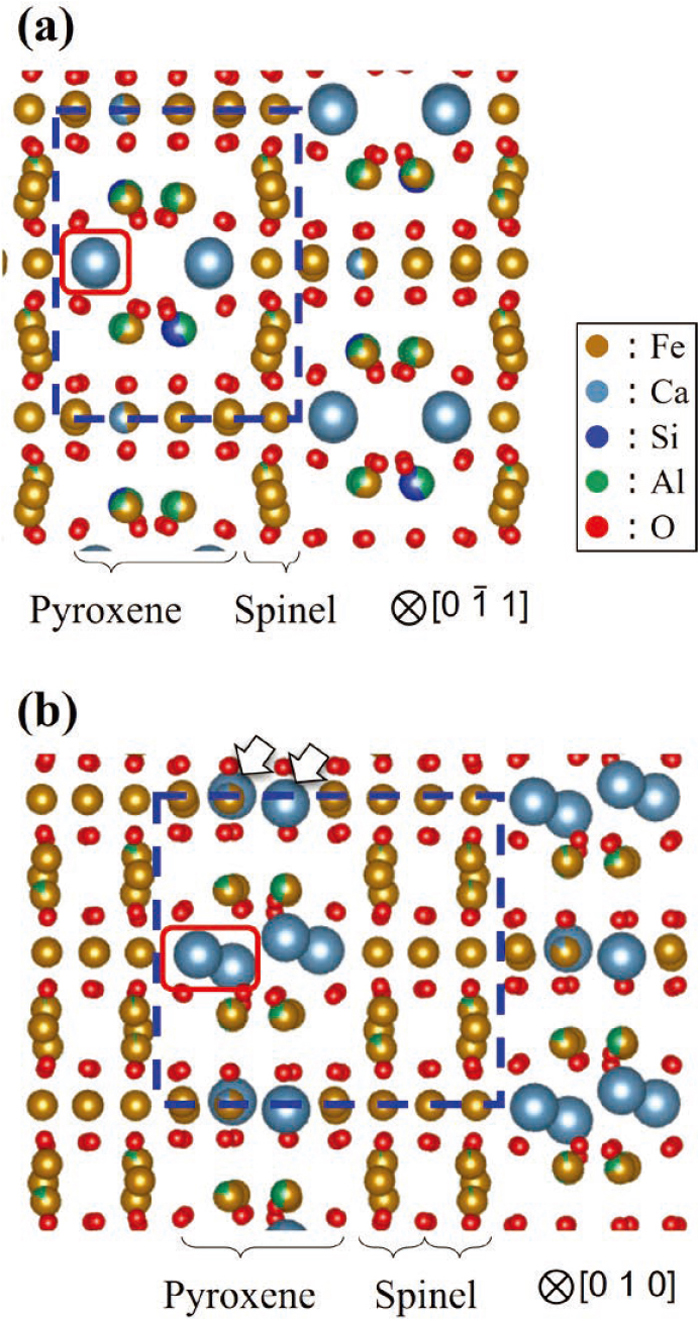
Figure 4(a) shows a high magnification ADF-STEM image with the structural model of SFCA. From this comparison, it was found that the cation (Fe, Ca, Si, Al) column positions coincided with the atomic positions in the ADF-STEM images. The contrast of the atomic columns indicated by the yellow arrows was large, and therefore was presumed to indicate an Fe column based on the above-mentioned Z-contrast. Although the interatomic distance between these atoms was less than 2 Å, the atomic columns were clearly separated in the STEM observation results. Figure 4(b) shows an ABF-STEM image obtained simultaneously with Fig. 4(a). In the ABF-STEM image, the dark dots represented the positions of atomic column. Comparing these observational results with the structural model, weakly contrasting atomic columns (indicated by white arrows), which were not visible in the ADF-STEM image, could be observed in the ABF image. These positions corresponded to the positions of the oxygen columns in the structural model.

Figure 5 shows the atomic level EDS mapping and the ADF-STEM image acquired simultaneously. Focusing on the mapping of Ca and Fe, the positions of each atom in the structural model match very well. On the other hand, Si and Al were abundantly present at the atomic positions indicated by the white arrows in the Fe mapping. As for the mapping of oxygen, since oxygen is distributed over a wide range of this structure, O is detected throughout.

Figure 6(a) shows the SEM image of the columnar CF in Sinter 2. The thickness of CF exceeded 10 μm. Figure 6(b) shows the result of extracting the area where the SFCA [0 -1 1] direction is parallel to the plane of the sample surface by EBSD with CI > 0.1. The area indicated by the yellow frame was processed as a STEM sample. As in the acicular CF observed above, the longitudinal directions of the column and SFCA [0 -1 1] were parallel, so the STEM sample was cut in the direction perpendicular to the column.

Figure 7(a) shows a low magnification ADF-STEM image of columnar CF in Sinter 2. The dark area was the vacuum, and the top of the sample was the sample surface. The edges of this crystal were confirmed as indicated by the white arrows, and it was found that this crystal was tilted about 57° with respect to the surface. Figure 7(b) shows a middle magnification ADF-STEM image. Linear contrast was present at a tilt of about 57° to the surface. From the Z-contrast described above, it was presumed that Fe atoms with a large atomic number existed in linear regions with higher contrast.

Figure 8 shows a high-magnification ADF-STEM image of columnar CF. For high-magnification observation, the samples were rotated 57° so that the linear texture was oriented upwards to facilitate understanding of the structure. As a result of STEM observation, it was found that most of this area had the same structure as the SFCA in Fig. 4. On the other hand, the linear texture was found to be an atomic structure with a square arrangement. Assuming that the square atomic arrangement is 1 unit, the thickness of the linear texture varied by location, ranging from 1 to 5 units.

Figure 9 shows the ADF-STEM image and the results of EDS mapping acquired simultaneously for the columnar CF in Sinter 2. Focusing on the elements in the linear texture, compared to the surrounding SFCA, it can be seen that the Fe and O concentrations are high, and the ratios of the other elements are very low.

Figure 10(a) shows an optical microscope image of Sinter 3. In this observation, EBSD was performed in the area indicated by the white frame. Figure 10(b) shows the IPF map of the region identified as SFCA-I by EBSD. The SFCA-I in this region was found to consist of very small fine crystals. The area indicated by the white arrow in Fig. 10(b) was the region where the SFCA-I [1 0 0] direction was parallel to the plane of the sample surface, and this position was processed as a STEM sample.

Figure 11 shows a low magnification ADF-STEM image. As in the SFCA in Fig. 7, linear structures with high contrast are widely present, indicating a non-periodic structure.

Figure 12(a) shows a high magnification ADF-STEM image at atomic resolution. Linear textures with high contrast were present with different thicknesses. Figure 12(b) shows a high magnification ADF-STEM image with the structural models of SFCA-I and SFCA. Comparing the atomic positions considered to be cations in the linear texture with the cation positions viewed from [1 0 0] of SFCA-I in the figure, it was found that these positions were in agreement. However, the cation positions in the low-contrast region coincided with the cation positions in the structure viewed from the [1 -1 0] direction of SFCA.

Figure 13 shows the ADF-STEM image and the results of EDS mapping acquired simultaneously for Sinter 3. It can be seen that the concentrations of Fe and O are high and Ca is very low in areas with high contrast, and conversely, the region corresponding to the pyroxene structure of SFCA-I has a structure which in rich in Ca and low in Fe and O.

First, the crystal structure shown in Fig. 4 is considered. As mentioned above, the atomic arrangement observed in Fig. 4 was consistent with the cation and oxygen positions viewed from the SFCA [0 -1 1] direction. Based on this consistency and the EDS mapping results in Fig. 5, especially for Ca and Fe, the structure of the acicular CF in this study could be SFCA. However, Webster et al.14,15) reported that acicular CF is SFCA-I. Since the structure in this study could not be SFCA-I, the direct observation in this study indicated the possibility that acicular CF also has an SFCA structure. XRD is a very effective method for evaluating the average crystal structure of a sample, but for analyses that require spatial resolution, such as correspondence with the sample morphology, a direct analysis like that in this study is important.
Next, the chemical distribution was considered. In the structural model according to Mumme et al.,7) Si and Al are partially substituted at the atomic positions of the Fe atoms that compose the atomic columns indicated by the white arrows in Fig. 5. According to the structural model, either Si or Al is present. Hamilton et al.6) assumed that the Fe forming the tetrahedra was substituted with Si and Al and considered that Si was substituted for Al in the tetrahedra when Si was excessive. In addition, Al can be both tetracoordinated and hexacoordinated, suggesting the possibility of substitution at any site of Fe. Sugiyama et al.19) also reported that Al exists in both tetrahedra and octahedra and Si exists in tetrahedra in the structural analysis of SFCA when MgO is added. From the EDS result in the present study, it was found that both Si and Al were more present in the tetrahedra indicated by the white arrows in Fig. 5 than at other sites. Moreover, Si and Al were also distributed with a nonuniform concentration ratio. In structural analyses by XRD, the occupancies of the cationic species is evaluated from the XRD patterns of the sample, but in this study, we found that the concentration of SFCA differs at the atomic level.
4.1.2. Crystal Structure in Columnar CFNext, the CF structure and linear texture observed in the columnar CF in Fig. 8 are examined. Since most of this area has the same structure as the model seen from the direction of SFCA [0 -1 1] mentioned above, it is considered to be an SFCA-based crystal. However, from the EDS results in Fig. 9, the linear structure is considered to be an iron oxide. Among hematite, magnetite, and wüstite, the structure viewed from the magnetite [1 -2 1] direction matched the structure modeled as the present structure. The oxygen concentration of magnetite calculated from the structural model was 0.543 atom-O/Å3 and that of the SFCA was 0.510 atom-O/Å3. Therefore, the tendency is consistent with the result of Fig. 9, which showed that the oxygen concentration is high in the linear texture. Figure 14 shows a high-magnification ADF-STEM image and the structural models of magnetite and SFCA. Considering these structures, it was found that the SFCA and magnetite-like structures face each other through the spinel layer on SFCA perpendicular to the stacked structure of spinel and pyroxene (S, P stacking).

As mentioned in connection with Fig. 7, these magnetite planes were formed parallel to the longitudinal direction of the columnar CF. Although it is unknown whether the columnar CF grows in the longitudinal direction or in the circumferential direction, it is presumed that such a non-periodic layer is formed depending on the ambient concentration during growth.
Thus, the direct observation in this study revealed that a fine structure which was determined to be magnetite was inserted into the region perpendicular to S, P stacking.
4.1.3. SFCA-I and SFCA Structure in TabletFinally, the SFCA-I and SFCA in Fig. 12 are considered. As discussed in section 3.3, this structure agrees with the model cation positions observed from the SFCA-I [1 0 0] and SFCA [1 -1 0] directions. This difference in appearance originates from the difference in the pyroxene structure between SFCA-I and SFCA and the difference in S, P stacking described in 3.1. In addition, in the EDS map in Fig. 13, the positions where the concentrations of Ca and Fe are high in the region considered to be SFCA-I matched the positions of Ca and Fe in the model. From these results, the structure with high contrast in Fig. 13 is considered to be SFCA-I structure, and from the cation position, the adjacent texture with weak contrast in the ADF-STEM image is presumed to be SFCA. Thus, it is suggested that the regions identified as SFCA-I by EBSD may also have a structure in which fine SFCA and SFCA-I exist in a linear, sterically plate-like structure. The interfaces were through the spinel layer, as in the previous section.
In this study, it was found that SFCA and SFCA-I have extremely non-periodic structures at the atomic level perpendicular to S, P stacking.
4.2. Non-Periodic Stacks in CFIn the previous section, the non-periodic structures of SFCA and magnetite and of SFCA and SFCA-I were clarified. In this section, the atomic arrangement of the intervening spinel layer is investigated in order to evaluate the crystal consistency.
Figures 15(a) and 15(b) show the crystal structures of SFCA and magnetite, and Figs. 15(c) and 15(d) show the polyhedral arrangement when observed parallel to and perpendicular to the plane of the page. It can be seen that the spinel layer on SFCA has almost the same atomic arrangement as the magnetite phase, although it is somewhat distorted. The polyhedra of SFCA and SFCA-I observed perpendicular to the S, P stacking plane were almost the same in both crystal structures. In other words, the spinel layers in SFCA, SFCA-I, and magnetite have almost the same atomic structure, indicating very good consistency.

The SFCA and SFCA-I structures in CF are considered to be crystals that formed preferentially depending on the element distribution and temperature conditions of crystal growth. When these crystals are generated in a nonuniform atmosphere, it is thought that each crystal structure is formed non-periodically through the easily matching spinel layer. Here, SFCA, SFCA-I, SFCA-III, etc. are discussed depending on the number of stacked spinel layers. For example, the adjacent area of SFCA/SFCA-I obtained in Fig. 12 is arranged as SP-SSP, so it can be locally called SFCA-II, and SFCA-III is a crystal with a pyroxene structure similar to the SFCA and SSSP stacking structures.
Thus, as a result of this observation, it was possible to understand the atomic arrangement of each crystal by direct STEM observation and EDS mapping with atomic resolution, and non-periodical SFCA structures could be recognized. In CF structures, SFCA, SFCA-I, and magnetite-like structure can be alternately stacked through the spinel layer. On the other hand, the structure of the pyroxene in this observation also differed in the atomic arrangements of SFCA and SFCA-I, as described in 3.1 and 4.2. Therefore, in multicomponent CF, there are infinite candidates for the SFCA structures depending on the number of stacked spinel layers, the combination of stacked layers such as SP-SSP, and the atomic arrangement of pyroxene. Therefore, in future XRD and EBSD research, analyses based on the premise of nonuniformity at the atomic level, rather than uniform crystal structures, will be needed.
In this study, direct STEM observation and atomic resolution EDS were used to analyze the multicomponent CF structure in sintered ore, and the following findings were obtained.
(1) Conventionally, the CF that forms an acicular structure has been considered to be SFCA-I, but the STEM images and EDS results in this study revealed that the acicular structure is the SFCA structure at the atomic level. Thus, it should not be concluded that a crystal structure is SFCA-I simply because it has an acicular structure.
(2) As a result of EDS mapping, it was found that the Si and Al in the SFCA structure are nonuniformly distributed at the atomic level.
(3) Observation of the columnar structure revealed a magnetite-like structure induced in SFCA. Furthermore, a structure in which SFCA and SFCA-I were non-periodically stacked was observed in the tablet sample. An analysis of the structural model showed that these structures can be continuously connected with good consistency through the spinel layer. Care is necessary if multicomponent CF is treated as a homogeneous structure, as a discussion that considers the elemental distribution, non-periodical stacking structure, and other actual characteristics of the material is needed.
The authors are grateful to Dr. Nakamichi (General Manager, JFE Steel Corporation) and Dr. Ishida (former JFE Steel Corporation Researcher) for their helpful discussion of EBSD and the structure of CF. We would also like to thank the researchers of JEOL Ltd. for their thoughtful advice concerning STEM and EBSD. Finally, we are indebted to the members of Research Group “Multi-scale evaluations on microstructures of high-quality iron ore sinters” of ISIJ.